A Fuzzy Least Squares Support Tensor Machines
in Machine Learning
http://dx.doi.org/10.3991/ijet.v10i8.5203
Ruiting Zhang
1,2, Zhijian Zhou
1 1China Agricultural University, Beijing, China 2 Beijing Technology and Business University, Beijing, ChinaAbstract—In the machine learning field, high-dimensional data are often encountered in the real applications. Most of the traditional learning algorithms are based on the vector space model, such as SVM. Tensor representation is useful to the over fitting problem in vector-based learning, and tensor-based algorithm requires a smaller set of decision variables as compared to vector-based approaches. We also would require that the meaningful training points must be classified correctly and would not care about some training points like noises whether or not they are classified correct-ly. To utilize the structural information present in high dimensional features of an object, a tensor-based learning framework, termed as Fuzzy Least Squares support tensor machine (FLSSTM), where the classifier is obtained by solving a system of linear equations rather than a quadratic programming problem at each iteration of FLSSTM algo-rithm as compared to STM algoalgo-rithm. This in turn provides a significant reduction in the computation time, as well as comparable classification accuracy. The efficacy of the pro-posed method has been demonstrated in ORL database and Yale database. The FLSSTM outperforms other tensor-based algorithms, for example, LSSTM, especially when training size is small.
Index Terms—Alternating projection, Least square support tensor machines, Support tensor machines, Tensor learning.
I. INTRODUCTION
With the development of our society, a tremendous amount of data have continuously flooded into our socie-ty. The explosive growth of data has generated an urgent need for new techniques and new skills in the data mining areas. Machine learning is an important branch of data mining. In the machine learning areas, the representation of data is one of the core tasks. High dimensional data are often encountered in the real applications. Thus, how to efficiently represent image data has a fundamental effect on the classification. Most of the traditional learning algo-rithms are based on the vector space[1,2], such as SVM and LSSVM.
However, in practice, images are intrinsically matri-ces(the second order tensor). A lot of objects need to be expressed in tensor. For example, the gray image and the gray image sequence can be represented by the second order tensor and the third order tensor (the examples can be seen in Fig. 1 and Fig. 2, respectively). To represent the images appropriately, it is important to consider trans-forming the vector patterns to the corresponding matrix patterns or second order tensors before classification. In this way, it has the following drawbacks: (1) Destroying the data structural information, (2) Leading to high
dimen-sional vectors, (3) Occurring over-fitting problem. In other words, some implicit structural or local contextual infor-mation may be lost in this transforinfor-mation. Moreover, the higher the dimension of a vector pattern is, the more space is needed for storing it.In recent years, because of the above three main drawbacks, algorithms based on tensor space have attracted significant interest from the research community. Several algorithms have been extended to deal with tensors, such as support tensor machine (STM) [3-9], multi-linear principal component analysis (MPCA) [10], multi-linear discriminant analysis (MDA) [11], ca-nonical analysis correlation of tensor (CAC) [12] and non-negative tensor factorization (NTF) [13]. With utilizing the tensor representation, the number of parameters esti-mated by the tensor-based learning can be greatly reduced. Therefore, the tensor-based learning algorithms are espe-cially suitable for solving the small-sample-size (S3) prob-lem, where the number of samples available for training is small and the number of input features used to represent the data is large. At the same time, involving high-dimensional data can also reduce the computational com-plexity observed in problems.
Figure 1. A gray image can be represented by a matrix
Figure 2. 3rd order tensor representation of a gait sequence.
Least Squares support vector machine (LSSVM) was proposed by Suykens and Vandewalle [14], which not only replaces the inequality with the equality in the defin-ing constraint structure of SVM, but also replaces the absolute error measure by the squared error measure in the object function. LSSVM require the solution of a system of linear equations rather than a quadratic programming problem compared with SVM, which leads to an
extreme-ly fast than traditional SVM. Due to its extraordinary generalization and computational time, LSSVM has been a powerful tool for solving binary classification problems in machine learning. However, in many practical engi-neering applications community, the training data is often corrupted by those abnormal outliers and noise. Moreover, some sample points are misplaced on the wrong side by accident. In this case, the traditional SVM may not be able to classify the contaminated data correctly. Because due to over fitting, SVM is particularly sensitive to outliers. Fuzzy support vector machine (FSVM) [15-17] is an ef-fective method to deal with this problem. In FSVM, each training sampling is associated with a fuzzy membership and different memberships represent different contribu-tions to the learning of decision surface. It can reduce the effects of outliers by fuzzy membership functions. Sam-ples with a higher membership value can be thought of as more representative of that class, while those with a lower membership value should be given less importance. Abe and Inoue proposed FSVM for multiclass problem, which was the extension from the binary classification problem and was applied to multi-class text categorization[18].
In this paper, we propose a novel method called fuzzy Least squares support tensor machine (FLSSTM), which is a tensor version of LSSVM, or fuzzy version of LSSTM. LSSTM is based on the tensor space, which directly ac-cepts order-2 tensors as inputs, without vectorization. Obtaining a classifier in the tensor space not only retains the data structure information, but also helps overcome the overfitting problem encountered mostly in vector-based learning. In comparison to solving a QPP at every itera-tion of the STM algorithm, FLSSTM solves a system of linear equations in an iterative fashion, which eventually converges to an optimal solution after a few iterations. Its applications include problems involving inputs of higher dimensions, for e.g., image classification and text catego-rization.
The rest of the paper is organized as follows. Section II provides an overview of LSSVM and Fuzzy membership, the necessary background for proposing FLSSTM in Sec-tion III. SecSec-tion IV demonstrates experimental result.
II. LSSVMAND FUZZY MEMBERSHIP
In this section, we briefly provides a simple introduc-tion about LSSVM and fuzzy membership.
A. LSSVM
Given a set of training samples
T�={(x1,y1),!,(xl,yl)}!(!n!Y�)l.
where n
i
X !! is a training sample and yi! + "
{
1, 1}
isthe class label ofxi.The classification problem is modeled by the following programming[14]:
2 , , 1 T 1 min 2 2 s.t. ( ( ) ) 1 , 1,2, , l T i w b i i i i C w w y w x b i l !
!
!
= + " + = # =$
! (1) where wis a normal vector ,Cis a regularization pa-rameter. !( )x is a nonlinear function which maps xito a high dimensional feature space,By introducing Lagrange multiples and Applying the KKT Conditions, we obtain! through the following linear equations: 1 0 T b O Y e Y H C I"
!
# " $# $ # $ = % + &% & % &' ( ' ( ' ( (2) Where ( , , , )1 2 T l Y = y y ! y , ( ) ( )T ij i j i j H =y y! x ! x ,
I is an identity matrix of appropriate dimension, and e is a vector of ones of appropriate dimension.
B. Fuzzy Membership
In many real-word application community, due to over fitting in SVMs, the training process is particularly sensi-tive to those abnormal outliers in the training dataset which are far away from their own class. A key difficulty with real dataset is that parts of abnormal outliers are noise, which tends to corrupt the samples. In order to decrease the effect of those outliers or noises, we assign each data point in the training dataset with a membership. Samples with a higher membership value can be thought of as more representative of that class, while those with a lower membership value should be given less importance, so that those abnormal data with a low membership con-tribute to total error term decreases.
In fact, this fuzzy membership value determines how important it is to classify a data sample correctly. Each data point is given a fuzzy membership and different memberships have different contributions to the learning algorithm and models. So, one of the important things for machine learning is to choose the appropriate fuzzy mem-berships. The distance between the sample and its class center is used as the basis of measuring the importance of the sample. At present, most of people define a fuzzy membership basing on the distance between each point and its class center[19-20].
Recently, fuzzy SVM have been attracting a lot of in-terest and fuzzy SVM has been shown to be extremely successful, but few papers discuss fuzzy membership in tensor learning space. It is often that some training points are more important than others in the STM classification problem. With the tensor data training points, we also would require that the meaningful training points must be classified correctly and would not care about some train-ing points like noises whether or not they are classified correctly.
When dealing with binary classification problems by STM, all training tensor are presumed to belong entirely to either positive class or negative class, in other words, they are assumed to have equal weight or relevance. How-ever, in fact, each training point no more exactly belongs to one of the two classes. It may 90% belong to positive class and 10% belong to negative class. This may be asso-ciated a fuzzy membership 0<si !1with each training
point Xi.
Each data point is given a fuzzy membership and dif-ferent memberships have difdif-ferent contributions to the learning algorithm. How to choose the appropriate fuzzy memberships is very important. The distance between the sample and its class center is used as the basis of measur-ing the importance of the sample. At present, most of people define a fuzzy membership basing on the distance between each point and its class center.
Given a set of training samples
T�={(X1,y1,s1),!,(Xl,yl,sl)}!(!n1
!n2!Y!s�)l.
where n n1 2 i
X
!class label ofXiand
s
i!
[0,1]
is the fuzzy membership degree of Xibelonging to yi.Denote the mean of positive class as X+and the mean of negative class as X-.Let the radius of positive class
and negative class as follows:
{ } + : 1 = max i i X y r+ = X !X ,(3) {X : 1} = max iy i r X! X ! =! ! , (4)
The fuzzy membershipsi is
(
)
(
)
+ 1 1 1 1 i F i i F i i r if y X X s r if y X X!
!
" + " # " $ =% " " + = " + =" $& (5) Where ! >0is used to avoid the cases
i=
0
. III. FUZZY LEAST SQUARE SUPPORT TENSOR MACHINESAs we all know, the tensor data are also usually con-taminated by noise which caused the disturbance and measurement, and those tensor data which near to the class boundary are most affected by noise. In a spirit simi-lar to LSSTM, the standard STM for pattern classification is not robust to noise, then we develop a Fuzzy model of LSSTM in the tensor space model, which is called Fuzzy Least square support tensor machines (FLSSTM).
A. Reformulate LSSTM
Given a set of training samples for classification:
1 2 1 1 1 {( , , ), ,( , , )} ( n n ) .l l l l X y s X y s s = ! ! " "" # # # $ where n1 n2 i
X
!
!
"
!
is a training sample,yiis the class label ofXiands
i!
[0,1]
is the fuzzy membership degree of Xibelonging to yi. The classification problem is mod-eled by the following programming:2 T 2 F , , , 1 T 1 min , 2 2 s.t. ( ) 1 , 1, , . l i u v b i i i i C uv y u X v b i l !
!
!
= + + = " =#
! (6)whereC>0is a regularization parameter and !iis a slack variable,siis the membership generalized by some outlier-detecting methods. It should be emphasized that the weights tensor
uv
Tis a rank-one matrix. For solving the optimization problem (6), firstly we introduce La-grange multipliers!
i( 1, , )i= ! l and construct the La-grangian function as follows:2 T 2 F 1 T 1 1 ( , , , , ) 2 2 [ ( ) 1 ], l i i i l i i i i i C L u v b uv s y u X v b
! "
!
"
!
= = = + # + # +$
$
(7) Due to 2 T T T T T F1
1
Tr(
)
1
(
)(
),
2
uv
=
2
uv vu
=
2
v v u u
The Lagrangian function (7) can be rewritten as fol-lows: T T 2 1 T 1 1 1 ( , , , , ) ( )( ) 2 2 ( ) (1 ), l i i i l l i i i i i i i C L u v b v v u u s y u X v b
! "
!
"
"
!
= = = = + # + + #$
$
$
(8)The KKT necessary conditions for the optimality are:
1 T , l i i i i y X v u v v
!
= ="
(9) 1 T , l T i i i i y u X v u u!
= ="
(10) 1 0, l i i i y!
= ="
(11)/
, 1, , .
i iCs i
il
!
=
"
=
!
(12)From equations (9) and (10), it is obviously that uand
vrely on each other, and cannot be solved with traditional methods. Like STM, we use alternating iterative algo-rithm[3,4].
We first fix u . Let
!
1 = u 2and T i ix X u= ,Let Dbe a
diagonal matrix where
D
ii=
y
i.The optimization problem (6) can then be reduced to the following QPP:1 , , 1 1 min 2 2 s.t. ( ) T T v b v v C S D Xv eb e !
"
! !
!
+ + + = (13) Where(
1T, , ,2T T)
T mX= x x ! x ,and e is a vector of ones of appropriate dimension. It can be seen that (13) is simi-lar in structure to LSSVM. For solving(13), we consider its Lagrangian as : T 2 1 1 ( ) 1 1 2 2 2 ( ) T T T T L v v b C S D Xv eb e
!
" "
#
# # "
= + + $ + + $ (14) Applying the KKT necessary and sufficient optimiza-tion condioptimiza-tions by equating L L L, ,v b
!
" " "
" " " to be equal to 0,
we obtain the following: 1
v X D
T!
=
"
(15) 0 T e D!= (16) CS! "
= (17) Substituting the values of v b, and !form (15) (16) and (17) into the equality constraints of (13) yields the follow-ing system of linear equations for obtainfollow-ing !:1 1 0 T T O Y b DXX D S e Y C
!
"
# $ # % $ % $ % & ' = & ' & ' & + ' ( ) ( ) & ' ( ) (18)Where S!1is a diagonal matrix where 1 1 ii i
S
!s
!=
.Then , ,v b! can be computed using (15)(16) and (17) respec-tively.
We observe that solving (13) requires the inversion of an l l! matrix at (18), which is non-singular due to the
diagonal perturbation introduced by the termS!1/C . Optionally, when l! n2 , we can instead use the Sherman Morrison Woodbury identity to invert a smaller n n2! 2 matrix for obtaining the value of!, this contributes to the significant computational time.
Once vis obtained, Let
!
1= v2and x!i=Xiv, On the similar lines, ucan be computed by the following QPP:2 2 , , 1 1 min 2 2 T T u b!
"
u u + C S! !
s.t. D(Xv! +eb)+!=e (19) Where X! = x! 1 T,x! 2 T,!,x! m T(
)
T,Solving (19) in a similar fashion as (13). Thus,uand vcan be obtained by iterative-ly solving the optimization problems (13) and (19). B. The Algorithm of FLSSTMThe algorithmic procedure is formally stated below: Inputs: the data set
1 2 1 1 1 {( , , ), ,( , , )} ( n n ) .l l l l X y s X y s s = ! ! " "" # # # $
Outputs: the hyperplanef X( )= uv XT, + =b 0.
Algorithmic Procedure:
Step1. Initialization: Let
u
(1, ,1)
T=
!
,!
1= u2 , and T i ix X u
=
,(
1, , ,2)
T T T T l X= x x ! x ,Step2. Computingv: vcan be computed by solving the following problem: 1 , , 1 1 min 2 2 T T v b!
"
v v+ C S! !
s.t. D Xv eb( + )+ =!
eStep3. Computingu : By step 2, let 2
2 v
!
= and ! xi=Xiv , X!= x!1 T,x! 2 T,!,x! l T(
)
T ,u can be computed by solving the following problem:2 , , 1 1 min 2 2 T T u b!
"
u u+ C S! !
s.t. D(Xv! +eb)+!=eStep4. Iteratively computing u andv: By step 2 and step 3, we can iteratively compute u and v until they tend to converge.
IV. EXPERIMENTAL RESULTS
In this section, in order to verify the effectiveness of the proposed FLSSTM, We will compare the results of FLSSTM with the vector-based classification method FLSSVM and tensor-based classification method LSSTM. All the algorithms have been implemented in MATLAB7.8 (R2009a) on Ubuntu running on a PC with system configuration Intel Core5 Duo (2.60GHz) with 2 GB of RAM. The data sets to be used are taken from the UCI Repository.
A. Experiments Preparation
For each size of the training set, ten independent runs are performed and their classification accuracies on the sets are averaged. We randomly select our training images from the entire set and repeat the experiment 10 times. The parameterCis obtained by cross validation, and the range of the regularization constant C is from 2!6 to
6
2 with each step by multiplying2. All experiments are primarily focused on the second order tensors, namely images in the form of matrix. We initialize both uand
vare vectors of ones of appropriate dimensions. At the same time, the kernel function used in LSSTM and FLSSTM are both the linear kernel function, i.e.,
T ( , )i i
K x x =x xwith respect to !( )x =x. Accuracy and the Running time are used to estimate the performance of each algorithm. The Accuracy is defined as follows:
FN TN FP TP TN TP = Accuracy + + + +
TP, TN, FP, FN represent the number of positive data points which are correctly classified, the number of nega-tive data points which are correctly classified, the number of positive data points which are falsely classified, the number of negative data points which are falsely classified, respectively.
In our experiments, we choose two databases which are represented in Table I.
TABLE I.
THE DESCRIPTION OF DATA SETS
Data sets Data size Class Atrribute ORL face data 400 40 32
!!
32 Yale face data 165 15 100!!
100 B. Experiments on the ORL databaseThe ORL database [21] of the face images has been provided by AT&T laboratories from Cambridge. It con-tains 400 images of 40 individuals, with varying lighting, facial expression (open or closed eyes, smiling or not smiling) and facial details (beard or gender, glasses or no glasses). All images were normalized to a resolution of 32!32pixels with (1024) gray levels. Since we are inter-ested in testing the effectiveness of tensor-based algo-rithms when the dimension of the data is large and the available training set is small, we do not perform cropping or resizing of the images which reduces the number of features in the data and histogram equilibrium was applied in the prepare processing step. The effect of histogram equilibrium on a particular example image is displayed in Fig. 3.
Original Image Normalized Image
Figure 3. The effect of applying histogram normalization step on a sample image
Since we consider the binary problem of learning a classifier, we randomly chose two classes images to dis-tinguish. For each binary classification experiment, we consider a subset of ten images of both the subjects for
training (training ratio is 10%, 20%, 30%, 40%, 50%), while the rest is considered for testing. Table II shows the mean recognition rates and standard deviations of all algo-rithms in our experiments with different ratio of training sets and test sets on ORL database. From the Table II, it can be seen that when training ratio is small, FLSSTM outperforms FLSSVM and LSSTM, and the advantage of FLSSTM gradually reduced when training set becomes larger. When training ratio is 10%, the maximum differ-ence of the accuracy between FLSSTM and FLSSVM is 7.78%. However, the maximum difference of the accuracy between FLSSTM and LSSTM is only 1.67%. The supe-riority of tensor-based algorithms gradually reduced when training sets become larger. From table II, it can be seen obviously that the maximum difference of the accuracy between FLSSTM and FLSSVM is 1.56% when training ratio is 50%.
C. Experiments on the Yale database
The Yale database [22] of the face images has been provided by Yale University. It contains 165 images about 15 individuals, where each person has 11 images. These images with varying lighting condition (left-light, center-light) and facial expression (happy, sad, normal, sleepy, surprised, wink). All images were normalized to a resolu-tion of 100!100 pixels with (10000) gray levels. One object from Yale database is displayed in Fig. 4.
Figure 4. Eleven facial samples from a subject within the Yale data-base
We consider eleven particular examples of binary clas-sification in Yale database. It consists of three subject pairs with similar facial features (smile, beard, glasses), and three subject pairs with distinct facial features. A list of the eleven selected subject pairs is given in Table III. For each binary classification experiment, we consider a subset of eleven images of both the subjects for training (training ratio is 10%, 20%, 30%), while the rest is con-sidered for testing.
The efficacy of FLSSTM has been compared with FLSSVM and LSSTM on Yale image classification data-base. Table IV and table V show the mean recognition rates and standard deviations of all algorithms in our ex-periments with different size of training sets and test sets on Yale database. From Table IV we can see that the per-centage accuracy comparisons for the binary classification. It is evident from the Table IV that FLSSTM roughly outperforms LSSTM in most of the cases. From table IV, it can be seen obviously that the maximum difference of the accuracy between FLSSTM and LSSTM is 6.5% while the minimum difference of the accuracy is only 3.23% for the different subject pairs when the training ratio is 10%. Compared with FLSSVM, the advantage of FLSSTM is also evident, the maximum difference of the accuracy between FLSSTM and FLSSVM is 8.11% while the minimum difference of the accuracy is only 0.83% when the training ratio is 10%. The superiority of FLSSTM algorithms gradually reduced when the training
ratio is 30%. In fact, FLSSTM is outperforming LSSTM or FLSSVM especially in cases when the two subjects appear quite dissimilar and the training size is small.
From table IV and table V, it can be seen obviously that the introduction of fuzzy membership improves the classi-fication ability, the results have been provided on the small training size but not the large training size. The main reason lies in less the information for classifying planes when the training size is small, the fuzzy member-ship can increase the test accuracy when building a classi-fier. The superiority of fuzzy membership gradually re-duced when training sets become larger.
TABLE II.
THE COMPARISON BETWEEN LSSTM,FLSSVM AND FLSSTM Training ratio Recognition rates and standard deviations with
differ-ent methods LSSTM FLSSVM FLSSTM 10% 77.22±1.95 71.11±13.5 78.89±2.34 20% 79.44±3.60 72.29±15.3 83.75±3.23 30% 87.86±3.81 88.57±10.2 91.43±4.52 40% 94.72±3.73 92.50±6.15 94.17±6.86 50% 95.56±3.95 94.00±5.16 94.00±5.98 TABLE III.
SUBJECT PAIRS CONSIDERED FOR BINARY CLASSIFICATION Subject pairs with
Similar facial features Dissimilar facial features (2,7) (1,4)
(6,14) (5,11) (8,13) (12,15)
TABLE IV.
MEAN RECOGNITION RATES(%) AND STANDARD DEVIATIONS ON YALE DATABASE
Training
ratio Methods Recognition rates with Similar facial fea-tures
(2,7) (6,14) (8,13) 10% LSSTM FLSSVM FLSSTM 83.89±1.87 75.33±2.37 78.06±1.61 75.33±16.5 73.50±13.3 79.50±20.6 85.50±1.5877.39±2.73 80.83±1.79 20% LSSTM FLSSVMF LSSTM 92.16±3.89 82.72±6.54 88.89±4.59 88.95±11.8 80.86±8.61 91.11±14.2 95.00±1.76 81.67±3.75 91.17±2.87 30% LSSTM FLSSVMF LSSTM 95.63±7.25 85.00±5.65 93.82±5.23 95.14±6.34 82.99±7.07 96.70±3.23 94.37±1.98 85.62±4.22 95.00±2.64 TABLE V.
MEAN RECOGNITION RATES(%) AND STANDARD DEVIATIONS ON YALE DATABASE
Training
ratio Methods Recognition rates with Dissimilar facial features
(1,4) (5,11) (12,15) 10% LSSTM FLSSVM FLSSTM 83.78±12.6 83.44±1.32 68.94±2.02 82.94±14.9 89.11±18.6 64.06±13.6 87.39±1.8889.94±1.11 72.17±3.35 20% LSSTM FLSSVMF LSSTM 89.94±3.48 96.11±3.75 75.19±7.40 90.25±4.46 99.44±1.76 74.75±10.5 90.31±2.80 96.91±0.76 75.31±4.97 30% LSSTM FLSSVMF LSSTM 91.18±4.48 98.96±1.52 85.90±6.65 90.90±3.66 99.93±0.22 79.17±7.18 91.32±3.60 97.50±0.94 81.87±6.22
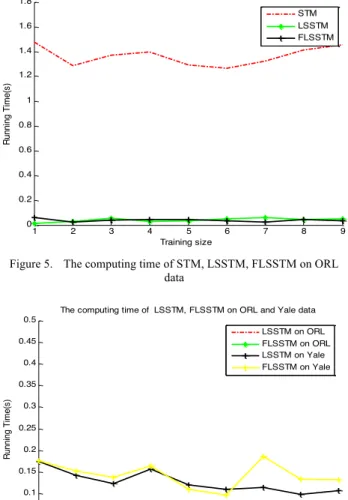
We also do the experiments with different database on the computing time. The result of running time compari-sons between STM, LSSTM and FLSSTM, for learning a single binary classifier, are showed in Fig.5 and Fig.6. From Fig.5 and Fig. 6 it can be seen that the running time of FLSSTM is significantly less than STM, and is almost the same as LSSTM on both two databases. Results demonstrate that FLSSTM provides a significant reduc-tion in the computareduc-tional time, as well as comparable classification accuracy. The main reason lies in FLSSTM and LSSTM require solving a series of linear equations rather than a quadratic programming problem as compared to STM algorithm. 1 2 3 4 5 6 7 8 9 0 0.2 0.4 0.6 0.8 1 1.2 1.4 1.6 1.8 Training size Runni ng T im e( s)
The computing time of STM, LSSTM, FLSSTM on ORL data STM LSSTM FLSSTM
Figure 5. The computing time of STM, LSSTM, FLSSTM on ORL data 1 2 3 4 5 6 7 8 9 0 0.05 0.1 0.15 0.2 0.25 0.3 0.35 0.4 0.45 0.5 Training size Runni ng T im e( s)
The computing time of LSSTM, FLSSTM on ORL and Yale data LSSTM on ORL FLSSTM on ORL LSSTM on Yale FLSSTM on Yale
Figure 6. The computing time of LSSTM, FLSSTM on different data
V. CONCLUSIONS AND FUTURE WORK
In this paper, we firstly consider the fuzzy membership in the training databases in tensor space, and propose an improved tensor-based methodFLSSTM algorithm to learn better from databases in the presence of outliers or noises. For solving the small-sample-size (S3) problems, the tensor representation always performs better than the vector representation. This is due to the fact that the num-ber of parameters estimated by STM is much less than that of estimated by standard SVM. The similar results hold true for the FLSSTM algorithm. The above several numer-ical experiments show that the tensor-based methods have
more advantages than vector-based methods for small-sample-size (S3) problems.
The formulation of FLSSTM requires to solve a system of linear equations at every step of an iterative algorithm, using the alternating projection method similar to STM, in contrast to solving a QPP. This makes FLSSTM a fast tensor-based linear classifier. How to choose a proper fuzzy membership function is quite important to solve classification problem with FPSVM, in future, we will continue to research the method of selecting better fuzzy membership function. Then we will research how to apply our proposed algorithm to large-scale classification prob-lems, and how to use the matricization to improve the classification accuracy is the important issue.
ACKNOWLEDGMENT
The authors gratefully acknowledge the helpful com-ments and suggestions of the reviewers, which have im-proved the presentation.
REFERENCES
[1] T. Lin, P. Wu, F.M.Gao, Y.Yu, and L.H.Wang, “STUDY ON SVM TEMPERATURE COMPENSATION OF LIQUID AMMONIA VOLUMETRIC FLOWMETER BASED ON BARIABLE WEIGHT PSO,” International Journal of Heat and Technology. Vol.33, No.2, pp.51-156, 2015. http://dx.doi.org/ 10.18280/ijht.330224
[2] R.Jin,L.S.Hong, C.Wang,L.F.Wu, and W.C.Si, “A Hierarchical clustering community algorithm which missed the signal in the process of transmission,” Review Of Computer Engineering Stud-ies, Vol.2, No.3, pp.27-34, 2015. http://dx.doi.org/10.18280/ rces.020306
[3] D. Cai, X. F. He, J. W. Han, “Learning with tensor representa-tion,” Department of Computer Science Technical Report No.2716, University of Illinois at Urbana-Champaign, April 2006. [4] D. Cai, X. F. He, J. R. Wen, J. Han, W. Y. Ma, “Support tensor
machines for text categorization,” Department of Computer Sci-ence Technical Report No.2714, University of Illinois at Urbana-Champaign , April 2006.
[5] Tao D, Li X, Hu W, Maybank SJ, Wu X (2005) Supervised tensor learning. In: ICDM 2005: proceedings of the 5th IEEE interna-tional conference on data mining, pp 450–457
[6] Tao D, Li X, Hu W, Maybank SJ, Wu X (2007) Supervised tensor learning. Knowl Inf Syst 13(1):1–42 http://dx.doi.org/10.1007/ s10115-006-0050-6
[7] I. Kotsia, I. Patras, “Relative margin support tensor machines for gait and action recognition,” in International Conference on Image and Video Retrieval, Xi’an, China, 2010. http://dx.doi.org/10.11 45/1816041.1816107
[8] X. S. Zhang, X. B. Gao, Y. Wang, “Twin support tensor machines for MCs detection,” Journal of Electronics (China), 26 (2009) 318-325. http://dx.doi.org/10.1007/s11767-007-0211-0
[9] I. Kotsia, W. W. Guo, I. Patras, “Higher rank support tensor machines for visual recognition,” Patter Recognition. 45 (2012) 4192-4203. http://dx.doi.org/10.1016/j.patcog.2012.04.033
[10] H. Lu, K. N. Plataniotis, A. N. Venetsanopoulos, Mpca: multiline-ar principal component analysis of tensor objects, IEEE Trans-ations on Neural Networks, 19 (2008) 18-39.
http://dx.doi.org/10.1109/TNN.2007.901277
[11] S. Yan, D. Xu, Q. Yang, L. Zhang, X. Tang, H. J. Zhang,” Multi-linear discriminant analysis for face recognition,” IEEE Trans-ations on Image Processing, 16 (2007) 212-220.
http://dx.doi.org/10.1109/TIP.2006.884929
[12] T. K. Kim, R. Cipolla, “Canonical correlation analysis of video volume tensors for action categorization and detection,” IEEE Transations on Pattern Analysis and Machine Intelligence, 31 (2009) 1415–1428. http://dx.doi.org/10.1109/TPAMI.2008.167
[13] S. Zafeiriou, “Discriminant nonnegative tensor factorization algorithms,” IEEE Transations on Neural Networks, 20 (2009) 217-235. http://dx.doi.org/10.1109/TNN.2008.2005293
[14] [14]J. A .K. Suykens, J. Vandewalle, “Least squares support vector machine classifiers,” Neural Process Lett 9:293-300, 1999.
http://dx.doi.org/10.1023/A:1018628609742
[15] Chunfu Lin and Shengde Wang, “Fuzzy support vector machines”, IEEE Trans. on Neural Networks, vol. 13, no. 2, pp. 464-471,2002.
http://dx.doi.org/10.1109/72.991432
[16] T. Inoue and S. Abe, “Fuzzy support vector machines for pattern classification”, Proceedings of IJCNN’01, Washington DC, vol. 2, pp. 1449-1454, July 2001. http://dx.doi.org/10.1109/ijcnn. 2001.939575
[17] H-P Huang and Y-H Liu, “Fuzzy support vector machine for pattern recognition and data mining”, International Journal of Fuzzy Systems, vol. 4, no. 3, pp. 826-835, 2002.
[18] S. Abe and T. Inoue, Fuzzy support vector machines for multiclass problems, in Proceedings of the Tenth European Symposium on Artificial Neural Networks, pp. 113-118. Bruges, Belgium, April 2002.
[19] X.H.fan and Z.G.He, “A Fuzzy support vector machine for Imbal-anced Data classification,” IEEE ICPOIP,2010 International Con-ference on Optoelectronics and Image Processing. (2010)11-14. [20] Wenjuan An, Mangui Liang, “Fuzzy support vector machine
based on within-class scatter for classification problems with out-liers or noises”, Neurocomputing110 (2013) 101-110.
http://dx.doi.org/10.1016/j.neucom.2012.11.023
[21] The Olivetti & Oracle Research Laboratory Face Database of Faces, Available: http://www.carn-orl.co.uk/facedatabase.html. [22] Yale University Face Database(Online), Available:
http://cvc.yale.edu/projects/yalefaces/yalefaces.html AUTHORS
Ruiting Zhang was born in HeBei Province, China, in 1981. He studies in College of Science, China Agricultur-al University, 100083, Beijing, China, and he worked in Canvard college, Beijing Technology and Business Uni-versity, His research interests mainly include Machine Learning, Support vector machine ([email protected]).
Zhijian Zhou is a professor in College of Science, China Agricultural University, Her research interests mainly include intelligent control, Support vector ma-chine.([email protected]).
This work is supported by the China Agricultural Research System (CARS-30) and Beijing Higher Education Young Elite Teacher Project (NO. YETP1949). Submitted 07 November 2015. Published as resub-mitted 05 december 2015.