Perceptions of Service Quality in Jordanian Hotels
Suleiman A. Al Khattab (Corresponding author)College of Business and Economics, Department of Business Administration Al-Hussein Bin Talal University, Ma'an, Jordan
Tel: 962-776-730-981 E-mail: suliemanus@yahoo.com Jehad S. Aldehayyat
College of Business and Economics, Department of Business Administration Al-Hussein Bin Talal University
PO Box 149, Ma'an, Jordan
Tel: 962-3-213-5516 E-mail: Jehad122@yahoo.co.uk
Received: January 12, 2011 Accepted: February 14, 2011 doi:10.5539/ijbm.v6n7p226 Abstract
The importance of service quality for business performance has been recognized in the literature through the direct effect on customer satisfaction and the indirect effect on customer loyalty. The main objective of the study was to measure hotels' service quality performance from the customer perspective. To do so, a performance-only measurement scale (SERVPERF) was administered to customers stayed in three, four and five star hotels in Aqaba and Petra. Although the importance of service quality and service quality measurement has been recognized, there has been limited research that has addressed the structure and antecedents of the concept for the hotel industry. The clarification of the dimensions is important for managers in the hotel industry as it identifies the bundles of service attributes consumers find important. The results of the study demonstrate that SERVPERF is a reliable and valid tool to measure service quality in the hotel industry. The instrument consists of five dimensions, namely "tangibles", "responsiveness", "empathy", "assurance" and "reliability". Hotel customers are expecting more improved services from the hotels in all service quality dimensions. However, hotel customers have the lowest perception scores on empathy and tangibles. In the light of the results, possible managerial implications are discussed and future research subjects are recommended.
Keywords: Service quality, SERVPERF, Jordan, Hotels 1. Introduction
During the past decades, the tourism industry has become one of the most important players of economies worldwide (Shahin and Dabestani, 2010), with the Middle East among the fastest growing regions. Tourism is a key driver of Jordan’s economy; currently it is the single largest employer. Jordan is one of the few countries in the Middle East to witness annual growth in the tourism industry. This important industry has many infrastructures and service institutions in its category among which the most important infrastructure is the hotel industry (Shahin and Dabestani, 2010). Employment in Jordanian tourism industry, including indirect employment, was estimated at around 130,000 (11% of the work force). The tourism industry itself employs 34,405 people, of which 77.5% were in the hotels and restaurant industry (Fischer et al., 2009). In today’s competitive environment, individual hoteliers must find ways to make their services stand out among their competitors. To achieve this, hoteliers must understand their customers’ needs – and then set out to meet these needs (Nadiri and Hussain, 2005). The attention to service quality from the customer’s perspective is considered as the most important developments in the tourism industry (Fache´, 2000; Nadiri and Hussain, 2005). Kandampully (2000) and Yilmaz, (2009) argued that service quality is crucial to the success of any service organization. Hotels with good service quality will improve their market share and profitability (Nadiri and Hussain, 2005; Oh and Parks, 1997). However, most of studies regarding quality service in tourism sector were carried out in the development country context and very few of them were undertaken in emerging market context. Therefore, this research aims to fill the gap in the literature and provide empirical evidence, about service quality dimensions in Jordanian hotels and to examine their relationship with customer satisfaction. 2. Literature review
Service quality is crucial to the success of any service organization. Since customers participate in delivery and consumption of services, they interact closely with various aspects of organizations. Hotels with good service quality will therefore improve their market share and profitability (Oh and Parks, 1997). In a highly competitive
hotel industry, individual hoteliers must find ways to make their products and services stand out among the others. To achieve this, hoteliers must understand their customers’ needs – and then set out to meet (or exceed) these needs. As Fache´ (2000) has observed, one of the most important developments in the tourism industry is the growing attention to service quality from the customer’s perspective. Among all customer demands, quality service has been increasingly recognized as a critical factor in the success of any business (Gronoos, 1990; Parasuraman et al., 1988).The most widely accepted measurement scale for service quality is SERVQUAL (Parasuraman et al., 1985; 1988), which consists of five essential service quality dimensions (Table 1).
Table 1 – about here
This framework measures service quality by considering gaps between expectation and performance with sub-factors including tangibles, reliability, assurance, responsiveness, and empathy. Cronin and Taylor (1992) introduced SERVPERF, arguing that customer preferences are more relevant to a long-term service quality than impending differences in expectations and performance. Cronin and Taylor (1992) suggest that the performance-based scale SERVPERF is more efficient than the SERVQUAL scale, since it reduces the number of items that must be measured from 44 to 22. Perceived service quality is said to be a reflection of the firm’s performance. On using the firm’s service, customers are said to form an attitude towards service quality performance. This satisfaction level with regard to the products / services indicates how the firm performs. The SERVPERF model claims that to find the performance of a firm (i.e. its service quality) all that is required is to collect data by directly asking the customer through a simple survey and a questionnaire.
As the services possess the element of intangibility it is very difficult to have a standardized and scientific tool for measurement (Carman, 1990, Crosby, 1979; Parasuraman et al., 1985, 1988). However, SERVQUAL, a 22-item scale was developed to measure service quality along five dimensions: reliability, responsiveness, assurance, empathy, and tangibles. The instrument has been revised and used extensively in a variety of service settings such as banking, credit card services, repair and maintenance and long distance telephone services in developed nations. However, it has been subjected to several criticisms on theoretical and operational aspects, despite its contribution to academia and business world. While failing to confirm the five-dimensional factor structure various studies have considered the importance of context in influencing it and reported problems on the use of expectations as the standard of comparison (Carman, 1990; Cronin and Taylor, 1992). Cronin and Taylor (1992) suggest that the performance-based scale SERVPERF is more efficient than the SERVQUAL scale, since it reduces the number of items that must be measured from 44 to 22. Perceived service quality is said to be a reflection of the firm’s performance. On using the firm’s service, customers are said to form an attitude towards service quality performance. This satisfaction level with regard to the products / services indicates how the firm performs. The SERVPERF model claims that to find the performance of a firm (i.e. its service quality) all that is required is to collect data by directly asking the customer through a simple survey and a questionnaire. McDougall and Levesque (1994) have clamed that knowing the relative importance of each dimension of service quality can help service providers to priorities their efforts and resources and deploy them more effectively to improve each dimension of service quality. Furthermore, this knowledge allows managers to concentrate on those dimensions that offer the greatest opportunity to enhance customer satisfaction and their loyalty.
To sum up, measuring service quality seems to pose difficulties for service providers because of the unique features of service (Bateson, 1995). Unlike SERVQUAL, SERVPERF does not differentiate service quality from customer satisfaction, SERVQUAL measures performance based on the gap between expectation and perception while SERVPERF measures actual performance based on customer satisfaction. Cronin and Taylor (1992) have examined a performance-based measure of service quality, called SERVPERF in four industries (banking, pest control, dry cleaning and fast food). SERVPERF is composed of the 22 perception items in the SERVQUAL scale, and therefore excludes any consideration of expectations. They found that this measure explained more of the variance in an overall measure of service quality than did SERVQUAL. This model is based on the hypothesis that service quality is an antecedent of customer satisfaction (i.e. satisfaction is an outcome of service quality); whilst customer satisfaction has a significant impact on purchase intentions. Managers must discover whether customers are buying from firms that have a ‘high level of service quality’ or those with which they are most satisfied. SERVQUAL scale has been widely used to measure service quality in general service sector or particularly in the hotel industry. However, despite its value and popularity, it has received important criticisms since it was developed. A considerable number of criticisms about SERVQUAL focused on the use of expectations as a comparison standard in the measurement of service quality. Many researchers (e.g. Cronin and Taylor 1992, 1994; Babakus and Boiler 1992; Brady, Cronin and Brand 2002) emphasized that expectations doesn't provide extra information in measuring service quality. Because of the difficulties in establishing contact with the study sample before their arrival to the hotel, administration of questionnaire did not follow a beforehand- after approach, i.e., the study has measured expectations and perceptions of respondents at the same time. According to Carman (1990), expectation and perception measures cannot both be administered at the same time.
Teas (1994) drew attention to some validity problems arise when expectations are used as a comparison standard. He indicated that expectations are dynamic in nature and may change according to customer's experiences and
consumption situations. Jain and Gupta (2004) compared SERVQUAL and SERVPERF scales in fast food context. They found that the SERVPERF scale was more convergent and discriminate valid scale than SERVQUAL in the measurement of service quality in fast food restaurants. Recently; Nadiri and Hussain (2005) used SERVPERF scale to measure service quality provided by the hotels. Results of the study support that SERVPERF is a better predictor of service quality, and performance-only measurement of service quality is sufficient. Gaur and Agrawal (2006) pointed out that the SERVQUAL fails to serve as imivocally reliable and valid measure of retail service quality. Brochado and Marques (2007) compared the performance of five alternative measures of service quality in the high education sector, and they concluded that SERVPERF scale had one of the best results in terms of criterion validity, convergent validity, and explained variance.
Service quality is a topic of crucial importance for the hotel industry. Service quality is a difficult concept and it is almost impossible to have one single measure to assess its level. Much literature suggests that the customer is the only real arbiter of service quality. However, this approach can be criticized as it fails to take into account the differing perceptions of customers. For hotel managers it is necessary to employ a multi-faceted approach that incorporates quantifiable measures, customer assessments that should also include employee perceptions of customer satisfaction. There is no doubt that customer satisfaction is the major issue for all firms. A number of studies on customer satisfaction in the hospitality industry have focused on identifying service attributes; that is, a customer’s needs and wants. From a marketing perspective, customer satisfaction is achieved when the customer’s needs and wants are fulfilled (Lam and Zhang, 1999). Lam and Zhang (1999) conducted a study to assess customers’ expectations and perceptions of service quality, and identified a gap between the two. They also explored the impact of service quality factors on overall customer satisfaction. Their findings revealed that ‘‘reliability’’ and ‘‘responsiveness and assurance’’ are the most significant factors in predicting customer satisfaction.
The concept of customer satisfaction refers to an evaluation or judgment upon both the good performance of a service or product and the fitness of a product or service for a given purpose (Tse & Wilton 1988). According to the American Marketing Association (AMA), customer satisfaction is the degree to which a customer’s expectations are fulfilled or surpassed by a product. Oliver (1980) argued that customer satisfaction implies a comprehensive mental state derived from a combination of emotions caused by a customer’s actual experience and disconfirmation of expectation and emotions prior to the buying experience. Numerous researches have been vigorously conducted on customer satisfaction, and developed the expectation-disconfirmation paradigm to explain the variables deciding customer satisfaction. According to the paradigm, a disconfirmation between prior expectation and product performance affects customer satisfaction/dissatisfaction, and customer satisfaction is determined based upon a customer’s internal determinants and perceived performance (Oliver, 1980). It is also defined as the consumer’s response to an evaluation of the perceived discrepancy between prior expectations and the actual performance of the product perceived after its consumption (Day, 1980). In terms of customer loyalty, Oliver (1999) defined it as the in depth involvement of a customer, which triggers a continuous purchase of a preferred product or service. It has been suggested that a customer that is loyal to a particular product or service would not alter their own buying behaviour despite the marketing attempts of substitute products or services (Dick and Basu, 1994). Referral or word-of-mouth were considered significant means of marketing communication, since the information transferred via this means has been recognised as credible and accurate, and exerts a critical impact on a firm’s reputation, affecting other customers’ buying behaviour (Day, 1980). 3. Methodology
3.1 Research population and sample
The population of the study consisted of customers visiting three star, four-star and five-star hotels located in two cities in Jordan—Aqaba and Petra. Petra is considered as one of the new Seven Wonders of the World. Petra and Aqaba are the most important archaeological sites in Jordan. Hotels which are located in this region operate in a highly competitive and dynamic environment (Aldehayyat, 2011). The respondents were selected on the basis of a non-probability convenience sampling technique. The respondents were requested to fill out the questionnaires after their check-out transactions.
The questionnaire was in two main parts. Part one was designed to examine the quality service perception through five dimensions (tangible, reliability, responsiveness, assurance and empathy). In addition, part one includes one dimension for measuring customer satisfaction. Part two was designed to get the information regarding the respondents. A total of 350 questionnaires were distributed and collected personally during April to May 2010. Of these, 280 questionnaires were found to be valid for analysis. The response rate was, therefore, 80% from the original sample of 350.
3.2 Measures
The questionnaire consists of twenty two items related to quality serves (adopted from Parasuraman et al., 1988) and four items related to customer satisfaction (Table 4). A five-point Likert scale was used for data collection – ranging from “strongly disagree” to “strongly agree”. SPSS 16.0 for windows was employed in order to gain the
results required for the scale measurement. Descriptive analysis such as frequencies, means and standard deviation are calculated. Reliability of the scale is tested and coloration analysis was used.
The Gronbach alpha of SERVPREF dimensions and the overall satisfaction are all larger than 0.70 so it indicates that there is an internal consistency in the dimensions and overall SATSFACION. It ranged from 0.710 to 0.914. Therefore, the reliability of this survey of this study is good. Table 2 shows the Gronbach alpha of each dimension.
Table 2 – about here 3.3 Profile of Respondents
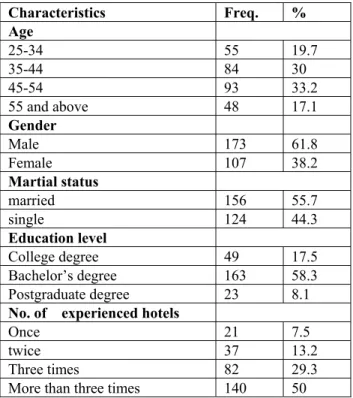
The result in Table 3 shows that almost 61.8% of the respondents were males against 38.2% for females. Moreover, the percentage of married respondents was 55.7%. With regard to the category of educational level, it has been found that most of customers hold BA degree (58.3%).it can be seen from Table 1 that the he age category 25-34 represented 19.7%, the age category 35-44 represented 30%, and the age category 45-54 represented 33.2%. While the age category 55 and above represented 17.1%. 79.3% of respondents have experienced the hotel more than two times.
Table 3 – about here 4. Data analysis and discussion
The result in Table 1 shows that the customers' perceptions regarding the statements relating to the tangible dimension range from (mean 2.30 to mean 3.12); regarding the statements relating to the reliability dimension range from (mean 2.70 to mean 3.23); regarding the statements relating to the responsiveness dimension range from (mean 3.86 to mean 3.92; regarding the statements relating to the assurance dimension range from (mean 2.67 to mean 4.11) and; regarding the statements relating to the empathy dimension range from (mean 2.06 to mean 3.01)
Table 4 – about here
The results in that customers' perceptions regarding the statements relating to the empathy dimension appear to be less positive than their perceptions of the other previous dimensions. Interestingly, this result also confirmed exactly the customers’ perception towards this dimension. Hence, hotels must understand that not all customers are the same, and indicates the potential importance of market segmentation - grouping customers sharing similar requirements, expectations and demographic profiles. Here, the role of service quality can be very important and afford hotels the ability to build strong relationships with targeted customers (Zeithaml and Bitner, 2000).
Pearson correlation was conducted to assess the relationships between the quality service dimensions and customer satisfaction. The results show a positive statistical significance between the three dimensions of service quality (Reliability, Responsiveness and Assurance) and the customer satisfaction. Wile no relationship was found with empathy and tangible. Akbaba (2006) conducted in the hotel industry confirmed the five-dimensional structure of service quality, but some of the dimensions were also different. All these findings support the claims that the numbers of service quality dimensions vary depending on the particular service being offered, and different measures should be developed for different service context (Carman 1990; Finn and Lamb 1991; Babakus and Boiler 1992; Bouman and Van der Wiele 1992).
Mostly, the same or adapted to original SERVQUAL formats (Parasuraman et al. 1988) have been used to measure service quality in the hotels. However, there are not many published research about the performance-only measurement (SERVPERF) of service quality in the hotel industry. This study supports the argument of some researchers (cited in the literature review above) that a performance-only measurement (SERVPERF) is a good predictor of service quality, and sufficient.
The findings indicate that while service quality is an important driver of customer satisfaction and behavioral intention, the managers should give more importance not only on their customers’ satisfaction but their delight (Vijayadurai, 2008).This study also provides hotel service quality researchers with useful guidelines for future research that would result in more rigorous theoretical and methodological processes. The terms “satisfaction” and “quality” have been a central hospitality management philosophy, and their importance continues with the promise of a renewed, foreseeable prosperity for the hotels of the future. Nevertheless, hospitality research has not, on the whole, developed any substantive theories and innovations. Partial responsibility for this necessity lies in the method driven research traditions of the past. Therefore, using SERVPERF scale, one of the apparent implications of this study turns out to be that managers should improve their service level and should redesign the structure of their available physical facilities. Also, the use of SERVPERF scale to measure the service quality provides diagnostic capability about the level of service performance from the customers’ perspective. Thus, the use of SERVPERF instrument provides useful information to managers for developing quality improvement strategies. This study also supports the argument in the literature that performance-only (SERVPERF) is the better predictor of service quality (Cronin and Taylor, 1992; Babakus and Boller, 1992; Boulding et al., 1993). In general, this study also recommends that SERVPERF measurement is sufficient.
5. Conclusions
Hotel managers should pay more attention to the tangible aspects of the service quality because of; customers have the lowest perception scores on tangible dimension. With regard to improvement of the tangibles dimension, hotel managers should focus on specific items (improvement areas) related to this dimension. These areas include equipment and physical facilities, appearance of employees, materials associated with the service, and operating hours in the hotels. On the other hand, hotel manager should not forget that empathy was the most important dimension in predicting hotel customers' overall service quality evaluations. Another managerial implication includes the need for the hotel to develop human resource management strategies to train employees to become more skilled in their job, have excellent communication skills, being courteous, friendly and competent to meet customers’ need. This aspect of the study is compatible with the Nadiri and Hussain (2005) investigation.
Also, since performance of the hotels' service quality may be different by the season, the study could be conducted in peak and low seasons, comparatively. Many people stay at the hotel because of business or conferences. It would seem an obvious strategy to continuously provide attractive packages to conference coordinators and business meeting groups. Pricing is currently the hotels’ competitive advantage. The way prices are presented must take into account consumer psychology, balancing the consumers’ desire for bargains with their understanding of the overall cost of the total experience they are purchasing (Morgan, 1996).
Although the findings of this research have some generality; they do have limitation. The choice of population was limited to a single industry, namely hospitality, which has a tendency to limit the generalisability of the findings in the context of other industries. Therefore, future research could be conducted on multiple industries. Since this study was conducted solely in Jordan, future research may also look at whether the findings of this research differ by countries.
References
Aldehayyat, J. (2011). Organisational characteristics and practice of strategic planning in Jordanian hotels. International Journal of Hospitality Management, 30 (1), 192-199.
Bloemer, J., and Kasper, H. (1995). The complex relationship between consumer satisfaction and brand loyalty. Journal of Economic Psychology, 16 (2), 311–329.
Brady M., Cronin, J., and Brand, R. (2002). Performance-only measurement of service quality: a replication and extension. Journal of Business Research, 55, 17-31.
Brochado, A., and Marques, R.C. (2007). Comparing alternative instruments to measure service quality in higher education. Working Papers (FEP), University of Porto, December, 165, 1-19
Caruana, A. (2002). Service loyalty: the effects of service quality and the mediating role of customer satisfaction. European Journal of Marketing, 36 (7/8), 811–830.
Cronin Jr., J.J., and Taylor, S.A. (1992). Measuring service quality: a reexamination and extension. Journal of Marketing, 56 (3), 55–69.
Cronin Jr., J.J., and Taylor, S.A. (1994). SERVPERF vs. SERVQUAL: reconciling performance based and perceptions-minus-expectations measurement of service quality. Journal of Marketing, 58 (1), 125–131.
Ekinci, Y., Prokopaki, P., and Cobanoglu, C. (2003). Service quality in Cretan accommodations: marketing strategies for the UK holiday market. International Journal of Hospitality Management, 22 (1), 47-66.
Fache´, W. (2000). Methodologies for innovation and improvement of services in tourism. Managing Service Quality, 10 (6), 356-66.
Fischer, j., Khan, I., Khemani, T., and Najmi, R. (2009). Jordan tourism cluster. Microeconomics of Competitiveness Institute for Strategy and Compositeness. Harvard Business School.
Gaur, S.S., and Agrawal, R. (2006). Service quality measurement in retail store context: a review of advances made using SERVQUAL and RSQS. The Marketing Review, 6 (4) 317-330.
Gronoos, C. (1984). An applied service marketing theory. European Journal of Marketing, 16 (17), 30–41. Gronroos, C. (1990). Service Management and Marketing. Lexington; Lexington Books.
Jain, S.K., and Gupta, G. (2004). Measuring service quality: SERVQUAL vs. SERVPERF Scales. VIKALPA, 29 (2), 25-37.
Kandampully, J. (2000). The impact of demand fluctuation on the quality of service: a tourism industry example. Managing Service Quality, 10 (1), 10-18.
Lam, T., and Zhang, H. (1999). Service quality of travel agents: the case of travel agents in Hong Kong. Tourism Management, 20, 341–349.
Lau, P.M., Khatibi, A.A. and Fie, D.Y.G. (2005). Service quality: a Study of the luxury hotels in Malaysia. Journal of American Academy of Business, 7 (2), 46-55
Lehtinen, U., and Lehtinen, J.R. (1991). Two approaches to service quality dimensions. Service Industries Journal, 11 (3), 287–303.
McDougall, G.H.G., and Levesque, T. (2000). Customer satisfaction with services: putting perceived value into the equation. Journal of Services Marketing, 14 (5), 392–410.
Morgan, M. (1996). Marketing for Leisure and Tourism. New York: PrenticeHall.
Nadiri, H., and Hussain, K. (2005). Perceptions of service quality in north Cyprus hotels. International Journal of Contemporary Hospitality Management, 17(6), 469-480.
Nunnally, J.C. (1978). Psychometric Theory. New York:McGraw-Hill.
Oh, H., and Parks, S.C. (1997). Customer satisfaction and service quality: a critical review of the literature and research implications for the hospitality industry. Hospitality Research Journal, 20 (3), 35-64.
Parasuraman, A., Zeithaml, V., and Berry, L.L. (1985). A conceptual model of service quality and its implications for future research. Journal of Marketing, 49 (4), 41–51.
Parasuraman, A., Zeithaml, V., and Berry, L.L. (1988). SERVQUAL: a multiple item scale for measuring consumer perceptions of service quality. Journal of Retailing, 6 (1), 12–40.
Parasuraman, A., Zeithaml, V., and Berry, L.L. (1994). Reassessment of expectations as a comparison standard in measuring service quality: implications for further research. Journal of Marketing, 58 (1), 111–125.
Shahin, A., and Dabestani, R. (2001). Coloration analysis of service quality gap in four-star hotel in Iran. International Business Research, 3 (3), 40- 46
Teas, R.K. (1994). Expectations as a comparison standard in measuring service quality: an assessment of a reassessment. Journal of Marketing, 58 (1), 132–140.
Teas, R.K. (1994). Expectations as a comparison standard in measuring service quality: an assessment of a reassessment. Journal of Marketing, 58 (1), 132–140.
Vijayadurai, J. (2008). Service quality, customer satisfaction and behavioral intention in hotel industry. Journal of Marketing and Communication, 3 (3), 14-26.
Wong, O.M.A., Dean, A.M., and White, C.J. (1999). Analysing service quality in the hospitality industry. Managing Service Quality, 9 (2), 136-143.
Yilmaz, I. (2009). Measurement of service quality in the hotel industry. Anatolia: An International Journal of Tourism and Hospitality Research, 20 (2), 375-386.
Zeitaml, V.A., and Bitner, M.J. (2003). Service Marketing: Integrating Customer Focus across the Firm. New York:McGraw-Hill.
Zeithaml, V., Parasuraman, A., and Berry, L.L. (1990). Delivering Quality Service. New York:The Free Press. Zeithaml, V.A., Berry, L.L., and Parasuraman, A. (1996). The behavioral consequences of service quality. Journal of Marketing, 60 (2), 31–47.
Table 1. Service quality dimensions and their definitions Dimension Definition
Tangibles Appearance of physical facilities, equipment, personnel and communication materials Reliability Ability to perform the promised service dependably and accurately
Responsiveness Willingness to help (internal) customers and provide prompt service
Assurance Knowledge and courtesy of employees and their ability to convey trust and confidence Empathy Caring, individualized attention the employees provide to each other
Table 2. Gronbach Alpha for each dimension
Dimension No. of items Gronbach alpha
Tangibles 4 0.842 Reliability 6 0.710 Responsiveness 4 0.786 Assurance 3 0.914 Empathy 5 0. 817 Satisfaction 4 0. 850
Table 3. Characteristics of respondents
Characteristics Freq. % Age 25-34 55 19.7 35-44 84 30 45-54 93 33.2 55 and above 48 17.1 Gender Male 173 61.8 Female 107 38.2 Martial status married 156 55.7 single 124 44.3 Education level College degree 49 17.5 Bachelor’s degree 163 58.3 Postgraduate degree 23 8.1
No. of experienced hotels
Once 21 7.5
twice 37 13.2
Three times 82 29.3
Table 4. Descriptive statistics for each quality service element
Mean* SD
Tangible
The hotel has modern looking equipment 2.30 .095
The hotel’s physical facilities are visually appealing 2.32 1.02
The hotel’s employees are neat-appearing 2.45 1.10
Materials associated with the service are visually appealing at the hotel 3.12 1.21 Reliability
When the hotel promises to do something by a certain time, it does so 3.23 0.96 When you have a problem, the hotel shows a sincere interest in solving it 3.07 1.13
The hotel performs the service right the first time 2.70 1.03
The hotel provides its services at the time it promises to do so 2.91 1.10 Employees of the hotel tell you exactly when services will be performed 3.01 .095
The hotel insists on error-free records 3.21 1.04
Responsiveness
Employees of the hotel are never too busy to respond to your requests 3.86 0.93
Employees of the hotel give you prompt service 3.92 1.05
Employees of the hotel are always willing to help you 3.89 1.03 Assurance
The behavior of employees of the hotel instills confidence in customers 4.11 1.04 Employees of the hotel are consistently courteous with you 2.67 0.92 Employees of the hotel have the knowledge to answer your questions 3.19 0.98 The hotel has operating hours convenient to all its customers 3.80 1.32 Empathy
Employees of the hotel have the knowledge to answer your questions 3.01 0.97 The hotel has employees who give you personal attention 2.31 0.99
The hotel has your best interest at heart 2.20 1.42
Employees of the hotel understand your specific needs 2.06 1.04
The hotel has employees who are competent 2.84 1.01
Customer satisfaction
Overall, I am satisfied with the hotel service 3.02 0.98
Satisfied with the decision to visit this hotel 3.20 1.23
My choice of this hotel is a wise are 3.12 1.33
I well say positive things about this hotel 3.04 1.21
*The mean is derived from a scale of 1=strongly disagree to 5= strongly agree Table 5. Correlation Between the quality service dimensions and customer satisfaction
Tangible Reliability Responsiveness assurance empathy Customer satisfaction .043 .339 .215* .022 .205* .011 .192* .039 .132 .236 *Correlation is significant at the .05 level (2- tailed)