Projects through graphs
M.M. Mahbubul SyeedTampere University of Technology, Finland [email protected]
Abstract. Comprehending Open Source Software (OSS) projects
re-quires dealing with huge historical information stored in heterogeneous repositories, such as source code versioning systems, bug tracking sys-tem, mailing lists, and revision history logs. In this paper, we present Binoculars, a prototype tool which aims to provide a platform for graph based visualization and exploration of OSS projects. We describe the is-sues need to be addressed for the design and implementation of a graph based tool and distill lessons learned for future guideline.
1 Introduction
Open Source Software (OSS) has gained interest in both commercial and aca-demic world over the past decade due to its high quality. Successful OSS projects produce a rich set of software repositories, coming with a large number of ver-sions reflecting their development and evolution history. These repositories con-sist of the source code, change logs, bug reports and mailing lists.
To know the facts related to such OSS project development, composition, and the possible risks associated with its use, one has to explore the huge information stored in the repositories. But often such repository contains het-erogeneous information with different data representation, which also varies significantly from project to project. Thus a tool support for uniform data rep-resentation and customizable visualization mechanism is required to ease the comprehension of OSS projects.
In this paper, we present the tool Binoculars as the first step towards a graph based platform to comprehend and visualize OSS projects. Video demonstration of the tool Binoculars can be seen from [11].
2 Tool support for comprehending OSS projects: A review
This section presents a review on tool supports that offer different visualization approaches for comprehending OSS projects.
The tool, CodeSaw [10] provides a time series representation of social in-teraction data in juxtaposed displays. This tool explores links between one’s contributions to that of social interactions. In this context, the tool Tesseract
[10] explores the multi-perspective relationships in a project for a user-selected time period (i.e., the evoluiton), and represents them via four juxtaposed dis-plays.
In [10], FASTDash was proposed as an interactive conflict management tool which provides a spatial representation of the shared code base by highlight-ing team members current activity. The tool CollabVS [10] addresses this issue at editing time, and provides a visual representation of conflicting code and a communication mechanism. The tool Palantir [10] performs similar task by graphically displaying the shared workspace to the developers with the infor-mation of what others are doing, and calculating the severity of such activities. Also the tool Augur [10] provides a line oriented view of the source code with colors for each pixel line indicating the location of the modification work and how recently it was conducted. This visualization allows to see how much ac-tivity has taken place recently and where that acac-tivity has been located.
In [10], the tool Ariadne utilizes call-graph approach to visualize social de-pendency of the developers due to code sharing. Similarly, the tool Expertise Browser [10] determines developers expertise from historical contributions.
Though the tools discussed above provide useful insight of OSS projects through different visualization approaches, yet none effectively explores graph based visualization of OSS projects. We thus add another dimension towards the comprehension of OSS projects by providing a graph based data representa-tion and visualizarepresenta-tion. The principal argument here is that graph structures are most suitable for analyzing data that exhibits inherent relationships. In this con-text, the repository data produced by OSS projects exhibit strong relationships among them due to common work space sharing and exchange of information. For example, community members often share many technical competencies, values, and beliefs over online discussion forums. Similarly, code artifacts have interrelationships due to architectural dependency as well as due to contribu-tions from multiple community members. Thus, OSS projects can be effectively comprehended through graph based representation and visualization.
3 Graph Based Visualization
In this section we concentrate on the available methods and techniques exploited in literature for graph based data representation and visualization. We also put a discussion on pros and cons of such techniques.
Graph based data representation and visualization can be effectively utilized when there exists inherent relations among data elements [3]. In such visualiza-tion, one can generate any number of links (i.e., edges) between two data points (i.e., nodes), and can easily traverse a given path through the data. This visual experience can be enhanced further by using layout algorithms, navigation and interaction methods, and incremental exploration mechanisms [3].
A significant amount of libraries, frameworks and toolkits are developed to support such visualization. To mention a few, GraphEd [4],the Tom Sawyer
Software Graph Editor Toolkit [5], Graphlet [6], JUNG [1] provide APIs with different layout algorithms, customization, generic graphics and interprocess communication to create task-specific tools. Libraries and frameworks like GTL, LINK, GFC, GDT, and GVF provide support for both general and specific purpose graph visualization [3]. Within open source domain, Graphviz [10] and Zest [10] provides comprehensive set of APIs to support such visualization. Although there is no widely used standard for graph description formats, GML [7] and GraphXML [8] are available.
Despite of such benefits and supports for graph visualization, there are in-herent shortcomings to such techniques. This includes, (a) difficulties in visual-izing and comprehending large graphs. For example, a graph with thousands of nodes would cause performance bottleneck of the platform used and decrease the viewability (or usability) of such visualization significantly. In general, com-prehension and detail analysis of data in graph structures is easiest when the size of the displayed graph is small [3]; (b) efficiency of a graph layout algorithm may be scale upto several hundred nodes, not beyond that; (c) time complex-ity for visualization, interaction and update of a graph is relatively high and increases with increase in graph size.
So far no single toolkit or framework mentioned above has proved to be suf-ficient to cope with these problems. Thus design decision for implementing an efficient graph visualization tool should ruminate the followings, (a) provide ap-propriate level of data abstraction. This keeps the graph structure small enough for effective comprehension and increase the efficiency of layout algorithms. To explore the graph, incremental exploration mechanism should be implemented, (b) time complexity of an algorithm should be measured accurately.
4 Binoculars: A graph based platform
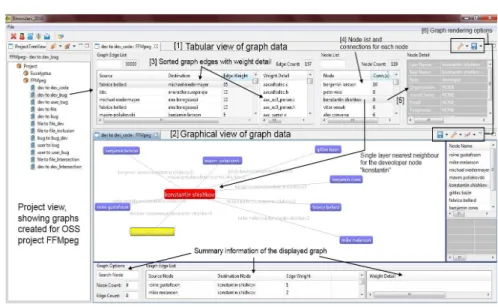
This section describes the requirements to design and implement a graph based visualization tool and presents Binoculars as a representative example. These requirements are derived considering the characteristics of OSS projects and the shortcomings of graph visualization techniques. The usability features of Binoculars are also presented. Fig. 1 shows the main interface of Binoculars.
First requirement is to provide an architectural model supporting well de-fined extension points for extending functionalities. As OSS analysis tools of this kind operate on project data, thus a good starting point is to model a gen-eralized and standard data representation. This forms the system kernel and provides interfaces to build functionalities over it. The conceptual architecture of Binoculars is shown in Fig.2. In Binoculars, we defined a data repository structure to store both project and graph data (Fig.2), and use XML data format for representation (Fig.3(a)). XML is chosen over others due to (a) its inherent power of extensibility with new tags, (b) standard formating, and (c) graph generation and manipulation seems flexible with XML.
Fig. 1.User interface of Binoculars
Having modeled such a repository, the next step is to decide what data to represent and how. For current implementation of Binoculars, we explored CVS or SVN checkouts, bug reporting system and mailing list. To represent data we adopt the following approach- first identified each entity within an OSS project which plays a role (either active or passive). For example, a community member (e.g., developer, user as active entities), and a code file, a single thread of mail and bug report (as passive entities). Then we identified unique set of attributes to describe each entity and provide values with the data mined from the sources presented above. In XML each such attribute is presented as a tag. Fig.3(a) shows an example of a code file representation.
Academic Version for Teaching Only Commercial Development is strictly Prohibited
Academic Version for Teaching Only Commercial Development is strictly Prohibited
Binoculars Architecture package Data[ ] Repository Project Repository Graph Repository GraphView GraphicalView TabularView CustomizeGraph StatisticalView CreateGraph ProjectView QueryGraph «use» «use»
Third, a set of methods should be derived to transform repository data into graphs. These methods and the graph data should be reusable in a sense that one or more graph data can be reused by a method to generate new graphs. In Binoculars, graph data are stored using XML representation (example, Fig. 3(b)). As the methods operates on XML tags, thus one interface works for all repository data. As shown in Fig 2, CreateGraph module implements these graph generation methods, which are discussed in [9].
Fourth, provide a GUI support to visualize, render and manipulate graph data. This GUI design for graph visualization is often constrained by the lim-iting factors of the available visualization techniques discussed in section 3. To cope with these issues we took the following measures. We provided a two-way visualization of a graph, e.g., tabular and graphical (Fig.1 items 1,2). Tabular view provides complete graph information consisting of (a) Graph with nodes and (weighted) edges; (b) Node list with degree count for each node; (c) de-scription of each node; (d) Summary data on graph; and (e) Options to render a graph (Fig.1, item 3,4,5,6, respectively). Thus user can get complete graph data with detail information in real time for large graphs with thousands of nodes. Then, depending on the option selected for rendering a graph, a modified (or abstracted) version of the graph (in tabular view) can be viewed in graphical form. As shown in Fig.1 item 2, a single level nearest neighbor graph showing the developers to whom developer “Konstantin” has direct communication in FFMpeg project [10]. Hence the graphical view (Fig.1 item 2) always shows a tailored version of the complete graph provided in tabular view (Fig.1 item 1), thus minimizing the performance bottleneck of layout algorithms.
Fig. 3.(a) XML representation of a code file repository in FFMpeg project. (b) XML
presentation of a developers relationship graph generated from (a)
Other options for rendering a graph includes (Fig.1, item 6), customization based on (a) given range of edge weights, (b) selected set of nodes or edges from the original graph, (c) a given attribute value (e.g., gio-location= “america”).
None-the-less, searching, sorting, zooming, and saving graph data in XML format can also be performed. As in Fig. 2, rendering mechanisms are imple-mented in QueryGraph and CustomizeGraph module, and the visualization are handled by ProjectView, GraphView and StatisticalView modules.
Fifth, selection of platform and packages for implementation should be steered by it’s easy extension and distribution. Our choice in this issue is to release Binoculars as an OSS. Thus we utilized well established and maintained OSS platforms and packages, e.g., Eclipse, Eclipse RCP, ZEST, DOM, and JFreeChart. Reference to these platforms can be found here [10].
5 Discussion and Future work
In this paper we put a discussion on the requirements to model and implement a graph based platform for comprehending OSS projects, and present the tool Binoculars as a first step towards establishing such a platform. Our starting point is the design of a repository to capture the essence of OSS projects and then built tool functionalities over it to operate on repository data. We also discuss the inadequacy of graph visualization techniques and distill possible solution.
Future extension of this tool includes, (a) visualization on the evolution of socio-technical aspects of OSS projects, (b) Incremental exploration mechanism on the displayed graph, and (c) a formal language query support.
References
1. Souza C.R.B., Quirk S, Trainer E., Redmiles D.F. (2007) Supporting collabora-tive software development through the visualization of socio-technical dependen-cies. In: ACM SIGGROUP Conference on Supporting Group Work, pp.147-156. 2. Mockus A, Herbsleb J (2002) Expertise browser: A quantitative approach to
identifying expertise. In: ICSE, pp.503-512.
3. Herman I, Melancon G, Marshall MS (2000) Graph visualization and navigation in information visualization: A survey. In: TVCG, IEEE, 6(1):24-43.
4. Di Battista G, Eades P, Tamassia R, Tollis IG (1999) Graph Drawing: Algorithms for the Visualization of Graphs. Prentice Hall.
5. Becker RA, Eick SG, Wilks AR (1995) Visualizing Network Data. In: TVCG, IEEE 1(1):16-28.
6. Argawal PK, Aronov B, Pach J, Pollack R, Sharir M (1995) QuasiPlanar Graphs Have a Linear Number of Edges. GD, SpringerVerlag, pp.1-7.
7. Himsolt M (1997) GML Graph Modelling Language. University of Passau. 8. Herman I, Marshall MS (1999) GraphXML. Reports of the Centre for
Mathe-matics and Computer Sciences.
9. Syeed M. M., Aaltonen T., Hammouda I., Syst T. (2011). Tool Assisted Analysis of Open Source Projects: A Multi-Faceted Challenge. IJOSSP, 3(2): 43-78. 10. References (2012)http://rajit-cit.wix.com/syeed#!refrences