Designing Software Cockpits for Coordinating Distributed
Software Development
1,2
Isabella da Silva,
1Marcelo Alvim,
1Roger Ripley,
1Anita Sarma,
2Cláudia Werner,
1André van der Hoek
1Department of Informatics
University of California, Irvine
Irvine, CA 92697-3440, USA
{ialmeida, malvim, rripley, asarma,
andre}@ics.uci.edu
2
COPPE/UFRJ - Systems Engineering and
Computer Science Program
Federal University of Rio de Janeiro
Rio de Janeiro, RJ, Brazil
{isabella, werner}@cos.ufrj.br
Abstract
Coordination of global software development is particularly difficult as it involves teams that are dis-tributed across different locations and time zones. One of the key issues is a lack of understanding of how ac-tivities of different teams (and team members) relate to one another. To provide situational awareness for dis-tributed teams, software cockpits, at-a-glance com-puter-controlled displays of data collected from multi-ple sources, have been proposed. In this paper, we in-troduce a set of design decisions that need to be con-sidered for building software cockpits, present our ap-proach to realizing such a cockpit based on three ex-ploratory visualizations of distributed software devel-opment projects, and conclude with a discussion of lessons learned so far.
1. Introduction
Software development is defined as a multi-team construction effort of a multi-version system consisting of highly interdependent artifacts [1]. Development activities, therefore, need to be properly coordinated to enable the implementation of complex software. Dis-tributed development makes coordination, an already difficult task [2], more difficult, since developers can no longer talk face-to-face to resolve issues. And when such distributed development starts crossing geo-graphical time zones, and teams use separate tool suites and different development processes, it becomes even harder to properly coordinate work [3, 4].
One way to deal with this complexity is to modular-ize the software into separate units, assign different roles to different teams, establish agreed-upon inter-faces, and define specific synchronization points [5]. Unfortunately, even then, conflicts are known to occur,
often frequently so. Some of the reasons behind these breakdowns are the following: (1) it is not always pos-sible to discretize work into independent modules [6], (2) developers cannot always correctly estimate the modules they require for their tasks [7], and (3) inter-faces are changed without appropriate communication to other teams [8, 9].
This lack of situational awareness – dynamic knowledge and understanding of a complex and evolv-ing task situation – is a key problem. As a result, team members typically work in an isolated manner in their development environments, only obtaining information about potential coordination breakdowns (and their ef-fects) during synchronization points [10]. Duplicated efforts or emerging conflicts stay undetected until changes are completed, a time when conflicts are harder to resolve [11].
To create situational awareness, teams need to be informed of ongoing project activities, so they can place their work in the context of others’ and more ef-fectively coordinate their efforts [12]. To do so, teams need to share project-related information, such as which developer is responsible for the maintenance of a specific module, which developer should be con-tacted when an integration test fails, the number of teams that are dependent on a particular interface, and many other kinds of information that help developers and managers in better performing their tasks.
To present this information in a meaningful way, we propose to examine various visualizations in the context of software cockpits, at-a-glance computer-controlled displays of development-related data col-lected from multiple sources. Just as airplane cockpits display information regarding an aircraft’s situation, position, and progress, software cockpits can be used to display information regarding software projects’ status.
The remaining of the paper is organized as follows. In Section 2, we describe a set of key design decisions for building software cockpits. Section 3 presents our proposed approach in terms of three different visuali-zations of a software project. We conclude in Section 4 with a discussion of our current status and future plans.
2. Design Decisions
For a software cockpit to be successful, it is impor-tant that the “right” information is presented to the “right” user at the “right” time. This means that differ-ent cockpits can be designed for differdiffer-ent purposes. Maletic et al. [13] have described a set of five dimen-sions that can define software visualizations in general: tasks (why is the visualization needed); audience (who will use it); target (what is the data source to repre-sent); representation (how to represent it) and medium (where to represent the visualization). In this section, we extend this set to nine dimensions that are targeted more specifically at software cockpits:
- Target audience: The primary users of a software cockpit are one of the main influences on its design. Cockpits can be equally useful for different people in the project, such as managers, team leaders, de-velopers, testers, etc. However, the specific types of information that are required by these people differ and the software cockpit should be carefully aligned accordingly. For instance, managers usually require an overview of the entire project and its progress, while testers and developers require more detailed information about specific software modules and re-lated artifacts, including code errors and failed tests. - Supported task: One may need different information
while performing different tasks. For instance, when developers are integrating code, they might need to know about conflicting changes and who generated them. When debugging, on the other hand, they might need to know in which version the bug first appeared and why. Therefore, software cockpits can be designed to support a specific task or can be con-figured to support different tasks at different times. - Data collection: To present a holistic view of the
en-tire project, software cockpits need to collect data from multiple sources (e.g., CM systems, issue-trackers, build systems). Further, in multi-team pro-jects this information needs to be collected from dif-ferent teams. Software cockpit designers have to de-cide which data sources will be used and learn how to access those.
- Data analysis: Collected data in its rough form might not be immediately ready for presentation. Its format may not be sufficiently meaningful for end users, and the amount of data might also be
over-whelming. Therefore, some data processing may be required to filter, aggregate and/or combine data from multiple sources. For instance, combining data about check-ins in the CM system and bug fixes in the issue tracker enables a historical view of which version of the artifact contained the bug, who was responsible for it, when was it fixed, and by whom. - Data presentation: Different kinds of data
represen-tations can be used to display information in soft-ware cockpits. Depending on the desired level of ab-straction, one can use text, tables, charts or different types of visualizations to show the data. For exam-ple, visualizing project metrics through charts is usu-ally simpler to understand than through long textual descriptions. Often, new visualizations rely on an underlying metaphor to help humans in interpreting the data that is presented. The city metaphor is an example [14].
- Timeliness: Software cockpits have to collect and display information in a timely manner. Some infor-mation is more time-critical than other, and should therefore be updated more frequently. For instance, when one needs to contact someone, it is more useful to know which developers are online at this moment than to know who was an hour ago. Then again, past online status data can be analyzed to infer when specific developers will be available next. Thus, critical decisions in the design of software cockpits are the recency of data, whether to be as up to date as possible, and whether to store and leverage his-torical data for other purposes.
- Sensitivity of data: Individual privacy and data con-fidentiality are important issues that need to be ad-dressed by cockpit designers. Care should be taken to disclose personal information only with the ap-propriate permission from the involved individual. Beyond this, additional attention has to be paid to the sharing of data across teams, especially in multi-company projects. Each organization’s policies about confidential, proprietary, and sensitive infor-mation should be properly respected. Finally, a cer-tain amount of organizational maturity is required with respect to public software cockpits that reveal detailed information about individuals and their per-formance. The “coding to the metric” phenomenon must be avoided.
- Display modes: Software cockpits can be used either as passive displays or as media for interactive explo-rations. In addition to simply displaying project data, most software cockpits should be designed to allow users to configure the displays through filters. Ap-propriate search capabilities generally also should be included to help users explore relevant information rapidly. For instance, on noticing a build failure, a
manger may wish to investigate the problem by que-rying the cockpit about the latest changes to the arti-facts causing the build failure, the dependencies that were affected or the developers responsible for the artifacts, etc.
- Display devices: The kinds of display devices that constitute the software cockpit need to be carefully chosen with respect to their size, their resolution, and the modes of interaction they support. For ex-ample, if a cockpit will be used as an “information radiator” [15] presenting data for the entire team, it needs to be visualized through a large screen placed in a shared room. To facilitate exploration of infor-mation, an interactive display media is more appro-priate. Alternatively, regular size monitors can serve as customized cockpits for individual developers.
3. Approach
We are developing an exploratory software cockpit through three prototype visualizations of global soft-ware development projects, each organized from a dif-ferent perspective. The first visualization uses the metaphor of locality to show high-level information about teams and dependencies among them in an inter-active world map. The second one displays the system design through a self-updating view of the current state of the software implementation using the metaphor of the system. Finally, the last prototype, based on a task activity metaphor, is a 3D visualization that presents an overview of current and past activities in individual workspaces.
3.1.World View
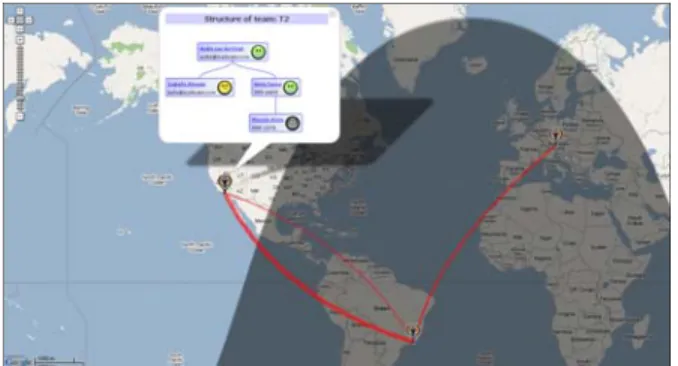
World View (see Figure 1) is built in the metaphor of locality, using a world map to present team dynam-ics in a globally distributed project [16]. It is targeted at project managers and team leaders, who need an overview of project status in different levels of detail. At its higher level of abstraction, World View shows physical locations of teams and the relationships among them, such as code calls from one team to an-other, shared artifacts, and issues opened by one team to the other. World View also enables one to zoom into a team, so as to visualize finer grained details, like de-pendencies among members, their contact information, availability status and current tasks. This data is col-lected from multiple sources, such as IDEs, CM sys-tems and issue-tracking syssys-tems. While it is important that this information is kept up-to-date, the tool also maintains archival data, which can be used for future reference and help in understanding project evolution.
Figure 1 – World View.
By using this view, managers can quickly identify which teams are tightly coupled and may require higher levels of communication. Moreover, World View can be used to visualize project history in terms of changes in dependencies over time. An increasingly strong dependency between two teams may warn man-agers of coordination problems if the teams were not intended to be tightly coupled.
World View is ideally suited to a large, interactive display, so as to facilitate and encourage exploration of the information it presents. Such displays could be in a manager’s office or in a shared space, where develop-ers could gather and explore project-related data, to better coordinate amongst themselves.
3.2.Lighthouse
Lighthouse [17] provides a finer-grained view of software projects for developers and managers using the metaphor of the system design. It does so by auto-matically building an abstraction of the software as a UML-like class diagram that is updated in real time as developers code (see Figure 2). All information about changes made to the code are collected directly from the developers’ workspaces and propagated immedi-ately to all project members. Through Lighthouse, one can visualize the current system design as it is directly emerging from the collaboratively built source code and watch it evolve as implementation advances.
This dynamic view supports early detection of de-sign decay by allowing users to identify unintended, undiscovered and unauthorized design changes. Problems like conflicting changes in shared artifacts and duplicate work can also be spotted as soon as they surface. Furthermore, Lighthouse presents authorship information for each element in the diagram, identify-ing which developers are responsible for each step of the design evolution. This information can be used to identify collaboration opportunities for developers working in related artifacts, to find potential “experts” in specific parts of the system or understanding who was responsible for breaking an interface contract.
Figure 2 – Lighthouse view of emerging design.
For developers, Lighthouse can help in understand-ing how their tasks are related to others’. It is explicitly designed to support coordination of ongoing coding efforts and, as such, should be used on a second moni-tor. This promotes peripheral awareness and helps de-velopers focus on the specific parts of the system that they are working on. For managers, Lighthouse can be used in a larger display with the view of the entire emerging design in order to assess overall implementa-tion progress and current developers’ activities. 3.3.Workspace Activity Viewer
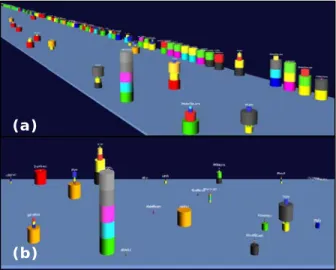
Workspace Activity Viewer (WAV) [18] is a 3D visualization based on the metaphor of task activities. It was developed for managers to have an overview of ongoing activities in a project, using information ex-tracted directly from developers’ workspaces. WAV provides two different views: artifact centric and de-veloper centric. In the first view (see Figure 3a), stacks of cylinders represent changes made to an artifact; each cylinder representing a change by a specific de-veloper. Thus, the height of the stacks of cylinders represents the amount of changes to the artifact. As artifacts become dormant, the stacks of cylinders slowly move to the back of the display. The further to the back a stack is, the more time that artifact has been dormant. In the developer centric view (see Figure 3b) stacks represent developers, while each cylinder repre-sents a change to a specific artifact. In both views, the magnitude of a change (currently calculated as the relative number of lines of code that have changed) is conveyed by the width of its cylinder.
Through WAV, managers can obtain an overview of the state of a project at a glance. For instance, one can quickly discern concurrent modifications to the same artifact; detect artifacts that had numerous edits and, thus, are prone to problems; identify experts based on their past development efforts, and so on. Addition-ally, WAV provides a playback feature that enables users to visualize both the current status and the evolu-tion of the project.
Figure 3 – Workspace Activity Viewer’s (a) Artifact View and (b) Developer View.
WAV is ideally suited for a high-resolution large display in a central location, where users can discern at a glance the status of their project. However, as with any awareness tool, displaying activity related data raises privacy concerns and, though WAV provides no accommodations for it yet, should be appropriately dealt with.
3.4.Physical Setting
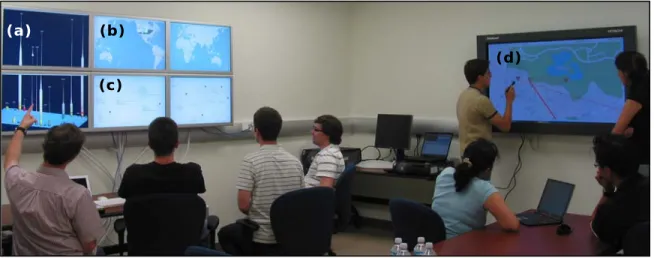
Currently, we are exploring our prototype software cockpit in a dedicated room with a cluster of six 30” Apple cinema displays and a 55” Hitachi interactive board. Figure 4 shows an example usage: a team of developers uses the Apple cluster displaying Work-space Activity Viewer (Figure 4a), World View (Figure 4b), and Lighthouse (Figure 4c) for their status meet-ing, while the other team explores dependency con-flicts through World View by using the interactive board (Figure 4d).
4. Discussion
While not always specifically targeted at building software cockpits, there has been significant work done in software projects data collection, analysis and visualizations. For instance, Hackystat, a software met-ric tool, unobtrusively collects and analyzes data from different development tools (e.g., test coverage tools, bug trackers, IDEs) to generate graphs and reports [19]. With a different focus, the War-room Command Console [20] uses different display techniques to pro-vide awareness of ongoing workspace activities.
(a)
Our prototype software cockpit combines both ag-gregation of project data from multiple sources and the use of different metaphors (locality, system design, and task activity) to visualize the collected data in a cen-tralized manner. Our experience so far is of using open source projects as usage examples, but we also intend to explore global software development projects in in-dustry in the future.
5. Acknowledgments
Effort partially funded by the National Science Founda-tion under grant numbers CCR-0093489, IIS-0205724, and IIS-0534775. Effort also supported by an IBM Eclipse Inno-vation grant and an IBM Technology Fellowship.
6. References
[1] D.L. Parnas, Some Software Engineering Principles. Infotech State of the Art Report on Structured Analysis and Design, Infotech International, 1978.
[2] G.M. Olson, J.S. Olson, Distance Matters. Human-Computer Interaction, 2000. 15(2&3): p.139-178.
[3] R.E. Grinter, J.D. Herbsleb, D.E. Perry. The Geography of Coordination: Dealing with Distance in R&D Work. ACM Conference on Supporting Group Work. 1999. p.306-315. [4] J. Herbsleb, et al. An Empirical Study of Global Software Development: Distance and Speed. 23rd International Con-ference on Software Engineering. 2001. p.81-90.
[5] D.L. Parnas. On the Criteria to Be Used in Decomposing Systems into Modules. Communications of the ACM, 1972. 15(12): p.1053-1058.
[6] D.E. Perry, H.P. Siy, L.G. Votta. Parallel Changes in Large Scale Software Development: an Observational Case Study. 20th International Conference on Software Engineer-ing. 1998. p.251.
[7] B. Curtis, H. Krasner, N. Iscoe. A Field Study of the Software Design Process for Large Systems. Communica-tions of the ACM, 1988. 31(11): p.1268-1287.
[8] B. Sengupta, S. Chandra, V. Sinha. A Research Agenda for Distributed Software Development. 28th International Conference on Software Engineering. 2006. p.731-740. [9] C.R.B. de Souza, D. Redmiles, P. Dourish. "Breaking the Code", Moving between Private and Public Work in Collabo-rative Software Development. International Conference on Supporting Group Work. 2003. p.105-114.
[10] R.E. Grinter. Supporting Articulation Work Using Soft-ware Configuration Management Systems. ACM Conference on Computer Supported Cooperative Work. 1996. p.447-465. [11] A. Sarma, A. van der Hoek. A Conflict Detected Earlier is a Conflict Resolved Easier. 4th Workshop on Open Source Software Engineering. 2004. p.82-86.
[12] C. Gutwin, S. Greenberg. Workspace Awareness for Groupware. Conference Companion on Human Factors in Computing Systems. 1996. p.208-209.
[13] J.I. Maletic, A. Marcus, M.L. Collard. A Task Oriented View of Software Visualization. 1st International Workshop on Visualizing Software for Understanding and Analysis. 2002.
[14] R. Wettel, M. Lanza. Visualizing Software Systems as Cities. 4th IEEE International Workshop on Visualizing Software for Understanding and Analysis. 2007.
[15] A. Cockburn, Agile Software Development. 1 ed. 2001: Addison-Wesley Professional. pp.256.
[16] A. Sarma, A. van der Hoek. Towards Awareness in the Large. 1st International Conference on Global Software En-gineering. 2006. p.127-131.
[17] I. da Silva, et al. Lighthouse: Coordination through Emerging Design. OOPSLA Workshop on Eclipse Technol-ogy eXchange. 2006. p.11-15.
[18] R. Ripley, A. Sarma, A. van der Hoek. A Visualization for Software Project Awareness and Evolution. 4th Interna-tional Workshop on Visualizing Software for Understanding and Analysis. 2007.
[19] HackyStat, http://www.hackystat.org/hackyDevSite/ [20] C. O'Reilly, D. Bustard, P. Morrow. The War Room Command Console: Shared Visualizations for Inclusive Team Coordination. ACM Symposium on Software Visuali-zation. 2005. p.57-65.
Figure 4 – Prototype software cockpit showing (a) Workspace Activity Viewer, (b) World View and (c) Light-house on the Apple display cluster and (d) World View (zoomed in) on the interactive board.
(a) (b) (c)