Air Force Institute of Technology
AFIT Scholar
Theses and Dissertations Student Graduate Works
3-11-2011
A Multi Agent System for Flow-Based Intrusion
Detection Using Reputation and Evolutionary
Computation
David Hancock
Follow this and additional works at:https://scholar.afit.edu/etd
Part of theComputer and Systems Architecture Commons,Digital Communications and
Networking Commons, and theInformation Security Commons
This Thesis is brought to you for free and open access by the Student Graduate Works at AFIT Scholar. It has been accepted for inclusion in Theses and Dissertations by an authorized administrator of AFIT Scholar. For more information, please [email protected].
Recommended Citation
Hancock, David, "A Multi Agent System for Flow-Based Intrusion Detection Using Reputation and Evolutionary Computation" (2011).Theses and Dissertations. 1391.
A MULTI AGENT SYSTEM FOR FLOW-BASED INTRUSION DETECTION
USING REPUTATION AND EVOLUTIONARY COMPUTATION
THESIS
David L. Hancock, Captain, USAF AFIT/GCS/ENG/11-02
DEPARTMENT OF THE AIR FORCE AIR UNIVERSITY
AIR FORCE INSTITUTE OF TECHNOLOGY
Wright-Patterson Air Force Base, Ohio
The views expressed in this thesis are those of the author and do not reflect the official policy or position of the United States Air Force, Department of Defense, or the United States Government. This material is declared a work of the U.S. Government and is not subject to copyright protection in the United States.
AFIT/GCS/ENG/11-02
A MULTI AGENT SYSTEM FOR FLOW-BASED INTRUSION DETECTION USING REPUTATION
AND EVOLUTIONARY COMPUTATION
THESIS
Presented to the Faculty
Department of Electrical and Computer Engineering Graduate School of Engineering and Management
Air Force Institute of Technology Air University
Air Education and Training Command in Partial Fulfillment of the Requirements for the
Degree of Master of Science
David L. Hancock, BCEN Captain, USAF
March 2011
AFIT/GCS/ENG/11-02
Abstract
Intrusion Detection (ID) is essential for protecting computer networks. The rising sophistication of threats as well as the improvement of physical network properties present increasing challenges to contemporary ID techniques. For example, the rate of traffic inflow prevents most traditional network- and signature-based ID systems from conducting more than a sparse sampling, opening the door for malicious traffic to enter the network without scrutiny. ID techniques are commonly defined in terms oflocation (i.e. where it is performed) as well asapproach (howit is performed). With respect to location, the multi agent design paradigm leverages the strengths of both
network-based andhost-based ID methods. With respect to the approach,flow-based intrusion detection complements traditional signature-based and behavior-based ID systems.
This research develops: 1) a scalable software architecture for a new, self-organized, multi agent, flow-based intrusion detection system; and 2) a network simulation envi-ronment suitable for evaluating an implementation of this multi agent system (MAS) architecture and for other network research purposes.
Self-organization is achieved in two ways. First, a “reputation” system permits agents to dynamically find nodes that are most effective for classifying malicious network activity. Second, multi objective evolutionary algorithms aid in the search for effective operational parameter values.
A first implementation of the MAS architecture using reputation is quantitatively evaluated, via hypothesis testing, and found to significantly outperform a static, ran-domly distributed MAS for certain combinations of agent population sizes and obser-vation periods. Improvements range from 3.6 to 11.6 percent increased classification
accuracy.
Following these results, the network simulation environment complexity is in-creased in a second iteration design, and a new MAS is developed to deal with more realistic challenges, including communication difficulties and a broader range of ma-licious activity scenarios. The environment and the MAS are qualitatively evaluated and found to successfully achieve essential functionality.
These encouraging results establish an optimistic outlook for further research in flow-based multi agent systems for intrusion detection in complex computer commu-nication networks.
Acknowledgements
I express my deep gratitude to those on Earth as well as Those above that sup-ported my efforts to develop this thesis.
My spouse and my children patiently and gracefully handled my time away from home throughout this assignment. I owe them my heartfelt thanks for providing smil-ing faces at the end of many difficult days. They helped place this effort in its proper context, and I look forward to happy days ahead facing struggles together as we did at AFIT.
Professor Lamont also demonstrated patience, encouragement, and self-sacrifice in advising me throughout. He has been one of my strongest advocates in six years of service in the Air Force, and I am indebted to him for his efforts. I also thank Dr. Gilbert Peterson and Dr. Barry Mullins for valuable feedback on the final document and outstanding academic instruction which inspired it.
I thank my classmates for being Wingmen in the true sense of the word. God lives and loves us. Of that I bear personal witness.
Table of Contents
Page
Abstract . . . iv
Acknowledgements . . . vi
List of Figures . . . x
List of Tables . . . xii
List of Abbreviations . . . xiii
I. Introduction . . . 1
1.1 The Generic Intrusion Detection Problem . . . 2
1.2 Scope of Investigative Domain . . . 4
1.3 Research Goal and Evaluation Hypothesis . . . 6
1.4 Investigative Approach . . . 7
1.4.1 Prospective Beneficiaries . . . 8
1.4.2 The Use of Reputation . . . 9
1.5 Thesis Overview . . . 10
II. Literature Review . . . 12
2.1 Internet Modeling . . . 13
2.1.1 Modeling Limitations . . . 14
2.1.2 Modeling Internet Topology . . . 15
2.1.3 Modeling Internet Traffic . . . 21
2.1.4 Discrete Event Simulation . . . 24
2.2 Pattern Recognition . . . 27
2.2.1 Feature Selection . . . 32
2.3 Intrusion Detection With Emphasis on Flow-based Techniques . . . 36
2.4 Multi Agent Systems With Emphasis on Network Applications . . . 39
2.5 System Intervention Points . . . 40
2.6 Reputation . . . 43
2.7 Evolutionary Computation . . . 46
2.7.1 Evolutionary Algorithms: Concepts and Formalism . . . 47
2.7.2 Evolutionary Algorithms: Software . . . 50
2.8 Self Organization and Emergence . . . 51
2.9 Evaluation of Classification and Heuristic Systems . . . 52
Page
III. MFIRE: Network Simulation and Multi Agent System Design . . . 56
3.1 Network Simulation and Multi Agent System Design Overview . . . 57
3.2 Formal Problem Specification . . . 60
3.2.1 Classifier Model Selection . . . 63
3.2.2 Spatial Distribution of Agents . . . 64
3.3 Discrete Event Simulation Engine: MASON . . . 65
3.4 Simulated Network Design - MFIRE’s Domain of Operation . . . 66
3.4.1 Network Simulation Design Objectives . . . 66
3.4.2 Network Simulation Low Level Components . . . 67
3.4.3 Network Simulation Topology . . . 73
3.4.4 Network Simulation Traffic Routing . . . 74
3.4.5 Network Simulation Traffic Design . . . 75
3.4.6 Interfacing with MASON . . . 81
3.5 MFIRE (Multi Agent System) Design . . . 82
3.5.1 MFIRE Design Operational Objectives . . . 84
3.5.2 MFIRE Execution Flow Design . . . 85
3.5.3 MFIRE Robust Communications . . . 90
3.5.4 MFIRE Agent: Classification . . . 91
3.5.5 MFIRE Reputation . . . 95
3.5.6 MFIRE Agent Mobility . . . 97
3.5.7 Agent Distribution: Evidence of Self Organization . . . 98
3.5.8 Stability: An Emergent Property . . . 98
3.5.9 Optimization via a MOEA . . . 99
3.6 Java Implementation . . . 100
3.7 Summary . . . 103
IV. MASNAC: Network Simulation and Multi Agent System Design . . . 104
4.1 Overview: Key differences . . . 104
4.2 Network Simulation . . . 104
4.2.1 Node Behavior . . . 105
4.2.2 Size and Scale . . . 106
4.2.3 Topology . . . 106
4.2.4 Packet Payloads . . . 106
4.2.5 Attacks . . . 107
4.3 Multi Agent System . . . 107
4.3.1 MASNAC Classifier . . . 108
4.3.2 MASNAC Communications . . . 108
Page
4.3.4 MASNAC Feature Selection . . . 109
4.4 Summary . . . 110
V. Experimentation and Analysis . . . 111
5.1 Experimental Design . . . 111
5.1.1 MASNAC Performance Assessment: Response Variables, Factors, and Statistical Design . . . 113
5.1.2 MFIRE: Qualitative Evaluations . . . 114
5.1.3 Test Computational Environment Factors . . . 115
5.2 Results and Analysis . . . 116
5.2.1 MASNAC Performance Assessment: Results . . . 116
5.2.2 MFIRE and Associated Network Simulation Environment Assessment: Results . . . 121
5.3 Summary . . . 126
VI. Conclusions and Future Research . . . 128
6.1 Conclusions . . . 128
6.2 Future Research Activity . . . 129
6.3 Overall Summary . . . 131
A. Evolutionary Algorithms: Details and Applications . . . 132
1.1 Evolutionary Algorithms: Details . . . 132
1.1.1 Evolutionary Algorithms: Applications . . . 134
B. MFIRE System Details . . . 136
2.1 MFIRE: Messages . . . 136
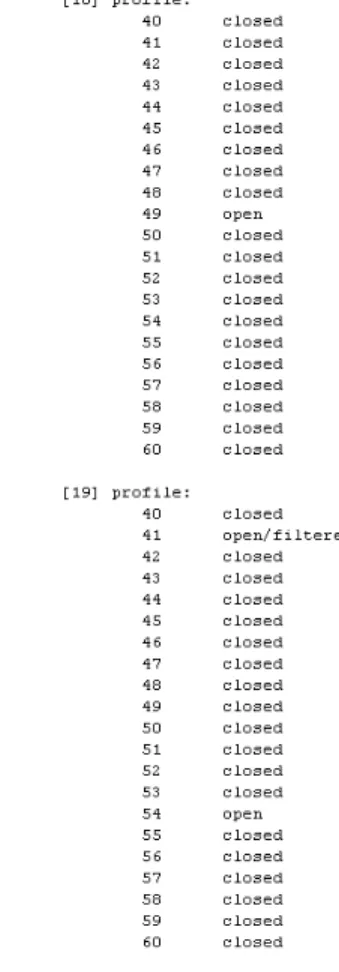
2.2 MFIRE: Observations . . . 136
C. Test Plan for MFIRE Command, Control, and Communications . . . 140
Bibliography . . . 148
List of Figures
Figure Page
1 Probability density function for Pareto distribution,
α= 1.0, b= 1.0 . . . 23
2 Basic elements of the MASON model and visualization layers . . . 26
3 A general perspective of a pattern recognition system . . . 27
4 Generic trust model: conceptual relationships . . . 44
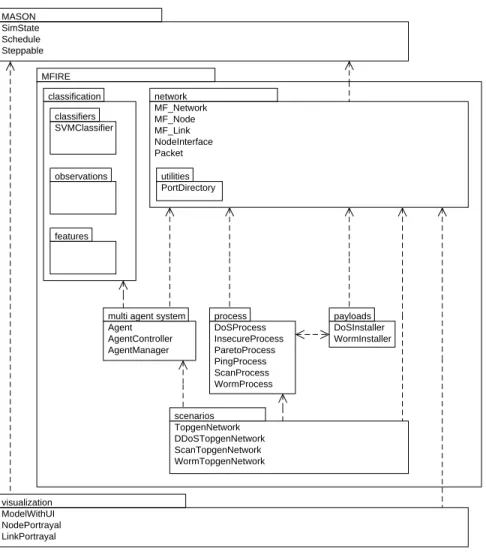
5 MFIRE package diagram. . . 58
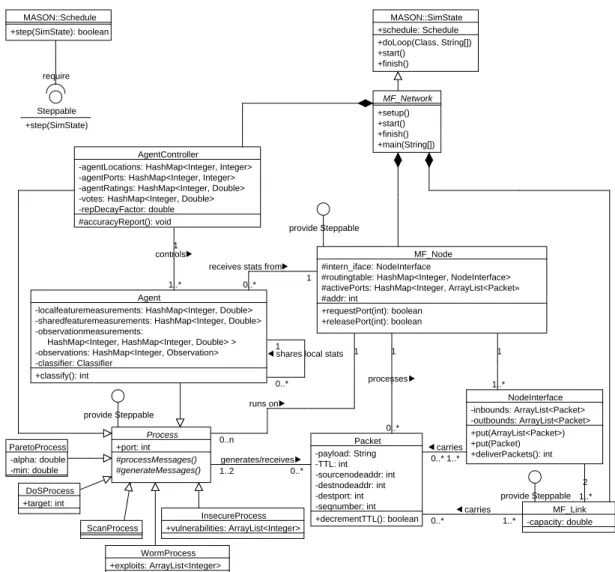
6 MFIRE class diagram. . . 61
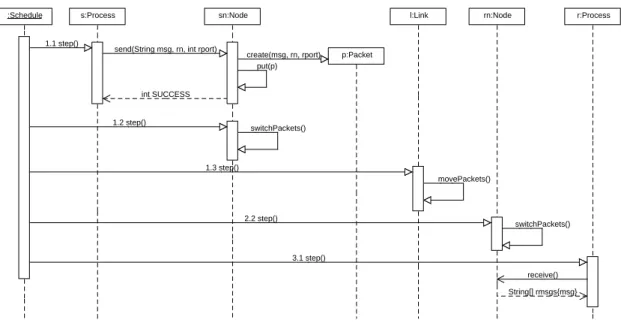
7 MFIRE sequence diagram illustrating the transmission of a packet . . . 71
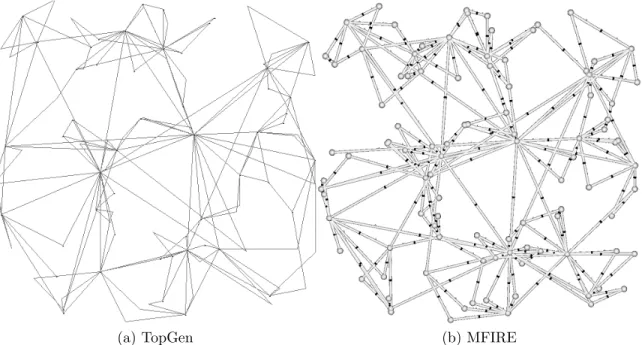
8 Network produced by TopGen and reproduced in MFIRE . . . 74
9 MFIRE: Example block scan conducted by the ScanProcess class . . . 78
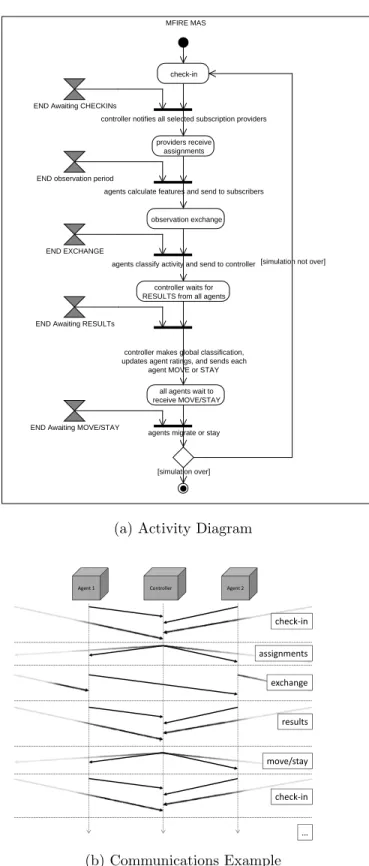
10 MFIRE activity and client-server diagrams showing the system’s normal flow of execution . . . 86
11 MFIRE detailed activity diagrams for the controller and the agent . . . 89
12 Comparison of reputation curves, using decay vs. not using decay, for single test runs in the MASNAC system . . . 96
13 MFIRE network simulation environment using MASON’s visualization and GUI facilities . . . 102
14 Iteration 1 network . . . 106
15 Classification accuracy of MASNAC under different parameters; in each boxplot: no reputation; reputation without decay; reputation with decay . . . 118
Figure Page
17 MFIRE DDoS Attack Test: Vizualization . . . 122 18 MFIRE: Figure 9 redisplayed to show block scan
conducted by the ScanProcess class . . . 123 19 Worm attack growth charts . . . 124 20 Worm attack visualization . . . 125 21 MFIRE: Messages sent by the controller and received by
agents . . . 137 22 MFIRE: Messages sent by agents and received by the
controller . . . 138 23 MFIRE: Messages sent by agents to other agents . . . 138 24 MFIRE: Messages involved in agent migration . . . 138
List of Tables
Table Page
1 Characteristics of multi-objective metaheuristics
frameworks (from [103]) . . . 50
2 How the AgentController Rates Providers of Shared Feature Values . . . 95
3 Comparison of Iterations 1 and 2 . . . 105
4 Attack Classes . . . 107
5 Two Agent Classification Accuracy Over 30 Runs . . . 117
6 P Values For Two-Sided Wilcoxon Rank Sum Test for Two Agent System . . . 117
7 Three Agent Classification Accuracy Over 30 Runs . . . 119
8 P Values For Two-Sided Wilcoxon Rank Sum Test for Three Agent System . . . 119
9 Four Agent Classification Accuracy Over 30 Runs . . . 120
10 P Values For Two-Sided Wilcoxon Rank Sum Test for Four Agent System . . . 120
List of Abbreviations
Abbreviation Page
IDS Intrusion Detection System . . . 1
AS Autonomous System . . . 4
IANA Internet Assigned Numbers Authority . . . 5
BGP Border Gateway Protocol . . . 5
DDoS Distributed Denial of Service Attacks . . . 5
DES Discrete Event Simulation . . . 7
BGP Border Gateway Protocol . . . 13
ARPANET Advanced Research Projects Agency Network . . . 15
LAN Local Area Network . . . 15
WAN Wide Area Network . . . 15
MAN Metropolitan Area Network . . . 15
BA Barab´asi-Albert . . . 17
NLANR National Laboratory for Applied Network Research . . . 18
FKP Fabrikant-Koutsoupias-Papadimitriou . . . 19
CD Controlled Distance . . . 20
DES Discrete Event Simulation . . . 22
EPE Expected Prediction Error . . . 30
SVM Support Vector Machine . . . 30
MDC Minimum Distance Classifier . . . 31
NIDS Network Based IDS . . . 37
Abbreviation Page
IPFIX IP Flow Information Export . . . 38
IETC Internet Engineering Task Force . . . 38
MAS Multiagent System . . . 39
EA Evolutionary Algorithm . . . 47
GAs Genetic Algorithms . . . 47
ESs Evolution Strategies . . . 47
EP Evolutionary Programming . . . 47
MCDM multiple criteria decision making . . . 48
MOEA Multi Objective Evolutionary Algorithm . . . 49
NSGA-II Non-Dominated Sorting Genetic Algorithm-II . . . 49
SPEA2 Strength Pareto Evolutionary Algorithm 2 . . . 49
RPC Remote Procedure Calls . . . 59
SOMAS Self Organized Multi Agent Swarms . . . 65
FIPA Foundation for Intelligent Physical Agents . . . 66
TCP Transmission Control Protocol . . . 68
UDP User Datagram Protocol . . . 68
IANA Internet Assigned Numbers Authority . . . 68
HTTP Hyper Text Transfer Protocol . . . 68
BSD Berkeley Standard Distribution . . . 79
CVE Common Vulnerabilities and Exposures . . . 79
NTP Network Time Protocol . . . 90
GUI Graphical User Interface . . . 102
Abbreviation Page
MOMA Multi Objective Memetic Algorithm . . . 134 PD projection distance . . . 134 TTL Time to Live . . . 140
A MULTI AGENT SYSTEM FOR FLOW-BASED INTRUSION DETECTION USING REPUTATION
AND EVOLUTIONARY COMPUTATION
I. Introduction
Surveying the modern digital expanse of the computer network for entities nefar-ious and profane is the work of an Intrusion Detection System (IDS). Techniques for intrusion detection are as diverse as their targets, but are often characterized in two ways: 1) network-based or host-based; and 2) signature-based or behavior-based [95]. The signature-based IDS reacts to strings flowing across its aperture that match a signature in a repository of undesirable anomalies. Such a system may be effective for many classes of attacks when caretakers provide a steady supply of up-to-date signatures. As the signature repository grows, however, it is increasingly difficult to compare every packet with every signature. The IDS can become overwhelmed with processing and fail to detect many malicious packets [95]. The behavior-based IDS, on the other hand, reacts to anamolous system activities. Unfortunately, the behavior-based IDS is designed to notice the symptoms of an already-infected subject. A technique complementary to these approaches examines statistics related to the inbound and outbound traffic flows1 and is particularly suited for attacks that make
large disturbances in the distributions of these statistics.
Network-based intrusion detection is typically implemented at the network’s gate-way. With this eye-the-sky vantage point, it may be able to detect patterns in-volving multiple hosts that individually would appear innocuous. It is technically 1A flow is a set of messages passing an observation point in the network during a certain time in-terval. Messages belonging to a flow have a set of common properties, such as source and destination addressing information and a message type [129].
challenging or impossible, however, for the network-based IDS to inspect every packet given today’s linespeeds, and will inevitably fail to protect individual hosts from every attack. Host-based intrusion detection can be highly responsive to local situations, but has no appreciation for malicious activity that is inherently distributed across the network. The multi agent system paradigm applied to intrusion detection attempts to get the best of both of these approaches [159]. Autonomous, mobile agents reside transiently at network hosts, and can detect and respond to local problems as well as summarize local information on behalf of a central entity performing network-based intrusion detection functions.
Sperotto et al. [139] survey current flow-based intrusion detection techniques. In each of 14 systems in their survey, data processing is centralized. In all but four of these systems, data collection is also centralized. In concluding remarks, they point to the research opportunities in “the development of distributed flow-based detection
systems” (emphasis in the original).
Hence, this research investigation develops and analyzes two iterations of a multi agent, flow-based intrusion detection system. One of the innovations in this research effort is the use and evaluation of a ‘reputation’ system to govern agent mobility.
1.1 The Generic Intrusion Detection Problem
Effective intrusion detection is vital yet elusive. Despite many good intentions and much effort between a White House Presidential Directive issued in 1990 and an-other published in 2009, the fundamental vulnerability of electronic systems remains largely unaltered. Such is the premise of [28], which also highlights the admission by the NSA’s General Keith Alexander in the Spring of 2010 that even U.S. classified networks have been penetrated [61].
is on display. Relatively benign evidence of this is seen in assessments of strategic competitor’s network operations capabilities [92]. Of more immediate impact are cases where such capabilities have been put to use. A specific example that recently dominated headlines is Stuxnet. This worm, which gained fame for its disruption of Iran’s nuclear production, is widely believed to have been produced by state-funded organizations. It is one of the most sophisticated cyber weapons everdiscovered [65]. Regarding the most sophisticated cyber weapon ever developed, the victims and the public at large may never hear about it.
Mafia-style cyber-crime establishments are also rapidly expanding, giving rise to pervasive phishing and botnet herding activities [6]. Adding further woe to the net-work security practitioner, even script kiddies2 remain a threat with the public
pro-liferation of sophisticated scan and attack tools.
Three major classes of network threats include [139]:
1. Attacks that consume network resources, denying their use for legitimate pur-poses;
2. Attacks that infiltrate systems, allowing attackers unauthorized access to system resources, including sensitive data, data storage, privileged relationships with other systems, and network connectivity;
3. Unauthorized vulnerability scans, providing attackers vital reconnaissance in preparation for infiltrating activities
In truth, these three threats are mutually reinforcing. For example, a successful scan allows an attacker to infiltrate networks with great stealth and precision; once in control of multiple hosts, the attacker may use them to launch a distributed denial 2Script kiddies use tools and techniques developed by others, usually employing them randomly and with little regard or even understanding of the consequences [115].
of service attack on another target system or network. Alternatively, the attacker can use these newly acquired assets to conduct further scans more efficiently / stealthily. As another example, a clever attacker may launch a denial of service attack on a highly visible service to divert the attention of security personnel from his infiltration activities.
These dangers both elevate and implicate the computer network security industry. Concepts such as ‘risk management’ and ‘formal solutions’ make contributions but ultimately fall short of comprehensive defense [156]. At the core of any network attack is simple misuse of technology made attractive by the ease with which anonymity is maintained. To counteract this, perhaps one day network devices will only handle digitally authenticated communications. In the meantime, development of better malicious traffic detection techniques should help the online world cope as best it can.
1.2 Scope of Investigative Domain
One way to cope involves elevating the viewpoint in order to gain a broader per-spective of malicious activity traversing and impacting multiple, connected networks. This community of networks perspective shares threat conditions among participants to enable more effective local response [1]. Such a community of networks may arise from a coalition of network owners, or it may fall under the ownership of a single entity, such as a worldwide corporation, government agency, or military.
Therefore, the network of interest to this research is the Autonomous System (AS)-level of the Internet. Each Autonomous System is an administrative domain, comprised of one or more networks of routers, switches, edge devices, and other physical elements, sometimes involving thousands of IP3addresses. Each Autonomous
3The Internet Protocol specifies the rules for communication across networks at the router level. A message sent using IP is apacket.
System is assigned a number by the Internet Assigned Numbers Authority (IANA) for inter-AS addressing. The Border Gateway Protocol (BGP) enables gateway routers in different ASes to advertise the reachability of assigned IP networks and routes to other IP networks.
The typical scenarios developed for our current research involve 100 nodes, each abstractly representing an AS. In the real world, the number of organizations associ-ated with a 100-node network of autonomous systems could number from one up to 100. Large organizations, such as the U.S. Department of Defense, have been assigned well over 100 IPv44 Autonomous System Numbers (though not all are in use at all
times).
The lengths of the links connecting the nodes in typical scenarios range from one to ten units, with implications for the geographical area represented. For example, if one allows a single unit link length to represent the length of the connection between two autonomous systems 200 miles apart or less, then the longest link length would be 2,000 miles. The propagation delay5 in this scenario ranges from approximately one to ten milliseconds.
Attacks of interest include those that heavily impact the distribution of the traffic arriving at any given node. These are:
• Scans
• Distributed Denial of Service Attacks (DDoS)
• Worms
These are discussed in more detail in Section 3.4.5 in connection with their simu-lated design and implementation.
4Internet Protocol version 4, despite an address space insufficient to meet the demand, still dominates in the networked world of 2011.
5Propagation delay measures the time required by the signal to traverse the link. Light travels 3.0×10⁸m/s.
1.3 Research Goal and Evaluation Hypothesis
Our goal is to develop an effective flow-based, multi agent system for inter-AS network attack classification.
It is our hypothesis that we can increase the effectiveness of a flow-based, multi agent network attack classifier by doing the following:
• Employ reputation to motivate agents to move when perceived as not providing useful information to peers;
• Decay the reputation to provide further impetus for agents to find the best vantage points.
The validation of the hypothesis drives specification of the following research objectives and associated evaluation benchmarks:
1. Develop an effective network simulation environment appropriate for the prob-lem scope. We desire to simulate networks of autonomous systems at an appro-priate level of abstraction, including networktopology as well as normal network
traffic. As a qualitative benchmark, the environment should be complex enough to permit a range of flow-based attacks, and present communications challenges due to propagation delay and link congestion;
2. Validate the proper functioning of simulated malicious traffic. For qualitative benchmarks, a DDoS should impede legitimate inter-node communications, a scan should produce a report of potential vulnerabilities on targeted systems, and a worm should demonstrate its ability to non-trivially self-propagate across the network;
3. Validate the proper command, control, and communications in the multi agent intrusion detection system. The second design iteration promises actual
inter-process communication in our network simulation as well as a robust commu-nications protocol for the multi agent system. Testing should demonstrate a variety of communications failures and indicate whether the system handles such failures gracefully and is able to resume normal operations autonomously; 4. Study the effects of several factors on classification accuracy. Factors include the number of agents, the use of reputation decay, and more generally, whether the reputation system is used at all. Our research development must quantitatively assess the performance of at least one of the iterations of our multi agent system under a variety of parameter values. In particular, we compare the system using reputation to the system not using reputation to assess the impact of reputation under various conditions.
1.4 Investigative Approach
Our research effort consists of two design iterations due to the complex nature of developing ID systems. In each, a network simulation environment, simulation sce-narios, and a multi agent system to classify current network activity are developed. Network simulations employ topology and traffic models reflecting associated obser-vations of the Internet. Self-organization in the multi agent systems is promoted via the use of a reputation system and evolutionary algorithms for automatic discovery of effective system parameter settings. The multi agent system in the first itera-tion has received the benefit of classificaitera-tion performance evaluaitera-tion as reported in [73, 72]. The multi agent system in the second iteration is qualitatively validated to demonstrate proper functionality of command, control, and communications.
The first investigative design iteration develops:
1. A basic network simulation environment implemented within a Discrete Event Simulation (DES) framework;
2. Scenarios for this network environment involving: (a) 10-node networks;
(b) Background traffic patterns mimicking the distribution of traffic seen on the actual Internet;
(c) DoS attacks;
3. A multi agent system for network attack classification employing reputation as a means of governing agent mobility.
The second iteration represents an architectural redesign, but incorporates all features from the first iteration and adds many additional features, including:
1. A more complex network simulation environment enabling interprocess commu-nication;
2. 100-node networks with topological characteristics following those of real-world AS networks;
3. Additional malicious scenarios including DDoS attacks, scans and worms; 4. A robust communications protocol, for the multi agent system, designed to
handle transmission losses and other errors.
1.4.1 Prospective Beneficiaries.
The envisioned customer of such a system deployed on real networks is a coalition of the organizations associated with the 100 autonomous systems. Members of such a coalition agree to facilitate agent mobility and communications across the AS-network. There are several reasons for accepting this as plausible:
1. In many cases, the number of organizations involved in an AS-network of this size would be small, even including just one organization. These cases greatly simplify the negotiations involved;
2. The agents are designed to collect and share only flow-related statistics, avoiding the sensitivities that come up with sharing signature-based intrusion detection data;
3. Participating organizations may be able to adapt better to conditions observed across the AS-network, for example by changing BGP tables or adjusting traffic filters.
1.4.2 The Use of Reputation.
In support of the fourth research objective, study the effects of several factors on classification accuracy, we develop a reputation system. Our reputation system is focused on evaluating agents’ ability to share “useful” information. It is used both to determine strength of stochastic preference when agents are selected to share information as well as a trigger for migration to another node.
To elaborate, each agent collects, from its host node, a series of local traffic statis-tics. Some agents are selected to share summaries of these statistics with other peers. Each agent then makes use of both local as well as shared information to make an individual classification, which is sent to a central entity (controller). Each agent is essentially “voting” on each cycle with respect to the overall classification of the re-cently observed network activity. The reputation of each agent is affected by whether shared information helped recipients vote in step with the majority, compared with how the recipient would have voted using only local information, resulting in arating
in each case. A rating table provides the values used to modify agent reputations for various cases. When an agent’s reputation drops below a threshold, the controller
instructs it to move to a different node. Upon moving, reputation is reset to the average of the stationary agents.
Many questions arise with such a design proposal:
• Can this reputation scheme actually increase the system’s classification accuracy over time, or does it tend to reinforce collectively bad behavior?
• Can agents coalesce to a single node so as to guarantee all shared information is in agreement with local information, and thus avoid any single agent not voting in step with the majority on account of shared information?
• This being a possibility, can a rating table be designed in such a way that it counteracts this tendency?
• How does one find the values for the rating table leading to the best perfor-mance?
• Whether agents share no information and receive no ratings, or share informa-tion that never challenges recipients’ perspectives and receive neutral ratings, it is possible that some agents can stagnate, performance-wise, over time. Reputa-tions stabilize above the threshold for migration and exploration of the network comes to a halt. If the reputation of each agent is decayed each cycle regardless of received ratings, can this more effectively spur agents to find better vantage points in the network leading to better system performance?
• What is the impact of the number of agents involved?
1.5 Thesis Overview
This chapter frames the problem and explains an approach to solving it. Chapter I delves into the concepts involved in realizing this approach, including flow-based
ID, reputation, and evolutionary computation. Chapters III details the design of the latest iteration of our network simulation and our multi agent system called MFIRE. Chapter IV highlights the differences between this and the first iteration of our net-work simulation environment and multi agent system called MASNAC. Chapter V presents the experimental performance analysis of MASNAC (first iteration design) as well as the results of system validation for our second iteration efforts, including MFIRE and its associated network simulation environment. Chapter VI concludes with a summary of the research impact and opportunities for future research.
In presenting the second design iteration first (in Chapter III), we avoid traversing twice that ground which is shared in both design iterations between concept and implementation.
In the final analysis, while the multi agent system architecture provides an in-novative design demonstrating the integration of ideas with high potential to con-tribute meaningfully to the evolving ecosystem of intrusion detection systems, the most important contribution is the developed network simulation environment. This environment supports not only the investigation of the subject multi agent system, but may be used for other network research investigations as well where the level of abstraction is suitable for the purpose.
II. Literature Review
Chapter I hinted at the range of threats to the productive use of Cyberspace. Fortunately, there exists a cadre of network security practitioners working unceasingly, evolving tools and techniques capable of beating back the binary barbarians. In this document we propose a new, composite approach that deals with one aspect of flow-based attacks. Specifically, it focuses on the challenge of recognizing 1) that a flow-based attack is taking place; and 2) the essential nature of the attack in order to summon the best response available. An innovative solution is designed and presented in Chapters IV and III. This chapter prepares for that presentation by discussing first the concepts and current research in critical areas germane to the flow-based attack classification system.
One of the foundations in network security research is the modeling of networks of interest. For example, modeling the Internet, that vast and ever-evolving network of networks, is itself the subject of a robust body of research and is discussed in Sec-tion 2.1. Pattern recogniSec-tion techniques are essential to automated identificaSec-tion of hostile network activity and are surveyed in Section 2.2; in particular, classification is discussed as a subtopic of pattern recognition. Section 2.9 comments on the statisti-cal evaluation of classification systems. The application of classification techniques to computer network intrusion detection results in an Intrusion Detection System (IDS). Section 2.3 reviews the features and architecture generally employed in these IDSes. Section 2.4 presents the multi agent system paradigm, which applies distributed arti-ficial intelligence to solve numerous problems, including problems affecting intrusion detection. The next three sections deal with the problem of making a complex system flexible and self-adaptive. Section 2.5 presents a methodology for examining system intervention points to identify where efforts should be most fruitful. Section 2.6 sur-veys the use of reputation as a means of improving individual and multi agent system
performance in uncertain or even hostile environments. Section 2.7 discusses the ideas and roles of evolutionary computation for identifying parameters that achieve ’good’ performance. Finally, the concepts of Self Organization and Emergence and their implications for multi agent systems handling network security functions is presented in Section 2.8.
With an understanding of these critical areas, one can better appreciate the design development in Chapters III and IV.
2.1 Internet Modeling
The Internet is a network with nodes that are themselves networks. Each such network consisting of routers and other networked devices under the same administra-tive control is called an Autonomous System (AS). The routers in each autonomous system that are responsible for forwarding/receiving traffic to/from other autonomous systems are gateway routers. This inter-autonomous system routing is handled via the Border Gateway Protocol (BGP). Though each AS may handle traffic internally in unique ways, all rely on BGP as the glue that binds the Internet together. See [95] for an overview of autonomous systems and BGP.
Clearly it is not appropriate to deploy untested defensive applications that operate at the AS level of the Internet. Testing and evaluation must be carried out via simulation, not only to reduce the operational impact on maintaining high levels of service, but also to provide a variety of controlled conditions for analysis of the system over a range of situations. Naturally we seek a balance between accuracy and efficiency when modeling the Internet. The two principle modeling aspects are
topology and traffic.
See [90] for an illustration of this modeling as well as a testing process for eval-uating DDoS countermeasures. We use different tools but a similar logical thought
process of seeking, in the first place, a simulation environment that captures the es-sential properties of the real-world domain of interest. With such an environment, we should have greater confidence in the performance evaluation of any system proposed for deployment on the real Internet.
2.1.1 Modeling Limitations.
Before surveying some of the ways in which the topology and traffic of the Inter-net have been modeled, it is important to appreciate the limitations of any model. Inasmuch as there are entities whose qualitative behaviors require representation in the simulation, ultimately one is dealing with qualitative simulation. As defined by Kuipers [94], qualitative simulation is the “prediction of the possible behaviors con-sistent with incomplete knowledge of the structure of the physical system.”
Some of the qualitative behaviors that require representation in our research in-clude the actions of malicious and benign users of the Internet, as well as the engi-neering decisions giving rise to observed network topologies.
Say and Akin [134] prove that no qualitative simulation is bothsound (“no trajec-tory which is the solution of a concrete equation matching the input can be missing from the output”) and complete (produces no spurious prediction for any particular input). The problem traces to the inherent incompleteness of mathematics itself1.
Despite this limitation, repeated refinement of the model allows development of a solution that handles most, if not all, practical input. Our modeling process, demon-strated over the two iterations discussed in Chapters IV and III, is inspired in part by Hildebrandt et al. [75], who advocate starting with a simple model and stepwise refining that model until arriving at the intended real system.
1Kurt G¨odel published proof in 1931 [62] that all formal systems sufficiently powerful to represent addition and multiplication of positive integers and zero (i.e. mathematics) include propositions which cannot be proved or disproved within the system.
With eyes thus opened, it is prudent to proceed to a discussion of the issues involved in Internet AS-level topology and traffic modeling.
2.1.2 Modeling Internet Topology.
In order to create a suitable environment for performance evaluation, one must take into account topological characteristics. As explained by Yook et al. [154], the performance of protocols designed for the Internet is greatly influenced by the network topology. “Protocols that work seamlessly on prototypes fail to scale up, being inefficient on the larger real network.” The real challenge to Internet topology modelers lies in capturing the dynamic characteristics that describe and predict how the topology will grow over time, thus allowing protocols to be evaluated against realistic predictions of the Internet several years into the future.
The early years of Internet topology modeling relied on random graphs ([26], [49]). Waxman’s model ([149]) created graphs probabilistically with respect to the Euclidean distance between nodes, and came to be one of the most popular network models. While it represented small early networks (e.g. ARPANET) successfully, the Internet grew in size and complexity, and the modeling of this “strange beast” needed an overhaul.
Doar recognized this [45] and advocated modeling of different hierarchical levels of networks (e.g. LAN, WAN, MAN). He worked with Calvert et al. to remedy the prevalent use of the Waxman model, which was not intended as a general purpose network topology model, but was designed specifically to compare Minimum Steiner Tree algorithms [30]. The remedy treats intranetwork connectivity separately from internetwork connectivity. Two topology generators resulting from this work are Tiers [45] and Transit-Stub [88], [157].
mod-eling. That year, Faloutsos et al. [52] discovered that the Internet is apparently a scale-free network with a law degree distribution. They provide three power-laws that characterize the inter-domain topology measurements derived from BGP routing tables collected in 1998:
• Rank exponent: the outdegree, dv, of a node v is proportional to the rank of the node,rv, to the power of a constant, R:
dv ∝rvR (1)
The rankrvof a nodev is the resulting sequence index when the nodes are sorted in decreasing order of outdegree. They found typical experimental results forR
to be approximately −0.8. In other words, they discovered a natural stability to the dominance ratio, in terms of outdegree, of nodes with higher outdegree to nodes with lower outdegree.
• Outdegree exponent: The frequency, fd, of an outdegree, d, is proportional to the outdegree to the power of a constant,O:
fd∝dO (2)
This describes the distribution of the outdegree of Internet nodes. Faloutsos et al. [52] measured values forO ranging from−2.2 to −2.15. Lower degrees are more frequent, which observation is quantified by this power-law.
• Eigen exponent: The eigenvalues, λi, of a graph are proportional to the order, i, to the power of a constant, ε:
These eigenvalues are calculated using the graph’s adjacency matrix. Faloutsos et al. [52] observed values of−0.47, −0.50, and −0.48, which they deem “prac-tically equal.” Despite the increase in the size of the Internet over 1998, the fact that the eigen exponent remained nearly constant suggests that it captures an essential property of the Internet that characterizes each of their samples.
At about the same time, Barab´asi and Albert published a paper [14] that came to be hugely influential the burgeoning field of network science. They observed power-law relationships for a wide variety of networks in fields ranging from computer science to molecular biology. Their claim: that, “independent of the system and the identity of its constituents, the probability P(k) that a vertex in the network interacts with k other vertices decays as a power-law, following P(k) ∼ k−λ.” This result called for a departure from existing network models to models that incorporate growth and preferential attachment, which came to be known as BA models.
Barab´asi and Albert (and later Crucitti et al.) then incorporated the Faloutsos results into a study of the attack tolerance of complex networks [4, 40], concluding that because the connectivity of the Internet’s AS-level architecture follows a power-law distribution, that it must be highly resilient to random attacks but vulnerable to attacks targeting select ‘core’ nodes. This is because most of the nodes in such a model have at most a handful of links, while a select few have most of the links.
Barab´asi later joined Yook to characterize the Interent further and demonstrate the inadequacy of existing topology models [154]. Eventually, BA models started popping up [29, 13, 108, 117, 153]. Efforts to refine the original BA model continue today as power-law-based Internet topology generators proliferate.
This power-law approach is not without its critics. Willinger is particularly stri-dent in his opposition [93, 151]. At issue: whether available measurements and their analysis and modeling efforts support the claims that are made by models based
on power-law node distributions / preferential attachment. Specifically, observe the following problems:
1. Making reliable measurements spanning multiple Internet service providers or autonomous systems is inherently problematic due to a lack of a central author-ity.
2. Making matters worse is that data sets originally collected for a specific research purpose are then used as primary sources in other research efforts.
3. Compounding this error is the subsequent use of statistical rigor beyond what the quality of available measurements justifies.
4. Finally, there is a problem with how model validation in networking research typically happens. Having arrived at a set of statistics that are already based on dubious sets of measurements, any models that demonstrate consistency with these statistics are declared valid. The problem is that, in many cases, alterna-tive models with a wide range of structure can also be produced with the same level of consistency, and no criteria is used to rule them out. Furthermore, it is rarely if ever the case that an independently-compiled dataset and a separate set of statistics are used for model validation.
Willinger’s opposition [93] to the Faloutsos brothers’ conclusions [52] with respect to the AS-level Internet topology involves all of these things. The datasets used in [52] came fromThe National Laboratory for Applied Network Research (NLANR), which constructed inferred AS connectivity maps by relying on full BGP routing tables collected by the Route Views Project at the University of Oregon. The purpose of this project: “to respond to interest on the part of operators in determining how the global routing system viewed their prefixes and/or AS space”. Yet ever since [52], the
resulting datasets have been used to infer Internet AS-level topology. Whether this is legitimate or not is impossible to decide given the lack of any relevant metadata for these datasets.
At best, all that can be concluded from the BGP-derived AS maps are “Pareto-type principles; that is, a small number of nodes have many neighbors, while most nodes are connected to only a small number of neighbors” [93].
What is advocated is that instead of using data fitting as the primary driver of model selection and validation, one should “rely on domain knowledge and exploit the details that matter when dealing with a highly engineered system such as the Internet” [151].
An interesting intersection of this proposed approach and the field’s persisting enthusiasm for power-law models is found in [50]. The authors successfully gener-ate topologies that exhibit the power-law relationships found in [52], but instead of the common, purely stochastic approach, these properties arise from a simple multi-objective optimization, involving “last mile” connection costs and transmission delays as measured in hops.
This model is known as Fabrikant-Koutsoupias-Papadimitriou (FKP) and cap-tures these two objectives in the following way. From [138], each node i arrives at a uniformly random point and attaches itself to the nodej that minimizes the weighted sum
minj<i{α·dij +ecc(j)} (4)
In this equation, dij is the Euclidean distance between the nodes and represents the “last mile cost.” The relative importance of this objective is controlled via the weight α. The second term is the eccentricity of j and captures the distance from j to the center.
Spatharis et al. present an updated treatment of FKP with several extensions [138]. One extension is the Controlled Distance (CD) Model. The goal of this ex-tension is to address the need for edges between nodes that are not quite leaves, nor particularly central, but are of intermediate centrality. As each nodeiis added to the network and linked to the node j according to equation 4, a second edge is attached fromj to another node k minimizing
mink{α·djk+ecc(k)} (5)
over all k such that the hop distance from j tok is at most a constant c.
This model decreases the power law exponent while having high average degree and several leaves. The authors of [138] declare this to be, in many ways, the “best performing” of their models in achieving similarity to the Internet’s AS graph. This model and various alternatives are packeged by the authors in the package TopGen.
Other topology generators include:
• Tiers [45]
• GT-ITM - Georgia Tech Internetwork Topology Models [30]
• Inet [153]
• nem [108]
• BRITE [117]
• GDTANG - Geographic Directed Tel Aviv University Network Generator [13]
• RealNet [37], [36]
RealNet is one of the more recent additions to this list. It relies on publicly available datasets including BGP tables and traceroute records, as did [52], but
ad-dresses some of the problems inherent in these datasets and does not attempt to fit specific power-law-based statistics. For example, it gives direct consideration to the IP-aliasing problem, whereby more routers may be inferred than actually exist be-cause each router has a different IP address for each of its interfaces. It also factors in likely policy relationships between neighboring autonomous systems.
In summary, while it is agreed that the AS-level topology of the Internet exhibits Pareto-type principles, the power-law approach to modeling the AS-level topology growth is by itself inadequate. An approach involving domain knowledge and an engineering mindset is preferred. The ideal topology modeling approach will appease both 1) the engineers responsible for implementing actual Internet topologies, as well as 2) the protocol and application developers seeking validation that their efforts will perform adequately on the Internet for at least several years. Currently, this ideal approach is elusive. In the meantime, FKP provides a reasonable balance; RealNet is intriguing but not available for the current research.
2.1.3 Modeling Internet Traffic.
Just as important as modeling topology is the modeling of the traffic that rides on it. The history of traffic modeling begins with Poisson distributions, and ends up with models that exhibit self-similarity [19]. As has been conjectured for the Internet’s topology, the Internet’s traffic has actually been shown with more statistical rigor to have certain scale-invariant statistics. The common adjective applied to Internet traffic is “bursty” - sharp peaks are observed in the volume of traffic no matter the time scale, which is not the case for Poisson distributions. One can set the rate λ of a Poisson process to emulate burstiness at a target time scale, but as the time scale is increased while λ is held constant, the peaks and troughs in activity flatten until they disappear altogether [152].
Frost and Melamed [57] provide some formalism geared for a Discrete Event Sim-ulation (DES) environment, in which events are modeled as happening at discrete time steps [12]. At a particular node, traffic is modeled as arriving in a sequence of arrival instants T1, T2, . . . , Tn, . . .. Equivalent representations include counting pro-cesses and interarrival time processes. A counting process is of the form {N(t)}∞
t=0,
where N(t) = max{n :Tn ≤t} is the number of traffic arrivals in the interval (0, t]. For the interarrival time process, {An}∞n=1, where An = Tn−Tn−1 is the length of
the time interval between the (n−1)th and the nth arrivals. Equivalence of these representations is: {N(t)≡n} ≡ {Tn≤t < Tn+1}= ( n X k=1 Ak ≤t < n+1 X k=1 Ak ) since Tn =Pnk=1Ak.
The amount of traffic arriving at the node at Tn is modeled as Bn, which is a member of the non-negative random sequence {Bn}∞n=1, stochastically independent
from{An}.
It is commonly the case in today’s context of high-bandwidth networks (as com-pared to 1994) that, across most nodes, one can assume a constant stream of traffic, particularly for the nodes of the AS-level graph of the Internet. In other words, An is usually 1. Let us consider how this situation may arise naturally from Frost and Melamed’s formulation. If{An} is generated for one timescale, then there is a “zoom out factor” for which one could generate {A0m} such that P(A0m = 1) is arbitrarily high, and it may be more useful to focus purely on the generation of {Bm0 }.
Let Ti represent an arrival time in the orginal time scale, and Tj0 represent an arrival time in a time scale zoomed out by a factor of λ. To simplify matters, we allowBj0 = 0. Then Tj0 =j, and
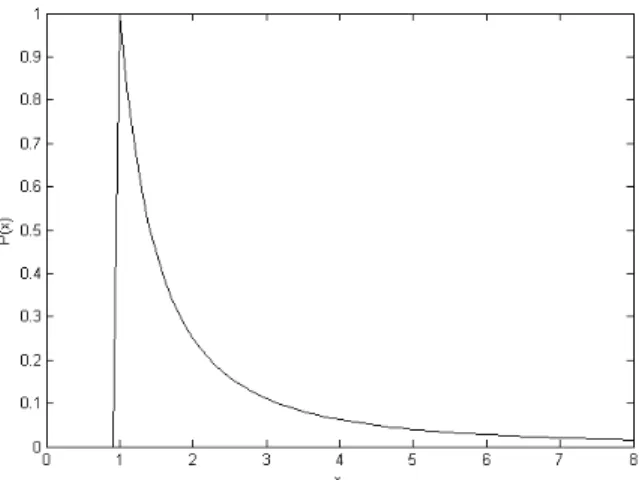
Figure 1. Probability density function for Pareto distribution,α= 1.0, b= 1.0 Bj0 = (λ+1)j X i=λj Bi
Frost and Melamed focus on the {An} representation and use it to describe a broad collection of traffic generation models, with varying emphasis on demonstrat-ing autocorrelation. This matters because of their explanation that “strong positive autocorrelations are a particularly major cause of burstiness.” Since bursty traffic is expected to dominate broadband networks, “models that capture the autocorrelated nature of traffic are essential for predicting the performance of emerging broadband networks” [57].
The Poisson model does not do this, and was only applied to Internet traffic in the first place because it had enjoyed decades of success describing telephonic traffic [152]. Ironically, this is akin to the misadventures in topology modeling described in Section 2.1.2, where datasets collected with one purpose in mind were commandeered for another. In [152], Willinger and Paxson are advocates of turning to better, fractal-like traffic distribution models. This is the same Willinger that today decries the use of power-laws to model Internet topology (see Section 2.1.2). It turns out that for traffic, the case for scale-invariance is much more justified.
The Pareto model exhibits scale-invariant behavior [63]. It has a density function P(X) = xαbα+1α , x ≥ b, which has a heavy tail [90]. Figure 1 shows an example for
α = 1.0, b = 1.0. Willinger and Paxson explain that this heavy tail accounts for the fractal nature of aggregated network traffic [152]. To generate a random Pareto-distributed sample, inverse transform sampling is used. Given a random variable U drawn from the uniform distribution (0,1), T given by
T = b
Uα1
(6) is Pareto-distributed [44].
This concludes discussion of network topology and traffic modeling. One could also consider models that generate workloads, which may be appropriate if the effects of traffic on servers are considered. An example effort to generate representative web workloads for network and server performance evaluation is presented in [15]. Also, one could model the spread of malicious traffic. For example, many models have been built for worm propogations, [35, 104, 147, 163, 164, 84, 135].
In any case, given a model, the next question to consider is how to implement the model for simulation. This is consequently the subject of the next section.
2.1.4 Discrete Event Simulation.
The preceding discussion illustrated the challenges particular to modeling the In-ternet’s topology and traffic, for the purpose of producing a “useable” simulation. By “useable”, we mean that applications tested under such a simulation generate behav-iors tolerably isomorphic to what is seen in a real-world operational environment.
This section focuses on the underlying simulation framework. Specifically, this section is about Discrete Event Simulation.
events, each of which occurs in an instant and changes the state in the system, possibly resulting in more events being scheduled. Comprehensive treatment of Discrete Event Simulation is given in [12].
Components of DES systems include:
• Clock - The simulation keeps track of current simulation time in appropriate measurement units, but unlike in real time simulations, time in a DES jumps from one instantaneous event to the next.
• Schedule - The set of events to handle, typically implemented as a priority queue sorted by event time.
• Random-Number Generator - pseudorandom, which is desired in order to sup-port a rerun of a simulation with exactly the same behavior
Typical usage of a DES includes the gathering of statistics, for which facilities may be provided, and the specification of a stopping condition. As may be the case with continuous- but not real-time simulation, a discrete event simulation runs at a rate that is not tied to the real-world clock. When resources permit, simulations may be run potentially much faster than real time, which is useful for collecting large amounts of statistics. In other cases, it may be desired that simulations run much slower than real time, perhaps paused for an extensive period of time via checkpointing, which is useful for direct observation and analysis of system dynamics.
Parallelization of DES is discussed extensively in [58]. More recently, Park and Fishwick present their work using graphics processing unit-based clusters in [125].
2.1.4.1 Popular DES Engines.
Some of the more well-known DES options and their areas of emphasis are:
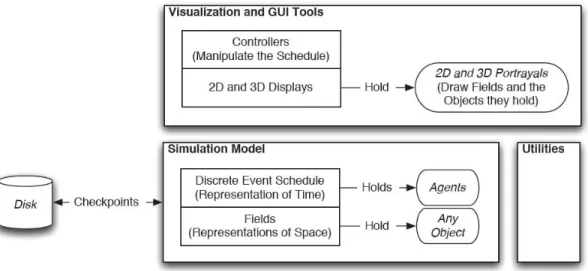
Figure 2. Basic elements of the MASON model and visualization layers
• MASON, [106]: agent-based systems simulation
• CNET, [114, 113]: network simulation
• GloMoSim, [158]: large-scale wireless networks
• ns2, [112]: network simulation
• PARSEC, [11]: parallelization
2.1.4.2 MASON Overview.
MASON, developed at George Mason University and presented in [106], is ‘a single-process DES core and visualization toolkit written in Java’. It is flexible enough that it can be used for a wide range of simulations, but emphasizes sup-port for “swarm” simulations with up to millions of agents. It is fast and sup-portable and produces guaranteed replicable results, courtesy of checkpointing facilities.
The underlying model runs in a layer independent of the visualization layer. Thus, while the visualization facilities enable easy interaction with simulations, simulations may run without visualization, or the visualization can be changed at will, perhaps
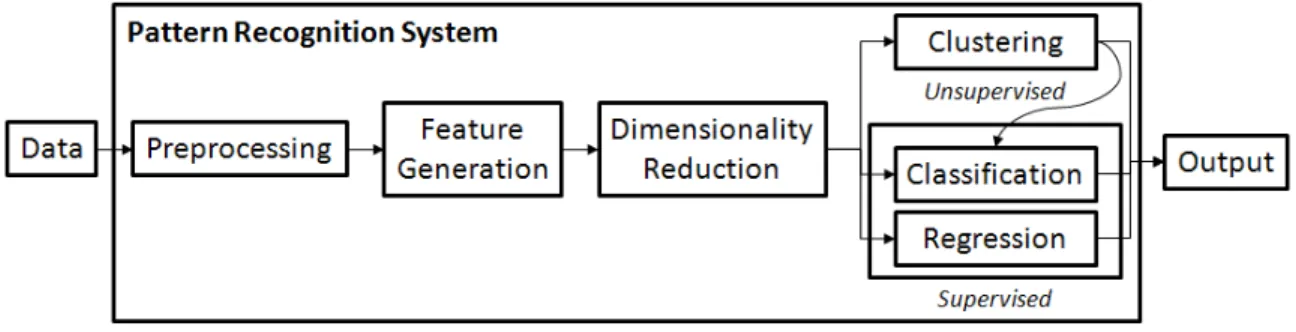
Figure 3. A general perspective of a pattern recognition system
according to the preferences of the observer. The basic elements of the MASON model and visualization layers are presented in Figure 2.
MASON has been used successfully for applications ranging from physics demon-strations to cooperative target observation in unmanned aerial vehicles to the testing of ant foraging algorithms.
2.2 Pattern Recognition
The preceding sections have laid the groundwork for a simulation framework that will adequately reflect the contested domain of the Internet. Ultimately, the purpose of the present research is to automate the detection and classification of malicious network activity. If the classification is accurate, precise, and timely, the malicious activity may be counteracted.
The fact that legitimate traffic has been characterized as ‘bursty’ lends confidence to the idea that deviations from the emergent features of legitimate, bursty internet traffic may reveal the presence of anomalous (and potentially malicious) traffic, using techniques from the broad field ofpattern recognition.
Authoritative texts on pattern recognition include [46], [74], and [24]. A general description of a pattern recognition system includes the elements depicted in Fig. 3. We generally rely on the notation found in [74] in the following discussion.
noise or some system or environmental anomaly.
Feature generation, sometimes referred to asfeature extraction, is the transforma-tion of raw data into derived data points that may facilitate the characterizatransforma-tion of the observed process. One can even use the raw data itself for feature measurements. Commonly, features are statistical measurements of the raw data or may be the re-sult of passing the raw data through a mathematical transformation (e.g. Fourier coefficients of a signal or wavelet coefficients of some image). The feature or vector of features is represented as X. If X is a vector, it has p elements, and components are accessed via subscripts Xj.
Dimensionality reduction, or feature selection, filters the available features with the premise that not all features are useful. In fact, some features may even be harmful (misleading). Even if all features are useful, resource limitations, in terms of computation, bandwidth, or storage, may require filtering the least beneficial in-formation prior to performing clustering, classification, or regression. The feature selection vector may be represented as~σ∈ {0,1}p.
Clustering, classification, and regression represent the three fundamental prob-lems of pattern recognition, one or more of which must be addressed by any pattern recognition system.
Clustering seeks to identify the natural groupings of the data. This effort can involve considerable subjectivity. Typically, the number of groupings or clusters is not known beforehand. The solution is to either simply specify the desired number of clusters and evaluate the resulting cluster assignments, or define some distance-based threshold from which the number of clusters is derived.
values of the jth attribute. Then D(xi, xi0), p X j=1 wj ·dj(xij, xi0j); p X j=1 wj = 1.
is the dissimilarity between objectsi andi0 given the inputsxi, xi0 and weight vector w. Usually, dj(xij, xi0j) = (xij−xi0j)2, but other choices are possible, or even required in the case of nonquantitative attributes [74].
Clustering is the search for an encoder C(i) that assigns the ith ofN observations to one of K clusters. An encoder may be evaluated by measuring the between-class scatter to within-class scatter ratio, WB((CC)). Between-class scatter is defined as
B(C), 1 2 K X k=1 X C(i)=k X C(i0)6=k d(xi, xi0)
while within-class scatter is
W(C), 1 2 K X k=1 X C(i)=k X C(i0)=k d(xi, xi0)
We desire high WB((CC)) in order to achieve the goal of high between-class scatter and low within-class scatter, thus establishing clusters with well-defined boundaries [74].
Classification is a process that assigns one of a discrete number of labels to each data point (input vector). Ais the ‘true’ output and takes values from the setA. The classifier is ˆA and should also take values from A. Regression seeks to model some continuous process (function). The output of the function being modeled is denoted Y and takes values from some continuous set, such as R, and a predictor for Y is ˆY [74].
Unlike the unsupervised learning technique of clustering, classification and re-gression as supervised learning techniques require training data in which inputs are
associated with known output (e.g. the ‘correct’ label or value corresponding to each sample in the training data). Based on the specific classification or regression tech-nique selected by the system designer, the system derives the necessary parameter values for a process that reliably transforms the training input into the desired output. This notion is formalized as the minimization of Expected Prediction Error (EPE):
EPE,E[L(A,Aˆ(X))] (7)
L is a loss function, and expectation is taken with respect to the joint distribution P(A, X). With K = |A| classes, the loss function may be represented as a K ×K matrixL. This loss matrix has values of zero on the diagonal. Everywhere else, a non-zero valueL(k, l) indicates the penalty for misclassifying an observation as belonging toAl when it actually belonged to Ak.
Hastie et al. [74] show that by conditioning on X, we can rewrite 7:
EPE = EX K X
k=1
L[Ak,Aˆ(X)]P(Ak|X) (8)
When the loss function iszero-one, meaning that a single unit penalty is assessed for any misclassification, the intuitive guidance for ˆA(X) is:
ˆ
A(X) =Ak if P(Ak|X=x) = max
a∈A P(a|X =x) (9)
In other words, the classification output should be the most probable class given the input (Bayes classifier). Naturally, what makes this difficult is the fact that one has to estimate the probabilities using a limited set of data.
Kotsiantis reviews several of the more popular classification techniques [91]. One of these is the Support Vector Machine (SVM), which is used in this research. For
mathematical details, the reader is referred to [91, 143] and [74], but the idea is to find the hyperplane that separates the training data with the maximum margin - the distance on either side to the nearest samples.
The SVM is preferred in our current research due to its high generalization per-formance without the need to add a priori knowledge, even in the presence of many features in the input space [34].
The first iteration of our research employs a simpler technique known as the Minimum Distance Classifier (MDC) [56]:
ˆ
A(x) = minak∈Akx−a
0
kk (10)
wherea0k is theprototypeorsample class mean of classAk. That is, for 1≤j ≤p, and given a sample setX,a0kj is the arithmetic mean of valuesxj for allx∈X|A(x) =Ak. The MDC technique is very simple and works well when the distance between class means is greater than the typical variance within each class [56].
Regardless of the technique, one of the issues confronting the designer of a pattern recognition system is how to avoid overfitting, or ‘fitting to the noise.’ The wrong approach to training the system can result in a system that performs well on the training data but performs poorly on other data sets, demonstrating a lack of general applicability. Two contributing aspects of this are bias and variance. Bias marks the difference between the sample mean and the true mean, and variance is simply the measure of variability in the sample set. Large training and validation sets that accurately represent the target domain can address all of these issues, but obtaining sufficient data may be prohibitively expensive or otherwise impossible. Thus, ingenu-ity in compensatory techniques may be required if it is desired to accurately predict the error of a proposed classifier.
the data into K roughly equal-sized parts. For each of K rounds, one of these parts is set aside for validation while the rest are involved in training or fitting the model. The errors from all rounds are combined for the final cross-validation estimate of the prediction error. Specifically,
CV(ˆa), 1 N N X i=1 L(ai,ˆa−κ(i)(xi))
where ˆa is the fitted classifier, N is the number of samples available, L is the loss function as before, andκis an indexing function that indicates the partition to which a given observation is allocated for the purposes of this cross-validation technique. The term ˆa−k(x) denotes the fitted classifier trained with all but the kth partition of the data [74].
The choice of K is reflective of the bias-variance tradeoff that is so common in pattern recognition: higher K (maximum value is N) yields lower bias for the true prediction error, but higher variance. Common values of K are five and ten [74].
If one wishes simply to determine the optimum ratio of training set to validation set, Guyon gives the following guideline [67]: let the ratio of the validation set size over the training set size scale like the square root of the complexity of the second level of inference (minimizing the validation error) over the complexity of the second level of inference (minimizing the error rate on the training set).
2.2.1 Feature Selection.
As noted by Gates at al. in [66], the three principle objectives of feature selection are: 1) improving prediction performance; 2) enabling faster, more efficient prediction; and 3) providing a better understanding of the underlying process that generated the data.
prediction performance is that it directly confronts the curse of dimensionality [22]. Hastie et al. [74] examine some of the many manifestations of this problem. Es-sentially, such manifestations arise from the fact that in order to maintain the same sampling density enjoyed in a lower dimension, the number of samples must increase exponentially as one moves to higher dimensions. Usually, the number of samples practically attainable is far fewer than necessary to maintain the desired sampling density. Some of the consequences of sparse sampling in high dimensions are:
• Techniques that rely on information gleaned from local neighborhoods (e.g. k -nearest neighbors) break down. In low dimensions, it may be possible to form local neighborhoods that cover some percentage of the sample population. But if one desires to cover the same percentage in high dimensions, the neighborhood ends up covering most of the range of each input variable and is no longer local. If instead the imperative is to strive for truly local neighborhoods in high dimensions, the number of samples involved in the characterization of each neighborhood shrinks and variance jumps.
• All sample points are close to an edge of the sample space. This makes interpo-lation impossible. One must extrapolate from neighboring sample points, which results in predictions with much greater uncertainty.
These issues motivate a focus on a reasonably-sized subset of the available features. Finding the optimal subset, however, is known to be NP-hard [5]. Consequently, feature selection techniques typically involve heuristics that lead to “good” quality feature subsets in a reasonable amount of time (i.e. polynomial in the number of features).
Feature selection techniques are typically categorized as filter, wrapper, or embed-ded methods, discussed respectively in Sections 2.2.1.1, 2.2.1.2, and 2.2.1.3.
2.2.1.1 Filter Methods.
A filter method typically involves some notion of feature ranking independent of the choice of the predictor. This is computationally efficient because it requires only the computation of p scores and sorting the scores. It introduces bias but may have considerably less variance compared to other methods and is therefore robust against overfitting [66, 74]. Feature ranking methods include analyzing performance as a single variable classifier and information theoretic ranking criteria.
These filter techniques can be useful but also incur limitations. The underlying assumption is that variable dependencies can be ignored, but in practice, this is not always the case. Guyon and Elisseeff [66] provide examples in response to three probing questions:
1. Can presumably redundant variables help each other? (yes; independently and identically distributed variables are not truly redundant)
2. How does correlation impact variable redundancy? (Perfectly correlated ables are truly redundant and provide no performance gain, but very high vari-able correlation or anti-correlation does not mean absence of varivari-able comple-mentarity.)
3. Can a variable that is useless by itself be useful with others? (Yes. In fact, even two variables that are useless by themselves may be very useful together.)
Methods that score variables individually and independently of each other are at a loss to determine which combination of variables would give the best performance. Nevertheless, for combining computational efficiency with reasonable performance, as well as general applicability across a range of classification algorithms, filter methods can work well in practice.
![Table 1. Characteristics of multi-objective metaheuristics frameworks (from [103])](https://thumb-us.123doks.com/thumbv2/123dok_us/441675.2551096/67.918.182.732.141.256/table-characteristics-multi-objective-metaheuristics-frameworks.webp)