General Technical Report PNW-GTR-243 September 1989 Pacific Northwest Research Station
Sampling Methods
for Bats
Donald W. Thomas and Stephen D. West
United StatesDepartment of Agriculture
Forest Service
This file was created by scanning the printed publication.
Text errors identified by the software have been corrected;
Wildlife-Habitat Relationships:
Sampling Procedures for
Pacific Northwest Vertebrates
Andrew B. Carey and Leonard F. Ruggiero, Technical Editors
Sampling Methods for Bats
Donald W. Thomas
Assistant ProfessorGroupe de Recherché en Écologié, Nutrition, et Énergetique Département de Biologie Université de Sherbrooke Sherbrooke, Québec
Steven D. West
Associate Professor Wildlife Science Group College of Forest Resources University of Washington Seattle, WashingtonUSDA Forest Service
Pacific Northwest Research Station Portland, Oregon
General Technical Report PNW-GTR-243 1989
Preface
Concern about the value of old-growth Douglas-fir forests to wildlife in the Pacific Northwest began escalating in the late 1970's. The available information on wildlife-habitat relationships suggested that as many as 75 species including amphibians, birds, and mammals, could be dependent on old-growth forests. The USDA Forest Service chartered the Old-Growth Forest Wildlife Habitat Program to investigate the role old growth plays in maintaining viable populations of wildlife. It was apparent that broad surveys of vertebrate communities would be necessary to determine which species were truly closely associated with old-growth forests. Insufficient guidance on techniques, procedures, and sample sizes was available in the existing literature. We assembled a team of researchers from universities and Federal agencies to conduct pilot studies to develop sampling protocols and to test the basic experimental design for contrasting the wildlife values of young, mature, and old-growth forests. The sampling protocols resulting from the pilot studies were implemented in 1984-86 across broad areas of the Cascade Range in southwestern Washington and in Oregon, the Oregon Coast Ranges, and the Klamath Mountains of southwestern Oregon and northern California. Naturally, improvements were made to the protocols as time passed. A tremendous amount of experience in sampling was gained.
Our goal in this series is to compile the extensive experiences of our collaborators into a collection of methodology papers providing biologists with pilot study-type information for planning research or monitoring populations. The series will include papers on sampling bats, aquatic amphibians, terrestrial amphibians, forest-floor mammals, small forest birds, and arboreal rodents, as well as papers on using telemetry for spotted owls studies and a guide to bird calls.
Andrew B. Carey Leonard F. Ruggiero
Abstract
Thomas, Donald W.; West, Steven D. 1989. Sampling methods for bats. Gen. Tech. Rep. PNW-GTR-243. Portland, OR: U.S. Department of Agriculture, Forest Service, Pacific Northwest Research Station. 20 p. (Ruggiero, Leonard F.; Carey, Andrew B., tech. eds.; Wildlife-habitat relationships: sampling procedures for Pacific Northwest vertebrates).Bats represent the second most diverse group of mammals inhabiting the western slopes of the Cascade Range in southern Washington and the Oregon Coast Range. Bat populations may well be sensitive to changes in forest age, structure, or distribution, but their nocturnal habits and high mobility render the study of the habitat requirements of bats problematical. Unlike most other groups of vertebrates, bats are difficult to either observe or capture, and survey methods are poorly known. This paper reviews techniques for surveying bat populations and presents the methodology used in the Old-Growth Forest Wildlife Habitat Program in the Pacific Northwest.
Keywords: Bats, Chiroptera, distribution, abundance, habitat use, surveys, sampling methods, ultrasonic detection.
Introduction
As land development and exploitation become more widespread and severe, the con-current changes in vegetation cannot help but affect animal populations. It becomes increasingly important to know what specific habitats or biotic and structural features in habitats are important for maintaining particular animal populations. One group of animals that may be sensitive to environmental modifications is the bats. In North America, two species of bats are currently on the Federal list of endangered species(Myotis griscecens and M.sodalis), and at least two other species have already suf-fered severe population declines Leptonycteris sanborni and Plecotus townsendii)
(Howell and Roth 1981, Perkins 1985).
In the Pacific Northwest, 12 species of bats (including P. townsendii) occur on the western slopes of the Cascade Range and in the Klamath and Siskiyou Mountains (table 1), making this group second only to the rodents in importance as measured by species diversity. If previous population declines indicate that bats may be sen- sitive to habitat destruction, it is important to examine how current large-scale land use patterns, such as forest harvesting, may affect their populations. Forest exploita- tion may drastically or subtly alter habitat features important to bats. Clearcut logging practices, for instance, may entirely remove certain forest types locally or regionally (for example, old-growth stands of Douglas-fir, Pseudotsuga menziesii (Mirb.) Franco). High-grading (removing specific sizes and species) may alter the species composition or structure of the live communities in relatively intact stands. Intensive stand management may alter age composition and snag abundance, thus affecting the live tree communities or the standing dead (snags), or both. To assess the impact of land use practices on bat populations and moderate any observed effects, techniques must be available to monitor these populations. Such techniques might allow us to pose questions at four levels of complexity:
(1) Are any species affected by habitat changes and, if so, which species? (2) What is the degree of impact on a given species––extirpation or population reduction? (3) What changes in the environment are correlated with the observed changes in bat populations? (4) What steps will reverse the population trends or minimize future impacts?
In this paper, we provide an overview of the techniques available for monitoring bat populations in specified habitats or vegetation types (for example, forest blocks of a specified age and species composition). We also provide a detailed description of the techniques and equipment selected and applied in the USDA Forest Service Old-Growth Wildlife Habitat Program in Washington and Oregon. A separate review of bat survey and census methods (Thomas and LaVal 1988) may prove complementary, but it approaches the topic from a different perspective. It focuses on methods appropriate to monitoring bats where they are known to occur in abundance rather than in habitats where there may be no prior knowledge of bat abundance.
Levels of Precision in
Bat Monitoring
Table 1––Characteristics of the echolocation calls of bats in the Pacific Northwest
Species Echolocation call form
Eptesicus fuscus
Myotis thysanodes Call sweeps down to 28-33 kHz in first 1-3 milli- seconds, terminating in a nearly constant-frequency tail lasting 2-7 milliseconds. Initial sweep is variable, but nearly always present.
M. californicus
M. ciliolabrum
M. evotis
M. septentrionalis
Short, straight sweep from >60 kHz to ca. 40kHz. Call lasts 1-3 milliseconds and has no constant-frequency tail.
M. lucifugus
M. yumanensis Curved sweep from >60 kHz to ca. 40 kHz, lasting about 5 milliseconds. Inflection point near the middle of the call.
M. volans Sweep from >60 kHz to ca. 35 kHz in about 5 millisec-
onds. Call has no inflection point.
Lasionycteris noctivagans Call begins with a short (1-2 millisecond) sweep from >30 kHz to 25-28 kHz and ends with a long (10-14 milli-
second) constant-frequency tail. Initial sweep may be absent.
Lasiurus cinereus Similar to L. noctivagans, but 3-5 kHz lower in frequency.
Plecotus townsendii Straight sweep from 40 kHz to ca. 28 kHz, lasting 6-7 milliseconds. No sign of an inflection point in call.
Measures of bat abundance fall into two major categories. They may be relative and quantitative and provide a response to such questions as, Does habitat A have more bats of a given species than habitat B does? or Is species X more abundant before or after a modification to habitat Y? Alternatively, measures of abundance may be ab-solute and quantitative and respond to such questions as, How many individuals of species X occur in habitat Z ? Methods providing qualitative results are termed surveys; those providing quantitative results are censuses. All methods currently available for monitoring bats from a habitat perspective are surveys.
In ideal situations, census methods are clearly preferable because they can provide the data base allowing detailed species management; for example, numerical estimates of population size are necessary to manage for minimum viable populations (Lehmkuhl 1984). Both survey and census results, if interpreted properly, can provide answers to the four types of questions outlined above.
Bat Ecology
A detailed review of bat ecology is beyond the scope of this paper, and we direct readers to several review books and their references for details (Barbour and Davis 1969; Fenton 1985; Kunz 1982b; Wimsatt 1970, 1977). A brief overview of certain features of bat ecology is necessary, however, to understand the arguments for, and problems with, bat-monitoring methods.In the Pacific Northwest, as in most of temperate North America, all bat species are insectivorous. They may be grouped into two general types: cavity-roosting colonial species and foliage-roosting solitary species.
Cavity-roosting colonial species make use of a wide variety of natural and artificial cavities including spaces behind exfoliated bark, natural or excavated cavities in trees, spaces in buildings and other structures, and caves and mines. These species may be only mildly colonial (forming groups of two to tens of individuals) or highly gregarious (forming groups of hundreds to thousands of individuals) (Barbour and Davis 1969, Kunz 1982b). During pregnancy and lactation, females maintain body tem-peratures well above ambient during the day to maximize fetal growth rates (Racey 1982). For this reason, reproductive females generally group together during the summer months to benefit from the thermoregulatory savings of clustering (Kunz 1982b, Racey 1982). These groups are called maternity colonies. In contrast with the female pattern, males apparently do not maintain high body temperatures during the day, but rather undergo 24-hour cycles of daily torpor and nightly activity. 1 Because they do not main-tain a large gradient between body and ambient temperatures, males cannot benefit from clustering and so are typically solitary and possibly vagrant. Little is know about their summer ecology. In fall when the young are weaned, many cavity-roosting colonial species migrate locally or regionally to caves and mines in search of micro-climates of high humidity and low temperatures (above freezing) for hibernation (Davis 1970, Fenton 1970). Some species (for example, Eptesicus fuscus;
Brigham 1987) use buildings for hibernation in some areas, and it is quite possible, at lower elevations in the Pacific Northwest where winter temperatures are not usually severe, that some species use tree cavities for hibernation.
Foliage-roosting solitary species (Lasiurus cinereus and Lasionycteris noctivagans)
generally do not exploit cavities but roost in fixed or shifting locations in tree foliage (Barclay 1984). Females give birth and rear their young at these sites, but little is known about their summer ecology. Both Lasiurus cinereus and Lasionycteris noctivagans
seem to migrate south in winter, but the locations of wintering populations are poorly known (Findley and Jones 1964, Kunz 1982a).
1 Since writing this paper, new data are available on the metabolic rates and body temperatures of male little brown bats (Myotis lucifugus; Kurta, A.; Kunz, TH.; 1988. Journal of Mammalogy. 69: 645-651) that suggest males may not be as thermolabile as we indicated. The effect of male thermoregulatory strategies on their choice of roosts has yet to be clarified.
Bat Survey and
Census Methods
Monitoring at Roosts
Insectivorous bats of both groups use echolocation while commuting and while locating and catching prey (but see Bell 1982). Echolocating individuals emit structured signals that generally sweep from high to low frequency in the 100 kHz to 20 kHz (ultrasonic) band (Simmons and others 1979), although at least one species (Euderma maculatum,
not present on the west slope of the Cascades) may sweep down into the band audi- ble to the unaided human ear (Leonard and Fenton 1984). When commuting or searching for prey, bats emit echolocation signals at the "low" rate of ca. 10 pulses/ second. When a prey item is detected and a bat closes for capture, it typically boosts the echolocation pulse repetition rate to ca. 100/second in what is termed a "feeding buzz." In the Pacific Northwest, probably all species employ high-intensity (loud) echo-location signals. The precise frequency and time structure (shape) of these signals is often, but not always, species specific (Fenton and Bell 1981, Thomas and others 1987). Characteristics of echolocation calls provide an important way to detect bat activity and will be dealt with in detail below.
Although several survey and census methods have been applied to bat studies in areas outside the Pacific Northwest, a literature search (see Thomas and LaVal 1988) does not reveal many that are appropriate to an inventory of bats by habitat. Few researchers have addressed questions such as, What is the relative or absolute abundance of a given species in habitat A vs. habitat B ? Before we describe the techniques used in the Old-Growth Wildlife Habitat Program, we will outline methods used elsewhere and why they were inappropriate for this study.
The majority of monitoring studies have focused on known bat roosts. Whether roosts are located in trees, buildings, caves, or other confined sites, bats typically exit by only one or a limited number of routes. This permits the visual counting of individuals or, potentially, electronic counting by using photoelectric beam splitters or ultrasonic detectors. Counts at these sites can be accurate. Using visual counts, Swift (1980) obtained as little as 0.5-percent variation in counts at one colony over successive weeks. These counts are labor intensive, however, and must necessarily be confined to known roosts. To progress from single-colony counts to an evaluation of bat popula-tions in a habitat or region, it is necessary to know (1) the number of roosts occurring within the bounds of the study area; (2) the daily, weekly, and seasonal foraging range of individuals from each roost (that is, How does the study area size compare to home range size?); and (3) the temporary immigration rate from colonies outside the study area. Adding these levels of information would be difficult and extremely labor intensive. In two summers of bat studies in Washington and Oregon involving hundreds of staff-days in the field, no roosts for any bat species were located in the study
plots. Even if large, relatively conspicuous colonies could be located, they would not provide data on the abundance of solitary males nor any evaluation of home range size. No current technology (radio tags, chemiluminescent capsules) will allow the close moni-toring of the movements of 5- to 1 a-gram bats over long distances in mountainous terrain at night (see Kunz 1988 for a review of techniques).
In only one study has a roost-oriented census been applied to population estimates for a habitat. Gaislerand others (1979) attempted to locate and capture all individuals of the hole-roosting species Nyctalus noctula in Czechoslovakia. Because the sex and age composition of their sample suggested that some individuals had not been account-ed for, they were forcaccount-ed to adjust their figures to establish theoretical population
estimates. These theoretical estimates differed from the actual captures by as much as 100 percent, which underlined the inherent problems with this approach.
Visual Strip Counts or Equivalents
Collecting and Direct Captures
Strip and variable circular plot counts have commonly been applied to bird studies, but in only one case have they been used with bats (Gaisler 1979). In Gaisler's study, visual identification of three bat species was based on size in an open-sky (city) habitat. Observers moving along fixed routes recorded bat sightings during the first 30 minutes after dusk. Gaisler (1979) applied these counts to population density estimates, but acknowledged that one size was more easily detected than the others. To make final density estimates, he adjusted sightings by an undescribed method. In visual counts, the detection distance is likely dependent on bat size, flight levels, and light intensity, so effective strip widths must differ between species, over time within a sample, and among samples. Accurate measurements of the distance from the observer to bat are required for the subsequent calculation of effective sampling volumes. Without these, no meaningful density estimates can be made (see Ralph and Scott 1981). This approach is unlikely to be of value in closed-canopy, high tree-density environments. Under the right conditions, bats can be collected by using shotguns and dust shot. Such drastic "sampling" techniques have occasionally been used to suggest habitat prefer-ences (see for example, Whitaker and others 1977,1981). Collecting is feasible, however, only where lighting conditions permit sightings and bat flight levels are relatively low. This necessarily biases the sampling effort towards open habitats, often forest and stream and pond edges: results are therefore impossible to interpret. The question always remains whether the bats were truly less abundant in a given area or merely less visible.
Mist nets and specialized Tuttle traps (Tuttle 1974) can frequently be used to capture large numbers of bats. Because of these large samples, many biologists believe that hands-on methods can provide reliable indices of bat activity or abundance at the netting site. Surprisingly, no one has done an evaluation of the inherent problems associated with using nets and traps to surveyor census bats (but see Bell 1980). We are forced to rely on personal experience and discussions to present the following argument.
There are good reasons to believe that captures cannot provide a reliable index of bat activity or abundance at one site or a comparison of relative activity levels or abun-dances among several sites. Where bats commute down habitual flyways, such as paths, gaps in vegetation, or constrictions imposed by bridges, they seem highly prone to capture if they fly at net height. In these situations, they may be familiar with the obstacles in the flyway and, although echolocating, are paying little attention to the weak echoes off nets or traps. At feeding sites, however, individuals are searching for the weak echoes from insect prey in the airspace before them, and they can readily detect and identify nets and traps as obstacles. Although at times large numbers of bats can be caught where they are clearly feeding, the proportion of individuals present that are caught is certainly low. Anyone netting bats over a pond has experienced the frustration of seeing what appear to be large numbers of feeding individuals while catch-ing only a few or none. At the same time, bats seem to be capture-prone at habitual drinking sites, especially in dry environments. Kunz and Brock (1975) found that nets produce similar results to ultrasonic detectors at a drinking site, but this cannot be used to infer that results would be similar at feeding sites (Bell 1980). Based on this, we feel that capture methods have site biases and capture data cannot provide unequivo- cal information on the distribution of bats among various sites or habitats.
Ultrasonic
Detectors
As outlined above, commuting and foraging insectivorous bats emit a steady stream of echolocation calls that aid them in navigation and locating and capturing prey. These calls betray the bat's presence, however, and a wide variety of nocturnal insects have evolved functional ears enabling them to detect and evade foraging bats (Fenton and Fullard 1981). By eavesdropping on these same calls with the appropriate ultrasonic detection equipment, biologists are similarly able to detect echolocating bats without interfering with their normal activities. This method avoids many of the problems and biases associated with roost-oriented techniques or those requiring visual sightings or captures.Echolocating bats emit signals that may be dominated by constant-frequency compo-nents or may sweep through a narrow or wide range of frequencies (Simmons and others 1979a, 1979b). These signals may contain only a fundamental frequency or may include one or more harmonics. The duration of the low-repetition rate "cruising" pulses is typically between 2 and 15 milliseconds. Together these characteristics define the frequency-time pattern or shape of the echolocation calls at the source, the bat's mouth. Although the echolocation calls of only a few bats have been character-ized, it is clear that many (but not all) species use discrete and unique frequency-time patterns (for example, Bell 1980, Fenton and Bell 1981, Fenton and others 1983; but see Thomas and others 1987). Echolocation calls will permit the identification of many species as they fly within range of an ultrasonic microphone. Three types of information are thus potentially available: (1) the presence or absence of echolocating bats without regard to the detailed characteristics of their calls, (2) the species identity of detected bats, and (3) the presence or absence of feeding activity as indicated by high-repetition-rate feeding buzzes interspersed with the low-repetition-rate cruising calls. In real situations, the information available depends on the equipment used to detect bats and the degree of modification of the echolocation calls as they pass through air over various distances.
Equipment––A variety of ultrasonic detectors are commercially available or they can be constructed relatively easily. The information they can extract from echolocation calls depends on their degree of electronic sophistication and––alas––their price. The simplest form of detector (the "leak" detector; Simmons and others 1979a) uses a microphone sensitive to ultrasonic signals and a circuit that emits a click output when it receives a 45-kHz input. Any echolocation or other signal that includes a 45-kHz component can be detected, but this equipment provides no information on any other frequencies. Thus, the presence and feeding activity of 45-kHz bats can be detected, but species cannot be identified.
Tunable narrow band or heterodyne detectors (for example, QMC Mini;2 see Simmons and others 1979a, Thomas and West 1984) rely on an internally generated pure tone that is superimposed on the inaudible ultrasonic signal to generate an audible beat frequency. By tuning the internal frequency, these detectors can scan a range of frequencies, but provide information on only a narrow "window" at one time. Tuned to 2 The use of trade, firm, or corporation names in this publication is for the information
and convenience of the reader. Such use does not constitute an official endorsement or approval by the U.S. Department of Agriculture of any product or service to the exclusion of others that may be suitable.
45 kHz or any other frequency, these detectors function as leak detectors. Any bat
species sweeping out of the frequency range of other bats (for example, one incorporating a 25-kHz component when other bats are using higher frequencies) can be detected and identified by tuning to that frequency. A degree of species identification is thus provided, but the separation of all species in a complex community cannot be done. Divide-by-n detectors couple a broad-band microphone with a circuit that divides the input frequencies by n. With a suitable divisor (usually n =10), ultrasonic signals are rendered audible. A sweep of 100-40 kHz becomes 10-4 kHz at the output. These low-frequency outputs can be interpreted by ear or recorded on low-speed (4.8-9.5 centi- meters/second) tape recorders for later analysis. Simple divide-by-10 detectors can be built from circuit diagrams (Miller and Andersen 1984, Paige and others 1985). The electronic transformation of the echolocation signal in this design results in the loss of all amplitude and harmonic frequency information. Only the fundamental frequen- cies and time characteristics are retained. Commercial varieties that retain the amplitude and harmonic structure of the calls and have a variety of extra features are available. Analysis of divided echolocation calls stored on tape can be done by using either a zero-crossing period-meter or a sophisticated sound-spectrum analyzer (Simmons and others 1979b). The period-meter provides a visual display of frequency and time (the shape) of fundamental frequencies of the echolocation calls on an oscilloscope screen, again losing any amplitude or harmonic details. Sound-spectrum analyzers can permit the analysis of these latter features if they are retained in the original record-ings. The divide-by-n system allows for the monitoring of bat presence, species identity, and feeding activity.
Finally, a broad-band microphone coupled directly to a high-speed tape recorder (76 centimeters/second) can record all the information available in the echolocation signals as they are received at the microphone (fundamental frequencies and
harmonics, amplitude, and time). These signals can be analyzed by using a period-meter or sound-spectrum analyzer.
Approximate costs of the systems are as follows: Leak and heterodyne detectors––<$200 Divide-by-n detector and period-meter: Commercial––<$3,000
Homemade––<$1,000
Broad-band microphone and high-speed tape recorder and sound-spectrum analyzer––>$20,000.
Echolocation signals in air--As echolocation signals radiate out from a bat's mouth, the overall amplitude of the sound declines by the square of the distance. If all frequen-cies were attenuated equally, all the original information in the signal would be retained at any distance. But humid air causes additional power loss, and higher frequencies are attenuated more than lower frequencies (Griffin 1971). Power loss (attenuation) is an exponential function of frequency; increasing humidity increases the slope of this
function. A signal having an even distribution of power across all frequencies at the source will seem to have an increasing proportion of its total power in the low frequen- cies as distance increases. Under field conditions, distance thus "crops" the upper frequencies in bat echolocation calls, which makes maximum frequency and hence frequency sweep unreliable features. The power distribution within the call is similarly altered by distance.
Two features remain relatively unaffected by the passage of echolocation calls through air: minimum frequency and duration. Because the lowest frequencies are the least attenuated by distance, they will normally be present if an echolocation call is detect-able. In most field situations, frequencies below 70-80 kHz are generally represented. Thus, about 50-75 percent of the frequency sweep of a Myotis species (the highest fre-quency echolocators in the Pacific Northwest) and about 100 percent of the sweep of lower frequency echolocation calls are retained at most distances. Because echoloca-tion calls of the Myotis species are about the shape of a decaying exponential func- tion, the effect of cropping the high frequencies alters the perceived duration by only 10-20 percent. For this reason, major duration differences among species remain reliable features for identification.
Ultrasonic detection data––As with any surveyor census technique, ultrasonic detec- tion has strengths and limitations that must be considered. Ultrasonic detectors provide data as "bat passes" per unit time per recognizable species. A "bat pass" can be defined as a sequence of two or more echolocation calls registered as a bat passes within range of a microphone. Detectors provide an index of bat activity at a given site and, if they are deployed at several sites, permit the comparison of activity levels among sites. Because these measures are independent of light levels or "catchability" and do not involve any direct interference, no obvious site biases appear. But because detectors do not differentiate among several passes by the same bat and single passes by several bats, there is no simple correlation between passes and the number of bats present. Nor is any means currently known for evaluating this relation to provide access to population density data. Detectors can provide only a survey.
One of the strengths ultrasonic detectors have is that they sample relatively large vol-umes of space, so they can collect large sample sizes. An omnidirectional microphone placed on the ground and capable of detecting bat species A at 20 meters will, for example, provide a continuous record of activity in a half-sphere volume of 16,747 cu- bic meters. The actual volume sampled depends on the directionality of the microphone and the maximum detection distance. The directionality is a constant for any microphone type. The maximum detection distance depends on the echolocation intensity at the source and the rate of attenuation of sound in air. Because echolocation intensities differ between species (for example, Fenton and Fullard 1981) and higher frequencies attenuate more rapidly than lower frequencies, the maximum detection distance will be a constant for each species but will differ among species. Because the volume sampled increases by the third power of the distance, even relatively small differences in the detection distance among species are important. Although detection rates for the same species can be compared among samples, these data cannot be easily used to infer differences in relative abundance among bat species.
Ultrasonic Detection
and Bat Surveys in
the Pacific
Northwest
Based on the considerations outlined above, ultrasonic detection was selected as the only method able to provide a survey of bats in several small- to medium-size forest blocks in the Pacific Northwest (Thomas 1988). The system chosen had to be portable and able to provide species-level identification for all or a major proportion of the bat community. It also had to be sufficiently inexpensive to allow the purchase or construc-tion of enough units to sample 45 study stands in a given region in a short time (ca. 1 month). Given these constraints, we selected a divide-by-10 system based on the Miller and Andersen design (1984). Although this system has been used to recog-nize bats by ear (Ahlen 1981), we were not confident that interobserver variation was negligible. For this reason, we coupled each divide-by-10 detector with a
sound-activated tape recorder (Panasonic RQ-355) that stored the divided echolocation calls on tape after being triggered by the first call of a sequence. These recordings were later analyzed in the laboratory by using a period-meter to display the frequency-time form of the calls on a calibrated oscilloscope screen (Telequipment D32). This formed the basic detector system used throughout the study; however, the peripherals to this system evolved in complexity over two field seasons.
In 1984, six divide-by-10 and recorder systems were used to sample bat activity in 41 stands in the Cascade Range of southern Washington. Because bat activity is not constant throughout the night, each stand was sampled for 75 minutes (15 minutes each at five stations) starting about 30 minutes after sunset. Each stand was sampled three times to measure intrastand variation. This required six field assistants, each equipped with one detector system.
In total, only 277 bat passes were detected, representing a mean detection rate of 1.8 bats of all species per hour. For recognizable species in the genus Myotis (the most commonly occurring genus), detection rates ranged from 0.09 to 0.47 passes/hour. These rates were too low to permit any analyses other than presence and absence for grouped categories (for example, cavity- and foliage-roosting species). Bat activity is too low in stands in the Pacific Northwest to permit labor-intensive sampling with hand-held detectors. In addition, this system cannot provide any data on bat activity at the forest canopy level.
The solution to the problem of sampling in areas of low bat activity was sought in auto-mation. We modified the basic divide-by-10 and recorder system so it activated itself at a preset time, stored bat passes as they occurred, recorded voice-synthesized time entries at 32-minute intervals, and turned off at a predetermined time. This detector system recycled to provide data on bat activity over successive nights. This system had an additional benefit of allowing a microphone to be raised to the canopy level to provide a sample for the lower to upper canopy stratum. The only limitations to the duration of sampling were the number of entries (bat passes, time entries, and spuri- ous noise or insect calls) that could be contained on one side of a 90-minute
cassette and the life expectancy of the power source. In the appendix and in tables 2 and 3, we provide additional information on this system, but we highly recommend consulting an electronics expert before considering following our schema.
The system used in field surveys of bats in the Pacific Northwest and specifically in the stands selected for study in the Old-Growth Wildlife Habitat Program had to meet three criteria: it had to record echolocation calls and allow data analysis, and the
Table 3––Sources and approximate costs of some equipment required for monitoring bats with automated detector systems
Recording To use echolocation frequency-time characteristics for species identification, records must be obtained for known individuals of each species in a given study region (see Thomas and others 1987). We made efforts to capture and record the 12 species of bats in the Pacific Northwest to provide the data base for this study. Table 1 presents the frequency-time characteristics for the species that we captured. A more detailed description of the frequencies and durations of echolocation calls of these species can be found in Thomas and others (1987). In this study, we recognized seven species or species groups: Myotis lucifugus/M. yumanensis, M. volans, Eptesicus fuscus/ M. thysanodes, Lasionycteris noctivagans, Lasiurus cinereus, Plecotus townsendii,
and a "Myotis group." This latter group was comprised of four species (M. evotis, M. ciliolabrum, M. septentrionalis, and M. californicus). The similarities in roosting and feeding ecology among the undifferentiable species make these acceptable "ecological" groupings.
Although the above groupings indicate the level of species discrimination achievable in the Pacific Northwest, we recommend that each study make independent reference recordings for use as the data base where possible. This has two important benefits: First, it provides a way to assess any regional or interindividual variation in echolocation characteristics. Thomas and others (1987) suggest that such variation may exist. Second, the making of recordings also provides important "hands-on" experience with the specific equipment applied in the study and can expose any difficulties with species recognition. There is no question that the efficient use of the period-meter and oscillo-scope system requires many hours of training and experience.
Data Analysis
Fenton (1988) outlines sound recording and analysis techniques. Bats will alter their echolocation call structure when flying in confined spaces (Fenton and Bell 1981, Simmons and others 1979b). All recordings must therefore be made outdoors. We recommend that bats be captured, identified, marked with a visual tag, and released individually in an area of low bat activity. Cyalume®, injected into small gelatin capsules and glued to the fur, provides a useful short-term visual mark (Barclay and Bell 1988, Buchler 1975). Marked bats frequently circle before flying out of range and so provide a good record of echolocation signals for a known species.
A period meter displays echolocation signals as frequency (vertical axis) and time (hori-zontal axis) on an oscilloscope screen. These displays are transient, lasting only as long as the calls themselves (2-15 milliseconds). They can be difficult to follow if they drift at random across the screen, so the oscilloscope must be set to trigger on each call at a fixed reference point. Frequency ranges displayed by the period meter are selectable. Once an appropriate range has been selected (usually 0-7.5 kHz for divided calls), the frequency axis must be calibrated on the oscilloscope screen by using a signal generator to feed in known frequencies. Frequency calibration may drift slightly with changing voltage in the power supply to the period meter, so the system should be calibrated regularly. With a calibrated system and a data base for the frequency-time patterns of echolocation calls in hand, recordings of bat passes can be analyzed.
Deployment and Sampling Any sampling scheme employing bat detectors must take several factors into account.
Distribution
• High variance. Because the majority of bat species are colonial and disperse away from roosts nightly in an unknown pattern (at random or with directionality), large spatial and temporal heterogeneity will occur in detection rates. This will be manifested in high intrastand and interstand variances.
• Nightly activity patterns. Bat activity is not uniformly distributed throughout the night. Activity is highest during the first ca. 60 minutes that correspond with dispersal away from roosts and the first feeding period (Anthony and Kunz 1977, Swift 1980). Activity often declines after this, but marked peaks may occur around midnight and again toward dawn. Samples used for comparisons must be collected over equivalent periods.
• Phenological patterns. Bat activity may differ during the three distinct reproductive periods of the summer: gestation, lactation, and weaning and recruitment. During gestation, females do not return to the day roosts during the night, but rather group together in separate night roosts between foraging bouts (Anthony and Kunz 1977, Barclay 1982). During lactation, however, the nursing schedule causes females to return to the day roosts to feed their young (Swift 1980). This, and the increased energy demands associated with lactation, may result in increased commuting and feeding activity during lactation. After weaning, the juvenile cohort is recruited into the flying population. The concommitant increase in the effective population size may also affect activity levels. These periods may correspond with April-June (gesta- tion), July (lactation), and August-September (weaning and recruitment) in the Pacific Northwest, although insufficient data exist to permit their precise characteriza-tion (see Barbour and Davis 1969). All sampling should be completed within each reproductive period until these differences can be assessed.
• Vertical stratification. Little is known about the vertical distribution of activity either among species or within species for different locations and times. Stands should be sampled at ground and canopy levels wherever possible.
• Distribution of stands. The time involved in commuting to stands and setting up detectors is not negligible. Where stands are highly dispersed, as they were in the Cascade Range of southern Washington and the Oregon Coast Range, commuting may amount to >50 percent of the total time required to deploy detectors.
Given the constraints outlined above, the distribution of sampling effort within and among stands is determined primarily by the number of detector systems and field assistants available. In the Old-.Growth Wildlife Habitat Program, we distributed our sampling effort as follows: in the Cascade Range of southern Washington and the Oregon Coast Range, two groups of 45 stands were selected for study. These represented five treatment groups (nine replicates each) covering the spread of age classes and moisture conditions found in Douglas-fir stands in the Pacific Northwest (Old-Growth Dry, Old-Growth Mesic, Old-Growth Wet, Mature Mesic, and Young Mesic). Each stand was sampled on two successive nights at both the ground and canopy levels with one detector at each level. To sample the canopy, the detector microphone was raised to the low- or mid-canopy height (>30 m) by shooting a monofilament line over a branch with a bow and weighted arrow. Both detectors were set to begin sampling at dusk (ca. 30 minutes after sunset) and to remain activated for 8 hours. In both regions, each of the 45 stands was sampled in July and again in August.
In this sampling scheme, we collected partial (>3 hours) or complete (16 hours) samples in 68 percent and 77 percent of efforts at ground level and in 48 percent and 39 percent of efforts at canopy level in Washington and Oregon, respectively. Sampling failure was due to equipment malfunction, radio interference, or orthopteran stridulations that caused the cassette to run out (see appendix). With this effort, albeit incomplete, we were able to collect samples totaling 1,599 hours in Washington and 1,500 hours in Oregon during July and August combined. These samples yielded 3,029 bat passes in Washington and 6,211 passes in Oregon (respectively, 10.9 and 22.4 times the sample sizes that we were able to collect with hand-held detectors).
An Overview
Conclusions
Acknowledgments
This sampling scheme represents a serious compromise between intrastand (number of nights per stand) and interstand (number of stands per treatment group) sampling efforts. It is important to consider the costs of increasing the sampling effort. The sampling scheme outlined above required 16 detector systems and one full-time field assistant for each region. With the distance between stands and the time required to set the equipment up, one assistant was able to set up or collect eight detectors (four stands) per day. Over an 11-day cycle (8 days on and 3 days off), 16 stands could be sampled for 2 nights each and in 1 month all 45 stands could be visited. This entailed a total commuting distance of about 5,000 miles/month (150-250 miles/day) and did not allow any time to make up for lost samples. Allowing sufficient time and resources to make up for lost samples would require doubling the available resources in equipment, assistants, and vehicles. Doubling the sampling effort either in the number of stands sampled or the number of visits to each stand would require roughly a fourfold increase in equipment, assistants, and vehicles. There are also hidden time and financial constraints associated with data analysis. Sampling 45 stands at ground and canopy levels produces 90 tape samples that must be scanned for bat calls. About 10 samples can be analyzed per day. One month of sampling in the field takes one technician using one period-meter and oscilloscope system 2 weeks to analyze. The appendix lists the equipment necessary and some of the costs associated with setting up sampling by automated detectors.
,
Surveying bat activity in habitats by ultrasonic detectors requires moderately sophisti-cated and expensive equipment and knowledge of basic bioacoustics. It represents a specialized technique that relatively few people have expertise with. This expertise can be acquired through limited exposure to field recording and data analysis methods, but this requires a finite investment of time and an initial investment of money. We recommend that any groups or agencies considering bat surveys pay serious atten- tion to their requirements for data and to their available resources: funds are needed for start-up time, staff, and equipment. Bat surveys are sufficiently demanding that they cannot easily be undertaken on a "time-sharing" basis with other surveys.
We have provided an overview of some techniques that can be applicable to bat surveys away from roosting sites. Most techniques have serious biases or are logistically difficult to apply to community-wide surveys of bat abundance or activity within specified habitats. Ultrasonic detection, relying on equipment to detect the echolocation calls of commuting and foraging bats, is logistically practical and has the fewest biases. Although it cannot provide species-level identification for all species in all bat communities, it provides access to information on bat activity at specific sites or habitats. We have outlined how automated detector systems were used in bat surveys in the Pacific Northwest in the Old-Growth Wildlife Habitat Program.
This study would not have been possible without field assistance from Katherine March, Joe Buchanon, Rick Lundquist, Robin Sherry, Anne Humphrey, and Anne-Marie
Gillesburg. Dick Hinshaw provided most of the electronics expertise. Discussions with AI Hicks (New York Department of Conservation) sparked the development of the automated system. This study was funded by Cooperative Agreement PNW-84-234 of the USDA Forest Service, Pacific Northwest Research Station, and by operating grants to Donald W. Thomas from the Natural Sciences and Engineering Research Council of Canada. This is Contribution 58 of the Groupe de Recherché en Écologie, Nutrition, et Énergétique, Université de Sherbrooke.
Literature Cited
Ahlen, Ingemar. 1981. Field identification of bats and survey methods based on sounds. Myotis. 18-19: 128-136.Anthony, Edythe P.; Kunz, Thomas H. 1977. Feeding strategies of the little brown bat, Myotis lucifugus, in southern New Hampshire. Ecology. 58: 775-786.
Barbour, Roger W.; Davis, Wayne D. 1969. Bats of America. Lexington, KY: University Press of Lexington. 286 p.
Barclay, Robert M.R. 1982. Night roosting behavior of the little brown bat, Myotis lucifugus. Journal of Mammalogy. 63: 464-474.
Barclay, Robert M.R. 1984. Observations on the migration and behaviour of bats at Delta Marsh, Manitoba. Canadian Field-Naturalist. 9_: 331-336.
Barclay, Robert M. R.; Bell, Gary P. 1988. Marking and observational techniques. In: Kunz, Thomas H., ed. Ecological and behavioral methods for the study of bats. Washington, DC: Smithsonian Institution Press: 59-76.
Bell, Gary P. 1980. Habitat use and response to patches of prey by desert insectivorous bats. Canadian Journal of Zoology. 58: 1876-1883.
Bell, Gary P. 1982. Behavioral and ecological aspects of gleaning by a desert insectivorous bat, Antrozous pallidus (Chiroptera: Vespertilionidae). Behavioral Ecology and Sociobiology. 10: 217-223.
Brigham, R. Mark. 1987. The significance of winter activity by the big brown bat
(Eptesicus fuscus): the influence of energy reserves. Canadian Journal of Zoology. 65: 1240-1242.
Buchler, Edward. R. 1975. A chemiluminescent tag for tracking bats and other small nocturnal animals. Journal of Mammalogy. 57: 173-176.
Davis, Wayne H. 1970. Hibernation: ecology and physiological ecology. In: Wimsatt, William A., ed. Biology of bats. New York, NY: Academic Press: 226-300. Vol. 1.
Fenton, M. Brock. 1970. Population studies of Myotis lucifugus (Chiroptera: Vespertillionidae) in Ontario. Toronto, ON: Royal Ontario Museum: Life Sciences Contributions: 77: 1-34.
Fenton, M. Brock. 1985. Communication in the Chiroptera. Bloomington, IN: Indiana University Press. 161 p.
Fenton, M. Brock. 1988. Detecting, recording, and analyzing vocalizations of bats. In: Kunz, Thomas H., ed. Ecological and behavioral methods for the study of bats. Washington, DC: Smithsonian Institution Press: 91-104.
Fenton, M. Brock;Bell, Gary P. 1979. Echolocation and feeding behaviour in four species of Myotis (Chiroptera). Canadian Journal of Zoology. 57: 1271-1277.
Fenton, M. Brock; Bell, Gary P. 1981. Recognition of insectivorous bats by their echolocation calls. Journal of Mammalogy. 62: 233-243.
Fenton, M. Brock; Fullard, James H. 1981. Moth hearing and the feeding strategies of bats. American Scientist. 69: 266-275.
Fenton, M. Brock; Merriam, H. Gray; Holroyd, Geoffrey L. 1983. Bats of Kootenay, Glacier, and Mount Revelstoke National Parks in Canada: identification by echoloca-tion calls, distribuecholoca-tion, and biology. Canadian Journal of Zoology. 61: 2503-2508.
Findley, James S.; Jones, Clyde. 1964. Seasonal distribution of the hoary bat. Journal of Mammalogy. 45: 461-470.
Gaisler, Jiri. 1979. Results of bat census in a town (Mammalia: Chiroptera). Vestnik Ceskoslovenske Spolecnosti Zoologicke. 43: 7-21.
Gaisler, Jiri; Hanak, Vladimir; Dungel, Jan. 1979. A contribution to the population ecology of Nyctalus noctula (Mammalia: Chiroptera). Acta Scientiarum Naturalium Academiae Scientiarum Bohemoslovacae Brno. 13: 1-38.
Griffin, Donald R. 1971. The importance of atmospheric attenuation for the echoloca- tion of bats (Chiroptera). Animal Behavior. 19: 55-61. .
Herd, Robert M.; Fenton, M. Brock. 1983. An electrophoretic, morphological and eco-logical investigation of a putative hybrid zone between Myotis lucifugus and Myotis yumanensis (Chiroptera: Vespertilionidae). Canadian Journal of Zoology. 61: 2029-2050.
Howell, Donna J.; Roth, Barbara Schopfer. 1981. Sexual reproduction in Agaves: the benefits of bats: the cost of semelparous advertising. Ecology. 62: 1-7.
Kunz, Thomas H. 1982a. Lasionycteris noctivagans. Mammalian Species. 172: 1-5.
Kunz, Thomas H. 1982b. Roosting ecology. In: Kunz, Thomas H., ed. Ecology of bats. New York, NY: Plenum Press: 1-55.
Kunz, Thomas H. 1988. Ecological and behavioral methods in the study of bats. Washington, DC: Smithsonian Institution Press. 533 p.
Kunz, Thomas H.; Brock, Carol E. 1975. A comparison of mist nets and ultrasonic detectors for monitoring flight activity of bats. Journal of Mammalogy. 56: 907-911.
Lehmkuhl, John F. 1984. Determining size and dispersion of minimum viable populations for land management planning and species conservation. Environmental
Management. 8: 167-176.
Leonard, M.L.; Fenton, M. Brock. 1984. Echolocation calls of Euderma maculatum
(Vespertilionidae): use in orientation and communication. Journal of Mammalogy. 65: 122-126.
Miller, Lee A.; Andersen, Bent Bach. 1984. Studying bat echolocation signals using ultrasonic detectors. Zeitschrift Saeugetierkunde. 49: 6-13.
Paige, Ken N.; Mink, Lawrence A.; McDaniel, V. Rick. 1985. A broadband ultrasonic field detector for monitoring bat cries. Journal of Wildlife Management. 49: 11-13.
Perkins, Mark. 1985. The plight of Plecotus. Austin, TX: Bats: Newsletter of Bat Conservation International; 2: 1-2.
Racey, Paul A. 1982. Ecology of bat reproduction. In: Kunz, Thomas H., ed. Ecology of bats. New York, NY: Plenum Press: 57-104.
Ralph, C. John.; Scott, J. Michael. 1981. Estimating numbers of terrestrial birds. Studies in Avian Ecology No.6. Lawrence, KS: Allen Press: 630 p.
Simmons, James A.; Fenton, M. Brock; Ferguson, W. R.; [and others]. 1979a. Apparatus for research on animal ultrasonic signals. Toronto, ON: Royal Ontario Museum: Life Sciences Miscellaneous Publication: 1-31.
Simmons, James A.; Fenton, M. Brock; O'Farrell, Michael J. 1979b. Echolocation and pursuit of prey by bats. Science. 203: 16-21.
Swift, Susan M. 1980. Activity patterns of Pipistrelle bats (Pipistrellus pipistrellus) in north-east Scotland. Journal of Zoology of London. 190: 285-295.
Thomas, Donald W. [in press]. The distribution of bats in different ages of Douglas-fir forests. Journal of Wildlife Management.
Thomas, Donald W.; Bell, Gary P.; Fenton, M. Brock. 1987. Variation in echoloca- tion call frequencies recorded from North American vespertilionid bats: a caution- ary note. Journal of Mammalogy. 68: 842-847.
Thomas, Donald W.; LaVal, R. K. 1988. Survey and census methods. In:
Kunz, Thomas H., ed. Ecological and behavioral methods for the study of bats. Washington, DC: Smithsonian Institution Press: 77-89.
Thomas, Donald W.; West, Stephen D. 1984. On the use of ultrasonic detectors for bat species identification and the calibration of OMC Mini Bat Detectors. Canadian
Journal of Zoology. 62: 2677-2679.
Tuttle, Merlin D. 1974. An improved trap for bats. Journal of Mammalogy. 55: 475-477.
Whitaker, John 0., Jr.; Maser, Chris; Cross, Stephen P.1981. Food habits of eastern Oregon bats, based on stomach and scat analysis. Northwest Science. 55: 281-292.
Whitaker, John 0., Jr.; Maser, Chris; Keller, Laurel E. 1977. Food habits of bats of western Oregon. Northwest Science. 51: 46-55.
Wimsatt, William A. 1970. Biology of bats. New York, NY: Academic Press: 406 p. Vol. 1.
Wimsatt, William A. 1977. Biology of bats. New York, NY: Academic Press: 651 p. Vol. 3.
Appendix
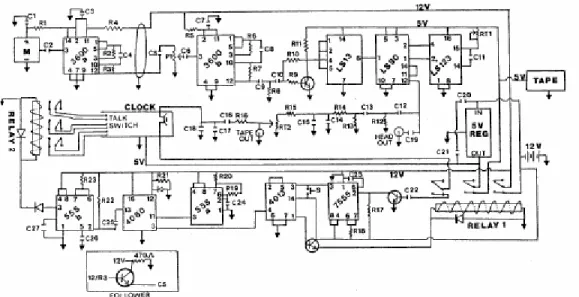
Equipment Figure 1 is a circuit diagram for the automated bat detector system. This is presented only as an aid to understanding our circuitry and developing a similar system. It is not a professionally designed and perfected circuit! The detector system incorporates the following subcircuits.
Detector/recorder––The divide-by-10 detector follows the original design of Miller and Andersen (1984). The electret microphone is sensitive to ultrasonic frequencies up to 100 kHz. The microphone signal is amplified by a preamplifier in the microphone housing (3600a) and a second amplifier in the main circuit box (3600b). The amplified signal waveform is saturated and squared (3600b and LS13) and then counted by a decade counter (LS90). The decade counter emits a single positive pulse at the output for every 10 at the input, effectively dividing the frequency by 10. The output signal passes through a high-pass filter (LS123) to remove extraneous low-frequency signals. In our circuit, the filter was set to remove frequencies below 18 kHz by adjusting RT1. The filtered signal is processed by a capacitor-resistor series (C12-C15, R12-R15) to make it compatible to recording and is provided at tape recorder and headphone jacks. The output signal is stored on cassette by a Panasonic RQ-355 recorder set in the sound-activated position.
Timers—ATalking Time quartz clock with a digital display and voice-synthesized speech output is incorporated into the system along with a trigger circuit to govern the time the detector circuit is turned on and when time entries are announced on the cassette. To conserve battery life, power is provided only to the clock and the trigger circuit (7555 and 4013) during the day. The clock alarm is set to control the desired
Figure 1––Circuit diagram for the automated bat detector system, based on Miller and Andersen (1984). See table 2 (in text) for a parts list. Integrated circuit connecting pins are indicated. Microphone, clock, and tape recorder specifications and sources are given in table 3 (in text). Inset shows the configuration of a following circuit to be added at pin 12/R3 if audio shielded cable >20m is used for the microphone cable. M=microphone; S=reset button; C=capacitor; R=resistor.
"on" time. When the alarm activates, the clock speaker signal is fed through a pulse-stretching circuit (7555) to a flip-flop (4013) that flips to its high ("on") state and pulls in the contacts of relay 1. A manual reset button is provided to ensure that the flip-flop is in its low ("off") state when the equipment is first powered. When pulled in, relay 1 supplies power to the detector amplifier circuits (12V), the dividing circuit (5V), the tape recorder (5V), and a timing circuit (12V). When it receives power, the timing chip (555a) begins pulsing every 3.8 seconds. This pulse rate is adjusted by varying R19. This output is read by a 14-stage binary counter (4060) that divides the pulse rate by a selectable function (21_214). The output at stage 14 goes high at the first input pulse from 555a and remains high for 9 hours. After this period, it goes low and resets the flip-flop (4013) to its low ("off") state and turns off relay 1. This interrupts the power supply to the detector, timer, and tape recorder until the alarm restarts the system on the following night. In this way, the alarm-timer combination governs the exact time that the detector system comes on and the duration of the sample on a given night.
Time entries are provided on the tape at 32-minute intervals by feeding an output from stage 9 of the binary counter (4060) to a timer (555b) that briefly pulls in relay 2. Clos-ing the contacts on relay 2 shorts the contacts behind the "talk" button on the clock and causes it to announce the time. The clock has to be opened and wires soldered to three pairs of contacts behind the "talk" button for the relay to control the talk function. The voice signal is taken off the clock speaker and filtered (C16-C18, R16) to remove a spurious 10-mHz signal that disrupts the automatic gain control of the tape recorder. The filtered voice signal is provided at the tape jack.
The system is powered by a 9.5-amp 12-volt sealed lead acid battery. On an 8-hour-on and 16-hour-off cycle, the power supply lasts about 72 hours.
For each 1- to 3-night sample, the cassette contains the power-on (alarm) time and time entries at 32-minute intervals. Bat echolocation calls are entered as they occur.
Problems
For canopy samples, the microphone lead is extended to >30 meters in length, allowing only the microphone to be raised. If shielded rather than coaxial cable is used, a
following circuit (fig. 1) must be added to the output of the preamplifier in the microphone housing (pin 12 of 3600a-R3 junction) for impedance matching.
In some areas (about 25 percent of study sites in the Cascade Range of southern Washington and the Oregon Coast Range), we encountered serious AM band radio interference when microphones were raised on long leads into the canopy. Despite copper screen shielding on the circuit itself and the normal cable shield, AM radio signals were picked up and passed into the dividing circuit. These appeared at the headphone and tape recorder jacks as intermittent to continuous static. These signals triggered the tape recorder and caused the tape to run out. A radio-frequency filter at the input to chip 3600b or enhanced shielding may reduce this problem, but we have not explored possible solutions.
Costs and Sources
The detector does not discriminate between bat echolocation signals and other sounds in the same frequency band (18-100 kHz). Rain or stridulating orthopterans will cause the tape to run out prematurely, which reduces the potential sample lengths. In southern Washington, this was not a serious problem. In the Oregon Coast Range, however, calling orthopterans resulted in a loss of about 1 O-percent of the samples. We know of no way to avoid this problem.
Sampling 45 stands in 1 month at the same level of effort as outlined above requires 16 detector systems, 1 period-meter and oscilloscope system, and 2 battery chargers. Each detector system costs about $400 for parts. Each period-meter and oscilloscope system costs roughly $1000. Variable voltage and current battery chargers can be purchased for about $185 each. Thus, the equipment investment is about $7770 excluding any labor charges for construction or testing.
.
Thomas, Donald W.; West, Steven D. 1989. Sampling methods for bats. Gen. Tech. Rep. PNW-GTR-243. Portland, OR: U.S. Department of Agriculture, Forest Service, Pacific Northwest Research Station. 20 p. (Ruggiero, Leonard F.; Carey, Andrew B., tech. eds.; Wildlife-habitat relationships: sampling procedures for Pacific Northwest vertebrates). Bats represent the second most diverse group of mammals inhabiting the western slopes of the Cascade Range in southern Washington and the Oregon Coast Range. Bat populations may well be sensitive to changes in forest age, structure, or distribution, but their nocturnal habits and high mobility render the study of the habitat requirements of bats problematical. Unlike most other groups of vertebrates, bats are difficult to either observe or capture, and survey methods are poorly known. This paper reviews techniques for surveying bat populations and presents the methodology used in the Old-Growth Forest Wildlife Habitat Program in the Pacific Northwest. Keywords: Bats, Chiroptera, distribution, abundance, habitat use, surveys, sampling methods, ultrasonic detection.
The Forest Service of the U.S. Department of Agriculture is dedicated to the principle of multiple use management of the Nation's forest resources for sustained yields of wood, water, forage, wildlife, and recreation. Through forestry research,
cooperation with the States and private forest owners, and management of the National Forests and National Grasslands, it strives––as directed by Congress––to provide increasingly greater service to a growing Nation.
The U.S. Department of Agriculture is an Equal Opportunity Employer. Applicants for all Department programs will be given equal consideration without regard to age, race, color, sex, religion, or national origin.
Pacific Northwest Research Station 319 S.W. Pine St.
P.O. Box 3890
U.S. Department of Agriculture Pacific Northwest Research Station 319 S.W. Pine Street P.O. Box 3890 Portland, Oregon 97208 BULK RATE POSTAGE + FEES PAID USDA-FS PERMIT No. G-40 Official Business
Penalty for Private Use, $300