A comparison of perceptually motivated loss functions for binary mask
estimation in speech separation
Danny Websdale, Ben Milner
University of East Anglia
[email protected], [email protected]
Abstract
This work proposes and compares perceptually motivated loss functions for deep learning based binary mask estimation for speech separation. Previous loss functions have focused on maximising classification accuracy of mask estimation but we now propose loss functions that aim to maximise the hit mi-nus false-alarm (HIT-FA) rate which is known to correlate more closely to speech intelligibility. The baseline loss function is bi-nary cross-entropy (CE), a standard loss function used in bibi-nary mask estimation, which maximises classification accuracy. We propose first a loss function that maximises the HIT-FA rate in-stead of classification accuracy. We then propose a second loss function that is a hybrid between CE and HIT-FA, providing a balance between classification accuracy and HIT-FA rate. Eval-uations of the perceptually motivated loss functions with the GRID database show improvements to HIT-FA rate and ESTOI across babble and factory noises. Further tests then explore ap-plication of the perceptually motivated loss functions to a larger vocabulary dataset.
Index Terms: HIT-FA, speech separation, binary mask
1. Introduction
Speech separation from a monaural source aims to separate tar-get speech from interfering background noise to produce a more intelligible signal. Such systems have widespread application in areas such as speech enhancement, robust speech recognition and hearing aid design [1, 2, 3]. There are two main approaches to this problem. The first is to derive a statistical model that makes certain assumptions about the background noise, and in-cludes methods such as spectral subtraction, Weiner filtering and mean-square error estimation [4]. These approaches have been shown to not provide an increase in intelligibility for hu-man listeners [5, 6]. This is because distortions (e.g. musical noise) are introduced and low-intensity sounds (e.g. unvoiced consonants), which are important for intelligibility, are lost. The second approach uses computational auditory scene anal-ysis (CASA) [7], inspired by perceptual principles of auditory scene analysis (ASA), can be effective in both stationary and non-stationary noise [8].
In CASA, speech can be extracted by applying a mask to a time-frequency (T-F) representation of noisy speech. An ideal binary mask (IBM) retains speech dominant T-F units and sup-presses noise dominant T-F units. An IBM can be constructed from premixed speech and noise and defined as
IBM(t, f) =
1, if SNR(t, f)≥LC
0, otherwise (1)
wheretandfrepresent time frame and frequency bin respec-tively and LC is a local criterion. T-F units dominated by speech are assumed to have a signal-to-noise ratio (SNR) greater than
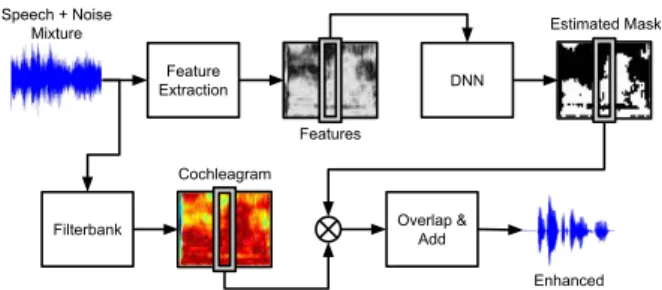
Feature Extraction DNN Enhanced Audio Speech + Noise Mixture Features Filterbank Cochleagram Estimated Mask Overlap & Add
Figure 1:Overview of the speech separation system. or equal to LC are represented by1and retained. Noise dom-inant units are assumed to be less than LC are represented by 0 and suppressed. Several studies have reported subjec-tive test results where IBMs improve intelligibility for speech in noise for both normal-hearing and hearing-impaired listen-ers [9, 10, 11, 12]. In practice an IBM is not available and in-stead the binary mask must be estimated from the noisy signal. This allows speech separation to be treated as a mask estimation problem that uses supervised learning to map acoustic features extracted from noisy speech to a binary mask [13].
Previous studies have focused on either developing im-proved feature extraction methods or using more sophisticated classifiers - for example moving from Gaussian mixture models (GMMs) to deep neural networks (DNNs). Some attention has been focussed on improving the classifier to reduce perceptual error by changing the loss function for text-to-speech applica-tions [14], and introducing signal approximation loss funcapplica-tions [15, 16] as a replacement for mask approximation within speech separation applications. Signal approximation loss functions apply the output of the network to the noisy spectrum within the loss function, and minimise this with respect to the target. Signal approximation works well when the network target is the power spectrum, outperforming mask approximation, how-ever is not applicable to a cochleagram framework, due to the cochleagram is constructed from overlapping gammatone fil-terbanks. In this work we focus on mask approximation loss functions within a cochleagram framework for consideration to cochlear implants.
We first compare the performance of two different feature extraction methods, namely the multi-resolution cochleagram feature (MRCG) and the complementary feature set (ARpMG) [17, 18]. We also propose two perceptually motivated mask ap-proximation loss functions that are inspired by the hit minus false-alarm (HIT-FA) rate, which has been shown to correlate more closely to speech intelligibility than classification accu-racy [19, 20, 17, 18, 21]. Classification accuaccu-racy is the basis of the binary cross-entropy (CE) loss function used as standard for binary mask estimation forming our baseline.
Figure 1 shows the overall speech separation system. Fea-tures are extracted from noisy speech and input into a DNN to
estimate a binary mask. Masking is applied to a cochleagram [7] of the noisy speech which suppresses noise-dominated T-F units and the remaining signals are overlapped and summed to produce the enhanced signal.
The remainder of the paper is organised as follows. The classifier and proposed loss functions are described in Section 2. Section 3 provides an overview of two feature extraction methods. Performance evaluations are made in Section 4 which first compare the feature extraction methods and then the effec-tiveness of the proposed perceptual loss functions under varying noise and SNR conditions using both a small dataset (GRID) and large dataset (RM-3000).
2. Perceptually motivated loss functions
The purpose of the classifier is to learn a mapping between acoustic features extracted from the noisy speech mixture and the binary mask output. Previous studies have shown a progres-sion in classifiers used, beginning with GMMs through to sup-port vector machines (SVMs), multilayer perceptrons (MLPs) and finally deep learning [19, 20, 17, 18, 21, 22]. We use DNNs as the classifier in this work which normally uses the binary cross-entropy (CE) loss function in training for classification tasks. The DNN uses rectified linear units for hidden layers and a sigmoid layer for the output. The CE loss function is now reviewed and two new perceptually motivated loss functions in-troduced inspired by the HIT-FA rate.2.1. Binary cross-entropy (CE)
Binary cross-entropy (CE) is a standard loss function used within DNN training for classification tasks [23] and forms the baseline loss function. The aim of CE is to maximise the ac-curacy of the estimated mask where acac-curacy is defined as the proportion of correctly labeled T-F units. The CE loss,LCE, is
calculated as LCE=−1 N N X n=1 h ynlog(ˆyn) + (1−yn) log(1−yˆn) i (2) whereyandyˆare vectors that comprise concatenated frames of T-F units for each mini-batch in DNN training, from the IBM and estimated mask respectively. Each of these vectors com-prisesNT-F units which are indexed byn.
2.2. HIT-FA (HF)
Our first perceptually motivated loss function (HF) is based on maximising the HIT-FA rate, which several studies have shown correlates more closely to intelligibility than mask accuracy [19, 20, 17, 18, 21]. In terms of the loss function, HITs refer to the proportion of correctly labeled target-dominant T-F units while FAs refer to the proportion of incorrectly labeled noise-dominant T-F units. Studies have shown that achieving high HITs and low FAs produces higher intelligibility [19].
The key difference between the CE and HF loss functions is that CE calculates accuracy over all T-F units together, whereas HF calculates the accuracy of target-dominant (1) and noise-dominant (0) T-F units separately. HIT-FA has a range between
1and -1, with1being best performance. However within DNN training loss is minimised, therefore we use FA-HIT to give best performance at -1and remove this discrepancy. The HIT-FA loss,LHF, is calculated as LHF= 1 S N X n=1 h (1−yn)ˆyn i − 1 R N X n=1 h ynˆyn i (3)
whereS is the number of T-F units withiny that should be suppressed (0s) andRis the number of T-F units withinythat should be retained (1s).
2.3. Binary cross-entropy HIT-FA hybrid (CHF)
Within an IBM the number of retained T-F units,R, and number of suppressed units,S, are generally not equal. In most cases there are more noise-dominant T-F units than target-dominant units, due mainly to areas of non-speech. The HF loss function is calculated as proportions ofRandSseparately, and is there-fore less affected by bias towards a difference betweenRand
S. Conversely, the CE loss function is calculated as an overall accuracy ofRandSand is therefore biased towards the greater of the two. We take inspiration from the HF loss function to produce a hybrid cross-entropy HIT-FA (CHF) loss function by modifying the CE function to remove this bias. To do this we normalise the ratio betweenRandSsuch thatR=S. This is achieved by multiplying the portion related toSbyR/S. The cross-entropy HIT-FA loss function,LCHF
, is calculated as LCHF=−1 N N X n=1 h ynlog(ˆyn)+ R S(1−yn) log(1−yˆn) i (4)
Our data has a bias towardsS, therefore this normalisation will cause an increase of HITs at a cost of increasing FAs. The oppo-site would occur if the bias was towardsR. A reduction to over-all classification accuracy will occur in over-all cases whereR6=S
prior to normalisation.
3. Feature extraction
Feature extraction aims to identify suitably discriminative in-formation in the noisy input speech that enables the DNN to de-termine whether T-F units are target (1) or noise (0) dominated. We investigate two different acoustic features.
3.1. Multi-resolution cochleagram feature (MRCG) The MRCG feature was designed specifically for mask estima-tion and combines four cochleagrams at different resoluestima-tions [17]. The first captures high resolution localised detail while the remaining cochleagrams capture lower resolution spectrotem-poral content. Cochleagrams are computed by passing the input signal through a64-channel gammatone filterbank [24].
The outputs from the gammatone filterbank are split into
20 msframes with10 msframe shift with power spectrum com-puted followed by a log which gives the first cochleagram,
CG1. Similarly,CG2 uses200 msframes with10 msframe
shift. Finally,CG3andCG4are derived by applying an11×11
and23×23mean filter kernel toCG1[17]. The final MRCG
feature,xMRCG, is produced by stacking all fourCGs.
3.2. Complementary feature set (ARpMG)
The complementary feature set (ARpMG) is an ensemble of commonly used acoustic features [17, 18, 21]. This com-bines amplitude modulation spectrum (AMS) [25, 26, 19], rela-tive spectral transformed perceptual linear prediction (RASTA-PLP) [27] and mel-frequency cepstral coefficients (MFCCs) [28] with a gammatone filterbank (GFB) [17].
The specific implementation is taken from [18] where AMS features are computed from32 ms frames with10 ms frame shift to give a15-D vector. RASTA-PLP features are also com-puted from32 msframes with10 msframe shift and result in
a13-D vector. MFCCs are computed from20 msframes with
10 msframe shift with a30-D vector produced.The GFB fea-ture is computed from a64-channel gammatone filterbank, dec-imating to100 Hzto give a10 msframe shift and results in a
64-D vector. Combining these gives the122-D ARpMG fea-ture,xARpMG, which is produced at a10 msframe rate.
3.3. Temporal information
Including temporal information with static features have shown to improve performance for automatic speech recognition (ASR) [29, 30]. In this work we include temporal informa-tion via vector stacking. Given a sequence of static feature vectors, {. . . ,xi−2,xi−1,xi,xi+1,xi+2, . . .}, neighbouring
vectors within a window that extendsKvectors either side of the current vector are stacked, i.e.
xSTACKi = [xi−K, . . . ,xi, . . . ,xi+K] (5)
Preliminary tests found a window of7frames (i.e. K=3) gave best performance.
4. Experimental results
Experiments first identify the best performing feature set, then compare the performance of the proposed loss functions within a small dataset (GRID) across a range of noises and SNRs. This is then expanded to a larger vocabulary dataset (RM-3000).
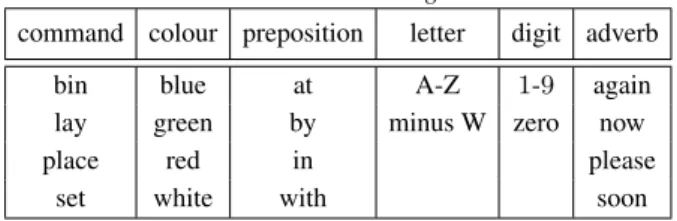
Initial tests use the GRID database which contains record-ings from34speakers who each produced1000sentences [31]. Each sentence comprises six words and follows the grammar shown in Table 1. Speaker12(male) was selected for the eval-uations and the audio downsampled to 16 kHz. The speech database is split into200test sentences, and800training sen-tences of which160are removed for validation within training.
Table 1:GRID sentence grammar.
command colour preposition letter digit adverb
bin blue at A-Z 1-9 again
lay green by minus W zero now
place red in please
set white with soon
The second dataset, RM-3000[32], consists of 3000 sen-tences spoken by a single native English speaking male speaker. The sentences were randomly selected from the 8000 sentences in the Resource Management (RM) Corpus [33]. The vocabu-lary size of1000words and no strict grammar give a more real-istic environment, and more challenging task when compared to GRID. The audio was downsampled to16 kHzand the speech database is split into600test sentences, and2400training sen-tences of which480are removed for validation within training. A range of DNN parameters were explored to find the best performing network and are shown in Table 2. From these,30
different network configurations were randomly selected and the best performing configuration based on the validation set chosen. This procedure was repeated for all loss functions with babble noise at -5 dB, so that the DNN configuration for each loss function can be considered optimised. The optimal param-eters for each loss function was used in subsequent experiments for the remaining noise types and SNRs.
For evaluating the performance of our speech separation systems, we utilise three objective measures: i) classification accuracy, ii) HIT-FA rate and iii) ESTOI [34]. Within the
ESTOI function, non-speech frames are removed via dynamic range thresholding, however in our experiments, we found this method to perform poorly and not remove the desired non-speech frames. Therefore, we remove the non-non-speech frames using the alignment transcriptions provided for each dataset prior to the ESTOI function.
Table 2:Parameter set for DNN optimisation
Parameter value hidden layers 3,4,5 hidden units 1024 mini-batch size 256,512,1024 hidden dropout 0.0,0.2,0.5 learning rate 3e−4,1e−4,3e−5,1e−5 momentum 0.0,0.9,0.99 4.1. Analysis of features
These tests compare the performance of our two feature extrac-tion methods on the GRID dataset. Experiments are performed in babble noise at an SNR of -5 dBwith LC set to -10 dB. An LC5 dBlower than the overall SNR was found to give best performance in a initial tests and conforms to that described in [18, 21]. Table 3 shows the objective performance for the two feature sets with all loss functions.
Table 3:Classification accuracy (in %), HIT-FA (in %) and ES-TOI scores for the feature comparison using the GRID dataset in babble noise at -5 dB.
Feature Loss Acc HIT-FA (FA) ESTOI
MRCG CE 89.7 66.7 (4.6) 46.9 HF 84.8 68.0 (14.5) 42.6 CHF 88.3 71.7 (9.5) 46.1 ARpMG CE 87.9 60.6 (5.4) 41.6 HF 83.1 62.2 (15.1) 37.7 CHF 85.5 65.3 (12.0) 39.8 unprocessed audio 20.3
Performance shows that across all loss functions and ob-jective measures, the MRCG feature extraction method outper-forms the ARpMG method. Intelligibility gains can be found for all features over that of unprocessed.
4.2. Analysis of perceptual loss functions
These tests compare the performance of our proposed percep-tual loss functions using the MRCG feature (see Section 4.1). Experiments are performed in babble and factory noise at SNRs of -5 dB,0 dBand +5 dB, with LC set to5 dBlower than the selected SNR with the GRID dataset. Table 4 shows the objec-tive performance across all experiments.
Focusing first on classification accuracy, the CE loss func-tion gives highest accuracy across all SNRs and noise types. This is expected as the CE loss function is targeted to maximise accuracy. The hybrid CHF loss function has accuracy almost as high as CE and exceeds that of HF which is not designed to maximise classification accuracy.
Considering now the HIT-FA rate, the HF loss function now outperforms the CE loss function as it is designed to maximise HIT-FAs. However, the hybrid CHF loss function gives even
higher HIT-FAs across all SNRs and noise types. In terms of HITs, the CHF and HF loss functions perform similarly, but their main difference is that the CHF loss function generates less FAs compared to the HF loss function. Lowest HITs and FAs are found with the CE loss function due to it favouring0s over 1s in the mask, which is caused by the bias towards the larger ofSandR. The CHF loss function is able to remove this bias and provides a balance between increasing HITs without increasing as many FAs.
Table 4:Classification accuracy (in %), HIT-FA (in %) and ES-TOI scores for the GRID dataset in babble and factory noise at -5 dB,0 dBand +5 dB.
Noise (dB) Loss Acc HIT-FA (FA) ESTOI
babble -5 CE 89.7 66.7 (4.6) 46.9 HF 84.8 68.0 (14.5) 42.6 CHF 88.3 71.7 (9.5) 46.1 unprocessed audio 20.3 0 CE 91.8 74.7 (4.1) 62.4 HF 88.7 77.4 (11.2) 60.3 CHF 90.6 79.5 (8.7) 62.8 unprocessed audio 33.9 +5 CE 92.6 77.6 (4.0) 72.2 HF 90.1 81.0 (10.3) 72.6 CHF 91.4 82.6 (8.5) 74.1 unprocessed audio 49.8 factory -5 CE 92.8 69.1 (2.7) 44.8 HF 89.4 74.1 (9.4) 40.9 CHF 91.1 75.7 (7.2) 43.8 unprocessed audio 20.1 0 CE 94.4 76.9 (2.5) 58.7 HF 91.3 79.9 (8.0) 57.2 CHF 92.9 83.2 (6.4) 60.1 unprocessed audio 33.5 +5 CE 95.1 80.3 (2.4) 66.9 HF 92.1 83.9 (7.9) 68.1 CHF 93.6 86.6 (6.2) 70.6 unprocessed audio 49.9
Comparing now the intelligibility as measured by ESTOI, the CE loss function outperforms the HF loss function at lower SNRs while the HF loss function is better at the higher5 dB
SNR. Even though the HF loss function outperforms CE with regards to the HIT-FA rate across all SNRs, the large number of FAs introduced by the HF loss function reduces the intel-ligibility to be lower than CE at low SNRs. This shows that even a large increase in HITs does not compensate for a large increase in FAs, which are more detrimental to intelligibility at low SNR than at high SNR. Considering now the performance of the hybrid CHF loss function, this outperforms both CE and HF at SNRs above -5 dBand is slightly worse than CE at -5 dB. The CHF loss function had highest HIT-FA rate across all SNR, confirming that increasing the HIT-FA rate does increase intel-ligibility, but the number of FAs introduced affects the resulting intelligibility. Reducing FAs at low SNRs is critical whereas a higher HIT rate is more important at high SNRs.
Overall, with intelligibility being the main focus, all loss functions provide large gains in intelligibility compared to that
of the unprocessed audio. If the SNR is very low, CE is the loss function of choice, however at all other SNRs, CHF is the best performing loss function. CHF also provides a strong balance between both classification accuracy and the HIT-FA rate. 4.3. Further analysis of perceptual loss functions
From the experiments in Section 4.2, loss functions CE and CHF are selected for further analysis in a larger vocabulary dataset. Experiments are performed in babble noise at SNRs of -5 dB,0 dBand +5 dB, with LC set to5 dBlower than the select SNR using the RM-3000dataset. Table 5 shows objective performance across all experiments.
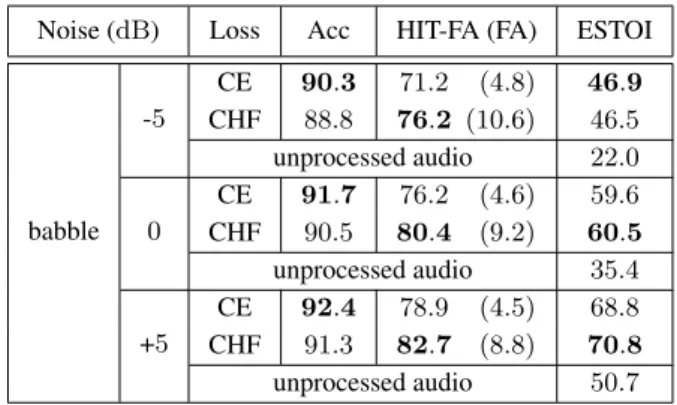
Table 5:Classification accuracy (in %), HIT-FA (in %) and ES-TOI scores for the RM-3000dataset in babble noise at -5 dB,
0 dBand +5 dB.
Noise (dB) Loss Acc HIT-FA (FA) ESTOI
babble -5 CE 90.3 71.2 (4.8) 46.9 CHF 88.8 76.2 (10.6) 46.5 unprocessed audio 22.0 0 CE 91.7 76.2 (4.6) 59.6 CHF 90.5 80.4 (9.2) 60.5 unprocessed audio 35.4 +5 CE 92.4 78.9 (4.5) 68.8 CHF 91.3 82.7 (8.8) 70.8 unprocessed audio 50.7
Performance of the two loss functions on the RM-3000
dataset are found to follow the same trends as the experiments with GRID, even though this task is more challenging. Ap-plying paired comparisons using Tukey’s HSD [35], found the improvement of the hybrid CHF loss function over the CE loss function to be statistically significant (p<0.05) at both 5dB and 0dB, while at -5dB no statistical difference was found.
5. Conclusions
When applied to mask estimation, the conventional cross en-tropy loss function aims to maximise the accuracy of the mask. In this work, we proposed two new perceptually motivated loss functions that consider the HIT-FA rate as this has been shown to relate more closely to intelligibility than mask accuracy. The first loss function (HF) was based solely on maximising the HIT-FA rate and whilst this was achieved, ESTOI performance was generally lower than the CE loss function due to a larger number of false alarms being introduced. The second loss func-tion (CHF) aimed to combine maximisafunc-tion of mask accuracy and HIT-FA rate and was able to reduce the bias found within binary cross-entropy by adjusting the ratio between1s and0s inspired by HIT-FA. Evaluation on both small (GRID) and large (RM-3000) vocabulary datasets found that the proposed CHF loss function gave highest HIT-FA and ESTOI in the majority of test conditions, outperforming both CE and HF loss functions.
6. Acknowledgements
We wish to thank the UK Home Office – Centre for Applied Science and Technology, for supporting this work. The research presented in this paper was carried out on the High Performance Computing Cluster supported by the Research and Specialist Computing Support service at the University of East Anglia.
7. References
[1] J. Barker, L. Josifovski, M. Cooke, and P. D. Green, “Soft de-cisions in missing data techniques for robust automatic speech recognition.” inINTERSPEECH, 2000, pp. 373–376.
[2] J. Barker, M. Cooke, and P. D. Green, “Robust ASR based on clean speech models: an evaluation of missing data techniques for connected digit recognition in noise.” inINTERSPEECH, 2001, pp. 213–217.
[3] B. C. Moore,Cochlear hearing loss: physiological, psychological and technical issues. John Wiley & Sons, 2007.
[4] P. C. Loizou,Speech enhancement: theory and practice. CRC press, 2013.
[5] Y. Hu and P. C. Loizou, “A comparative intelligibility study of single-microphone noise reduction algorithms.”The Journal of the Acoustical Society of America, vol. 122, no. 3, pp. 1777–1786, 2007.
[6] H. Levitt, “Noise reduction in hearing aids: a review.”Journal of rehabilitation research and development, vol. 38, no. 1, p. 111, 2001.
[7] D. Wang and G. J. Brown,Computational auditory scene analy-sis: Principles, algorithms, and applications. Wiley-IEEE Press, 2006.
[8] A. S. Bregman,Auditory scene analysis: The perceptual organi-zation of sound. MIT press, 1994.
[9] M. Ahmadi, V. L. Gross, and D. G. Sinex, “Perceptual learning for speech in noise after application of binary time-frequency masks.”
The Journal of the Acoustical Society of America, vol. 133, no. 3, pp. 1687–1692, 2013.
[10] D. S. Brungart, P. S. Chang, B. D. Simpson, and D. Wang, “Iso-lating the energetic component of speech-on-speech masking with ideal time-frequency segregation.”The Journal of the Acoustical Society of America, vol. 120, no. 6, pp. 4007–4018, 2006. [11] N. Li and P. C. Loizou, “Factors influencing intelligibility of ideal
binary-masked speech: Implications for noise reduction.” The Journal of the Acoustical Society of America, vol. 123, no. 3, pp. 1673–1682, 2008.
[12] D. Wang, U. Kjems, M. S. Pedersen, J. B. Boldt, and T. Lun-ner, “Speech intelligibility in background noise with ideal binary time-frequency masking.”The Journal of the Acoustical Society of America, vol. 125, no. 4, pp. 2336–2347, 2009.
[13] K. Han and D. Wang, “A classification based approach to speech segregation.”The Journal of the Acoustical Society of America, vol. 132, no. 5, pp. 3475–3483, 2012.
[14] C. Valentini-Botinhao, Z. Wu, and S. King, “Towards minimum perceptual error training for DNN-based speech synthesis.” in IN-TERSPEECH, 2015, pp. 869–873.
[15] F. Weninger, J. R. Hershey, J. Le Roux, and B. Schuller, “Dis-criminatively trained recurrent neural networks for single-channel speech separation,” inSignal and Information Processing (Glob-alSIP), 2014 IEEE Global Conference on. IEEE, 2014, pp. 577– 581.
[16] H. Erdogan, J. R. Hershey, S. Watanabe, and J. Le Roux, “Phase-sensitive and recognition-boosted speech separation using deep recurrent neural networks,” in Acoustics, Speech and Signal Processing (ICASSP), 2015 IEEE International Conference on. IEEE, 2015, pp. 708–712.
[17] J. Chen, Y. Wang, and D. Wang, “A feature study for classification-based speech separation at low signal-to-noise ra-tios.” Audio, Speech, and Language Processing, IEEE/ACM Transactions on, vol. 22, no. 12, pp. 1993–2002, 2014.
[18] E. W. Healy, S. E. Yoho, J. Chen, Y. Wang, and D. Wang, “An algorithm to increase speech intelligibility for hearing-impaired listeners in novel segments of the same noise type.”The Journal of the Acoustical Society of America, vol. 138, no. 3, pp. 1660– 1669, 2015.
[19] G. Kim, Y. Lu, Y. Hu, and P. C. Loizou, “An algorithm that im-proves speech intelligibility in noise for normal-hearing listeners.”
The Journal of the Acoustical Society of America, vol. 126, no. 3, pp. 1486–1494, 2009.
[20] E. W. Healy, S. E. Yoho, Y. Wang, and D. Wang, “An algorithm to improve speech recognition in noise for hearing-impaired listen-ers.”The Journal of the Acoustical Society of America, vol. 134, no. 4, pp. 3029–3038, 2013.
[21] J. Chen, Y. Wang, and D. Wang, “Noise perturbation for super-vised speech separation.”Speech Communication, vol. 78, pp. 1– 10, 2016.
[22] Y. Wang and D. Wang, “Towards scaling up classification-based speech separation.” Audio, Speech, and Language Processing, IEEE Transactions on, vol. 21, no. 7, pp. 1381–1390, 2013. [23] R. Y. Rubinstein and D. P. Kroese, The cross-entropy method:
a unified approach to combinatorial optimization, Monte-Carlo simulation and machine learning. Springer Science & Business Media, 2013.
[24] R. Patterson, I. Nimmo-Smith, J. Holdsworth, and P. Rice, “An efficient auditory filterbank based on the gammatone function.” ina meeting of the IOC Speech Group on Auditory Modelling at RSRE, vol. 2, no. 7, 1987.
[25] B. Kollmeier and R. Koch, “Speech enhancement based on phys-iological and psychoacoustical models of modulation perception and binaural interaction.”The Journal of the Acoustical Society of America, vol. 95, no. 3, pp. 1593–1602, 1994.
[26] J. Tchorz and B. Kollmeier, “SNR estimation based on ampli-tude modulation analysis with applications to noise suppression.”
Speech and Audio Processing, IEEE Transactions on, vol. 11, no. 3, pp. 184–192, 2003.
[27] H. Hermansky and N. Morgan, “RASTA processing of speech.”
Speech and Audio Processing, IEEE Transactions on, vol. 2, no. 4, pp. 578–589, 1994.
[28] ETSI, “Speech Processing, Transmission and Quality Aspects (STQ); Distributed speech recognition; Advanced front-end fea-ture extraction algorithm; Compression algorithms.” ETSI STQ-Aurora DSR Working Group, ES 202 050 version 1.1.1, Oct. 2002.
[29] S. Furui, “Speaker-independent isolated word recognition using dynamic features of speech spectrum,” IEEE Transactions on Acoustics, Speech, and Signal Processing., vol. 34, no. 1, pp. 52– 59, Feb 1986.
[30] B. Hanson and T. Applebaum, “Robust speaker-independent word recognition using static, dynamic and acceleration features: Ex-periments with Lombard and noisy speech.” inAcoustics, Speech, and Signal Processing, 1990. ICASSP-90., 1990 International Conference on. IEEE, 1990, pp. 857–860.
[31] M. Cooke, J. Barker, S. Cunningham, and X. Shao, “An audio-visual corpus for speech perception and automatic speech recog-nition.” The Journal of the Acoustical Society of America, vol. 120, no. 5, pp. 2421–2424, 2006.
[32] D. Howell, S. Cox, and B. Theobald, “Visual units and confusion modelling for automatic lip-reading,”Image and Vision Comput-ing, vol. 51, pp. 1–12, 2016.
[33] P. Price, W. M. Fisher, J. Bernstein, and D. S. Pallett, “The darpa 1000-word resource management database for continuous speech recognition,” inAcoustics, Speech, and Signal Processing, 1988. ICASSP-88., 1988 International Conference on. IEEE, 1988, pp. 651–654.
[34] J. Jensen and C. H. Taal, “An algorithm for predicting the in-telligibility of speech masked by modulated noise maskers,”
IEEE/ACM Transactions on Audio, Speech, and Language Pro-cessing, vol. 24, no. 11, pp. 2009–2022, 2016.
[35] J. W. Tukey, “Comparing individual means in the analysis of vari-ance,”Biometrics, pp. 99–114, 1949.