JOHANN WOLFGANG GOETHE-UNIVERSITÄT
FRANKFURT AM MAIN
FACHBEREICH WIRTSCHAFTSWISSENSCHAFTEN
WORKING PAPER SERIES: FINANCE & ACCOUNTING
Raimond Maurer / Shohreh ValianiHedging the Exchange Rate Risk in International Portfolio Diversification:
Currency Forwards versus Currency Options
No. 109 June 2003
Raimond Maurer / Shohreh Valiani
Hedging the Exchange Rate Risk in International Portfolio Diversification: Currency Forwards versus Currency Options
No. 109 June 2003
ISSN 1434-3401
WORKING PAPER SERIES FINANCE AND ACCOUNTING ARE INTENDED TO MAKE RESEARCH FINDINGS AVAILABLE TO OTHER RESEARCHERS IN PRELIMINARY FORM, TO ENCOURAGE DISCUSSION AND SUGGESTIONS FOR REVISION BEFORE FINAL PUBLICATION. OPINIONS ARE SOLELY THOSE OF THE AUTHORS.
Hedging the Exchange Rate Risk in International
Portfolio Diversification:
Currency Forwards versus Currency Options
by
Raimond Maurer and Shohreh Valiani
June 2003
Raimond Maurer
Professor for Investment, Portfolio Management and Pension Finance, School of Business and Economics, Goethe-University Frankfurt/M., 60054 Frankfurt, Germany
e-mail: RMaurer@wiwi.uni-frankfurt.de; web: www.finance.uni-frankfurt.de
Shohreh Valiani (corresponding author)
Graduate Program “Finance and Monetary Economics”, School of Business and Economics, Goethe University, Frankfurt am Main, Mertonstr. 17-21, D-60054 Germany,
email: valiani@wiwi.uni-frankfurt.de; web: www.finance.uni-frankfurt.de
Keywords: International Portfolio Diversification, Currency Hedging, FX Derivatives, Short-fall Risk
JEL: F31, G11, G15
Abstract
As past research suggest, currency exposure risk is a main source of overall risk of interna-tional diversified portfolios. Thus, controlling the currency risk is an important instrument for controlling and improving investment performance of international investments. This study examines the effectiveness of controlling the currency risk for international diversified mixed asset portfolios via different hedge tools. Several hedging strategies, using currency forwards and currency options, were evaluated and compared with each other. Therefore, the stock and bond markets of the, United Kingdom, Germany, Japan, Switzerland, and the U.S, in the time period of January 1985 till December 2002, are considered. This is done form the point of view of a German investor. Due to highly skewed return distributions of options, the applica-tion of the tradiapplica-tional mean-variance framework for portfolio optimizaapplica-tion is doubtful when options are considered. To account for this problem, a mean-LPM model is employed. Cur-rency trends are also taken into account to check for the general dependence of time trends of currency movements and the relative potential gains of risk controlling strategies.
1 Introduction
Since 1973, the exchange rates of major currencies have been permitted to float freely against one another. This, along with increases in the volume of the world trade, has escalated the foreign currency risk. Compared to investments in domestic assets, fluctuating exchange rates represent an additional risk factor for investors who want to diversify their portfolios interna-tionally. Therefore, it is important to study whether hedging the exchange rate risk is worth-while and to which extent.
To effectively manage the currency risk, a variety of approaches have been employed, such as currency swaps, multi-currency diversification, and hedging via forwards, futures and options. The question now arises whether these hedging instruments provide different degrees of risk reduction and/or profit potential. There exist numerous studies which has discussed this issue by considering using currency forwards, especially from the viewpoint of U.S. investors. However, so far not much work has been done to examine the effectiveness of European op-tions in an ex-post and ex-ante framework. In this study, we compare the effectiveness of sev-eral hedging strategies based on two major hedging instruments, currency forwards versus currency options, from the perspective of German investors.
Jorion (1985, 1986), Eun/Resnick (1988, 1994), Levy/Lim (1994), and Bugar/Maurer (2002) have shown that if the investors would not control the uncertainty parameter of foreign cur-rency exposure, the potential gains from international portfolio diversification may not be enough to justify the expense of an international investment. Due to the high correlations among the exchange rate changes, much of the exchange risk may remain nondiversifiable in a multi-currency portfolio. Therefore it has been widely discussed that investors can con-ceivably eliminate much of the exchange rate risk by selling the expected foreign currency gains via derivatives on a currency-by-currency basis. Using the unitary forward hedge ratio strategy in order to hedge the exchange rate risk discussed by Eun/Resnick (1988, 1994)1, they
showed that such a strategy compared with the unhedged one, would reduce the volatility of the portfolio returns without a substantial reduction in average returns. Therefore they called it a costless strategy in terms of portfolio returns, since it just reduces the portfolio risk2. Adler/Prasad (1992) propose that investors can use the minimum variance hedge ratios (re-gression coefficients) that come from regressing the world market portfolio or any nation's stock market index on third currencies. Jensen's inequality guarantees that the hedge ratio will be the same for each national investor regardless of the numeraire currency. Glen/Jorion
(1993) compared the risk adjusted performance of optimally hedged portfolios by using cur-rency forwards with the unitary hedging strategy using Black's universal hedge ratio. They found that the optimally hedged portfolios performed best, but not statistically significantly better than the universal hedged strategy. Larsen/Resnick (2000) performed an ex-ante study comparing unhedged international equity investments, unitary hedging, an arbitrary estimate of 0.77 of Black's universal hedge ratio, and the universal regression hedge ratios of
Adler/Prasad (1992). They found that a unitary hedging forward strategy works better than the others. In an ex-post study, Jorion (1994) compared unhedged international investment versus three methods, uniquely estimation of the optimal hedge ratios separate from the assets
1 This is according to the theoretical work of Eaker/Grant (1990) and the empirical findings of Adler/Simon (1986). 2 Through the same approach, Black (1989, 1990) proposed a universal hedge ratio that is less than unity for equity
portfo-lios and is the same for all currencies and all national investors. His specific assumptions leading to universal hedge ratio have been criticized on various grounds.
optimization, the partial optimization in which the hedge ratios are optimized after a prede-termined position in the assets portfolio, and a joint optimization over the currencies and as-sets. Using the Sharpe ratio for portfolio performance as the evaluation criterion shows that the potential benefit of hedging via the joint optimization dominates the partial (separate) ones. Larsen/Resnick (2000) in an ex-ante study examined the different construction of inter-nationally diversified equity portfolios hedged against exchange rate uncertainty by the same methodology used in Jorion (1994) and their results show that the performance of a unitary hedging strategy is the best among all the other strategies.
Although there exist many empirical studies on forward contracts to hedge the currency risk, the evidence for other types of derivatives like options are not much. Hsin/Kuo/Lee (1994) and Conover/Dubofsky (1995) worked on the use of American options where they found that protective puts dominate fiduciary calls. Following this line of research, this study investi-gates the potential benefit of international portfolio diversification by comparing the hedging effectiveness of currency forwards versus currency options. In contrast to other studies we use an portfolio optimization framework and do not use the classical mean/variance approach, as the research framework of rational financial decision-making under risk. The basic limitation of such an approach is the lack of a satisfactory choice-theoretic foundation: The mean/variance framework requires either quadratic utility functions or symmetric return dis-tributions. Neither assumption is in empirical situations necessarily correct. A quadratic utility function could be inappropriate, because it implies decreasing marginal utility of wealth and increasing absolute and relative risk-aversion. Both is criticized from a descriptive, as well as from a normative, perspective (see among others, Hanoch/Levy 1970; Fishburn 1977, 1984;
Weber 1990 and Sarin/Weber 1993). The non-linear pay-off characteristic of options lead to complex, distinctly asymmetrical return distributions with significant moments beyond mean and variance using the classical mean/variance framework would lead to biased results3. In
addition, the empirical observation on the stock indices approves the existence of asymmetric distributions for equity markets with higher moments which are statistically significant from the bell-shaped measures.
In order to avoid these critical assumptions a mean/shortfall-risk framework for rational fi-nancial decision-making in the asset allocation context is adopted in this study. Shortfall-risk measures formulate the (downside-) risk as a probability-weighted function of negative devia-tions from a predetermined target. These risk measures, which explicitly reflect the asymme-try of the probability distribution of asset returns, have attracted considerable interest in the more recent literature on portfolio diversification (e.g. Harlow 1991). The mean-LPM analy-sis has reasonable computational possibilities along with a fair degree of compatibility with the primary concerns expressed by investment managers. Additionally, the mean-LPM shows a satisfactory choice-theoretic foundation since it is consistent with utility functions reflecting the preferences of decision maker towards risk for below-target returns and it satisfies the stochastic dominance measurement which is a well-known criterion for the policy makers in uncertainty situations.
The next section explains the data. Following that, the methodology is briefly described in section three, where the optimal hedging schemes for currency futures and currency options are also outlined. Then the results of the ex-post analysis will be introduced in section four. In section five the existence of improvements is checked in an ex-ante framework and different strategies are compared. The final section summarizes the article.
2 Data
Equity and government bond markets in five countries have been considered, United King-dom, Switzerland, Japan, Germany, and the United States which are also the most important financial markets in an international setting. Portfolio performance is examined at monthly intervals, based on portfolio values, spot exchange rates, and one-month forward rates as well as one month currency put options. The full period runs from first month 1985 to December 2002. The equity returns under consideration are computed from total return stock indices compiled by Datastream global index and adjusted for capital gains as well as dividend pay-ments paid during the holding period. The indices for each country represent portfolios of all listed firms, included in the industry proportions that reflect industry composition in the local market. Each of the indices are value weighted, formed from major companies based on mar-ket capitalization. The bond indices are the Datastream government bond indices which repre-sent the total return of the bond markets in local currency, and are value-weighted indices of bonds with at least one year to maturity. The forward contracts are contracts for the British Pound, Swiss Franc, Japanese Yen and US Dollar with respect to the German Mark with a maturity of one month.4 For options, due to the lack of data the theoretically currency option
time series following the Garman/Kohlhagen (1983) approach have been computed.
The first four moments of local returns in stock and bond markets have been presented in ta-ble 1 which not only gives the information on the average rate of returns in the both markets but also helps to discover the type of the probability distribution of the market's return (the returns are monthly percentage log returns). The average rate of return and the volatility of stock indices as it is already expected, indicates the substantially higher mean return than in the bond markets. Government bonds yield at most 0.84 percent (in United Kingdom), where the lowest average returns of stock markets would reach the level of 1.18 percent (in United Kingdom).
Table 1: Descriptive Statistics of Individual Stock and Bond Markets
UK Switzerland Japan Germany USA
Stock Index Excess Returns
Average Returns 1.03 1.10 0.25 0.80 1.13 Standard Deviation 4.83 5.13 5.88 5.93 4.65 Skewness -0.89 -1.08 0.07 -0.76 -0.80 Kurtosis 3.68 3.11 0.77 1.65 2.05 J/B 151.02 128.82 5.56 45.21 61.11 P 0.00 0.00 0.06 0.00 0.00
Bond Index Excess Returns
Average Returns 0.83 0.44 0.48 0.57 0.74 Standard Deviation 1.81 0.96 1.31 0.96 1.41 Skewness -0.04 -0.06 -0.56 -0.48 0.02 Kurtosis 1.39 0.54 1.73 -0.12 0.03 J/B 17.64 2.71 38.29 8.58 0.02 P 0.00 0.26 0.00 0.014 0.98
Notes: The table contains summary statistics for monthly returns on the stock and bond indices in our sample. Mean returns and standard deviations are in percentages. Skewness and excess of kur-tosis respectively represents the third and forth central moments of the rates of return. These mo-ments can sometimes be examined to provide an informal check of normality; the excess kurtosis of a normal distribution is zero. Jarque-Bera associated with the P-value gives the test for normal-ity of the returns. Returns are calculated from 216 observations for the time period of January 1985 until December 2002.
The degree of skewness and the excess-kurtosis indicates that all the stock markets except for Japan, are left skewed and have a significantly positive excess-kurtosis which means the fatter tails than normal distribution. In the bond market except for Germany and Japan the negative skewness is not much and the excess-kurtosis is slightly different from zero.
According to the statistics, the stock markets have the probability distribution which is known technically as leptokurtic distribution. In the case of the bond markets the normality distribu-tion also would not be fit. These results are statistically confirmed by computing the statistical test of Jarque/Bera (1987) for the null-hypothesis of normality. The existence of a normal distribution for all the stock markets can be rejected at the significance level of 5%. In the case of bond markets, the empirical results show that the normal distribution also would not be accepted for the USA bond market at the significance level of 1% and for all the others at the significance level of 5%. Therefore the existence of a symmetric international portfolio return distribution, which is one of the base assumptions for using the mean-variance optimi-zation, in all the cases would not be satisfied5.
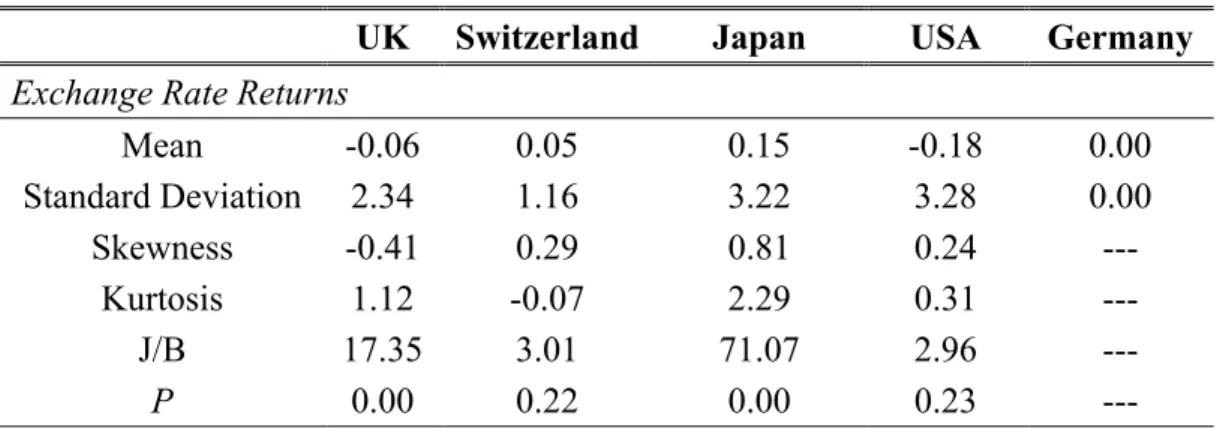
Additionally as it shows in table 2, in an international portfolio framework when we look at the foreign exchange rate returns, the normality assumption for currency markets would be rejected for Switzerland and USA at the significance level of 1% and for the others at the sig-nificance level of 5%. The statistics of foreign exchange return shows that these markets are also skewed with a kurtosis of less than 3 for Swiss Franc and greater than 3 for the others,
5 To use the mean-variance framework requires either the symmetric return distribution or the quadratic utility function,
which means the return distribution of these markets also contains a deviation from the nor-mal distribution.
Table 2: Descriptive Statistics of Currency Exchange Markets
UK Switzerland Japan USA Germany
Exchange Rate Returns
Mean -0.06 0.05 0.15 -0.18 0.00 Standard Deviation 2.34 1.16 3.22 3.28 0.00 Skewness -0.41 0.29 0.81 0.24 --- Kurtosis 1.12 -0.07 2.29 0.31 --- J/B 17.35 3.01 71.07 2.96 --- P 0.00 0.22 0.00 0.23 ---
Notes: The table contains summary statistics for monthly returns on the currency exchange rate in our sample. Mean returns and standard deviations are in percentages. Skewness and excess of kur-tosis respectively represents the third and forth central moments of the rates of return. These mo-ments can sometimes be examined to provide an informal check of normality; the excess kurtosis of a normal distribution is zero. Jarque-Bera associated with the P-value gives the test for normal-ity of the returns. Returns are calculated from 216 observations for the time period of January 1985 until December 2002.
3 Methodology: International Asset Allocation in a
Down-side Risk Framework
3.1 Portfolio Optimization Process in a LPM - Framework
The aim in an international portfolio optimization is determining the most favorable combina-tion of assets such that the portfolio is dominant on the others with a minimum risk at all lev-els of expected return. The concept of downside risk is goes back to Roy (1952) in the form of "safety first" rule. Markowitz (1952) formalized his seminal portfolio theory based on the semi-variance, defined as the squared deviation of return below a target return. Bawa (1975) generalized the semi-variance measure of risk to reflect a less restrictive class of decreasing absolute risk-averse utility function which called Lower Partial Moment or LPM. The com-mon classes of LPM are the probability of loss (n = 0), the target shortfall (n = 1), the target semi-variance (n = 2) and the target skewness (n = 3)6. The variable n can also be viewed as a
measure of risk aversion where the degree of risk aversion increases with n7. Therefore this
definition can be generalized into n-order LPMs to cover a range of risk measures as:
(1)
∫
−∞ − = τ τ τ, ) ( ) ( ) ( n i i i n R R dF R LPMwhere τ is "target return", Ri is the random return of asset i and dF(Ri) is the probability den-sity function of return on asset i and n is the order of moment that characterizes the investor preferences of return dispersion below the target rate of return. Risk, as measured by the n
6 For more details see Bawa (1975, 1977).
7 In other words, a more risk averse investor (n = 3) prefers less risk than a less risk-averse investor (n = 1) for the same
LPM reflects explicitly the asymmetry of the probability distribution of asset returns. As
Fishburn (1977) shows this concept accurately reflects the decision maker's preferences be-tween the combination of risk and return of a portfolio. Additionally the induced efficient set of this model strongly satisfies the stochastic dominance criteria8 which is a well-known tool
for investment decision evaluation and fits with several types of utility functions.
The algorithm of optimal investment for downside risk-averse investor in the downside risk asset allocation framework, based on the assumption of no short-selling was proposed by
Harlow/Rao (1989) and Harlow (1991). Formally, the problem is to select an optimal mixes of assets such that the probability of the achieved portfolio return (Rp) falling below the target rate of return (τ) would be minimized. This algorithm is defined as:
∑
∑
= = − = T t N i n it it i n xi LPM x T 1 1 x R } ) ( , 0 max{ 1 ) , ( min τ τ (2) subject to p N i i i i x R R x C∑
= =1 1( ): 1 : ) ( 1 2∑
= = N i i i x x C N i xi ≥0, =1,2,...,where T is the number of observed periods, Ri is the mean return on the asset i over all peri-ods, Rp is the predetermined portfolio return and xi is the optimal weight of portfolio allocated to asset i. In addition, short sales were excluded because many institutional investors like in-surance companies, mutual and pension funds are restricted in this regard. In this study the risk measure is the first order lower partial moment of downside risk which accords to n = 1 (mean-LPM1). This would give a higher risk preference threshold in the optimization process to the international investor which gives a more general feature to our study and it is more concrete with the choice between the combination of the shortfall risk and the portfolio ex-pected returns.
The target τ is considered as the risk-free interest rate in the home country which has a good economic intuition for the international investor. Assume that the international investor uses the Deutsche Mark as his/her numeraire currency. Yet the Ri is the converted national return to the numeraire currency (German DM), for each financial market, from time t to time t+1:
f f i f f i i R e R e R = , + + , ⋅ (3)
where Ri,f is the local currency rate of return on the ith asset during one time interval in the foreign country, ef = (SXt+1 - SXt) / SXt is the rate of appreciation (depreciation) of the related foreign currency market against the DM, and SXt is the spot exchange rate of foreign financial market against German DM. Based on this equation it can be easily seen that the total portfo-lio performance is exposed to the changes in risk and returns of both, the local security market
8 The efficient set of this model for n=0 is a subset of the First Stochastic Dominance efficient set, for n=1 is a subset of the
Second Stochastic Dominance efficient set and for n= 2 is a subset of the Third Stochastic Dominance efficient set,
and the currency exchange rate market. Therefore an appropriate currency hedging strategy becomes highly important for the international investors.
3.1 Currency Hedging with Forwards
First we use a currency forward contract to hedge the exchange rate risk. A currency forward contract is an agreement between two parties to buy (long position) or sell (short position) foreign currency with current spot price , at a future date and at an exchange rate (the forward price), determined at the time of the transaction
SX F
9. The forward premium10 can be
de-termined as f =F/S−111.
As with many other kinds of financial derivatives, currency forward contracts are offered by commercial banks and/or traded on organized financial markets, and typically have short ma-turities of one to nine months. Neglecting margin requirements, currency forward contracts produce a random payoff, but do not absorb capital upon closing of the position. The financial success from a forward short position offsets possible gains and losses from currency fluctua-tions on the investment in the foreign stock market. Now if the German investor wants to hedge through forwards, he has to determine simultaneously the optimal portfolio weights and the hedge ratios for each asset. For this purpose equation (3) has to be replaced by:
(4) ) ( , ,f f i f f i f i h i R e R e h f e R = + + ⋅ + −
where f represents the forward premium and hi represents the hedge ratio,12which determines the amount of the initial value of investment, should be sold forward. Through solving the optimization for the given target, the weights of investment in different markets (N investment weights) and the optimal hedge ratios (N-1) will be determined13. The optimal investment
weight normally depends on the hedge ratio which by itself depends on the currency market. For the purpose of having no speculation position on the forward contracts - many regulated institutional investors like insurance companies, mutual and pension funds are restricted in this regard - one should consider that:
0 ≤hi≤ 1 (5)
To compare the optimal hedge ratios with an unhedged strategy, we would also optimize the above equation for hi = 0.
3.2 Currency Hedging with Put Options
In order to use the currency option as a hedging instrument - which gives the investor (holder) the right (an optional guarantee), but not the obligation, to buy or sell a specific amount of currency at a specific exchange rate (the strike), on or before a specific future date - a pre-mium would be required. Therefore the currency option compare to forwards is a costly hedge
9 Cf. Abken/Shrikhande (1997), p. 37. 10
If the interest rate parity (IRP) 1+ f =(1+r)/(1+rf) holds, then the forward premium (domestic currency units per for-eign currency unit) f = F/S -1 , represents the difference between the nominal zero-coupon default free interest rates (i.e. the risk-less interest rate) with the same maturity as the forward contract of the domestic (r) and the foreign (rf) country.
11 When the forward premium is negative, it is referred to as a forward discount.
12 Alternatively investors can hedge the exchange risk via borrowing in the international money market, for more detail refer
to Eun/Resnick (1988).
instrument which also gives more flexibility than traditional forwards. Besides, the holder of the option would achieve four alternatives as; when, whether and how much to exercise plus the right to choose the strike price of the contract. The two important key features of the cur-rency option are first, its insurance protection and second, its profit potential. Through paying a premium by the holder to the writer (seller) of the option, a fixed exchange rate, required by the option holder would be guaranteed. On the other hand, hedging with an option will elimi-nate any chance of currency loss where the only outflow of funds would be the premium payment. Therefore, if the currency market movement is in the holders favor and upside po-tential is available, the option will be abandoned and the holder have the chance to enter into a spot deal when, if the movement is against the holder, the option will be "exercised" at the previously agreed rate. Thus an option profile exposes an "asymmetric risk". The most that a holder can lose is the option premium and the most that he can profit is limited only by how far the market moves.
To compare the two hedging products it can be pointed out that; first, currency option will give "the right" to sell (or to buy) the underline asset. Second, there would be "no obligation" to deliver or receive the currency at the strike rate. Third, it "eliminates downside risk whilst retaining unlimited profit potential" and finally it is a "perfect hedge tool for variable expo-sures", but can be expensive. While in forwards there exist "the obligation" to sell (or to buy) the underlying. Therefore, on one hand the unlimited amount of loss can be possible (as the forward ties the client into a fixed rate), and on the other hand it "eliminates all downside risk but allows no up-side potential" at all. So one can say that forwards compared to options are rigid hedge tools for the variable exposures.
In this study, we look at the European currency put option14 in order to determine the optimal
hedge ratio which gives the investor the right to sell the foreign currency at the predetermined exchange rate and will eliminate the downside risk of the currency movements.
There is no sample data for currency puts, therefore in order to calculate the returns of put options, first by using the Garman/Kohlhagen (1983) formula, the theoretically put premiums have been computed. Then the pay-off for at the money, in the money and out of the money put options would be first subtracted and then divided by the corresponding premiums15and
then the returns would be achieved. Pricing models for European currency options have been derived by Biger/Hull (1983), Garman/Kohlhagen (1983) under the assumption of a geomet-ric Brownian motion for the underlying foreign currency exchange rates, in which puts of the European type would be computed by:
) 2 ( )) ( exp( ) 1 ( )) ( exp( r T t d K r T t d SX Pt =− t − f − Φ − + − − Φ − (6) where t T t T t T r r K SX d t f + − − − − + = σ σ (1/2) ) ( ) / ln( 1 and
14 Going short in currency calls also can be considered, but here in order to consistency with "no short-selling" constraint, we
just discuss on going long in currency puts which of course in each case the constraints in optimization procedure have to be normalized.
t T t T t T r r K SX d t f − − − − − + = σ σ (1/2) ) ( ) / ln( 2
where SXt, is the spot exchange rate at time t, r and r are respectively risk free rate in the local (Germany) and foreign country,
f
K is the strike price, T- t is the time to maturity and σ
is the volatility of the log of spot rates. Therefore, is the price of a European put option in the local currency (German DM) to sell one unit of the foreign currency exchange rate for a predetermined strike price that matures at time T.
t
P
To be concrete in our study in order to compare the effects of two different hedge tools - fu-tures and put options - we compute the put premiums base on having one month as the time to maturity. Strike price which has also a direct effect on the total pattern of puts return, has been considered in three different amounts. So a general overlook on the effects of different types of European puts would be given by considering, put at the money option, in and, out of the money option. For the at the money put option, the strike price equals to spot rate of cur-rency exchange at the beginning of each month. This for in the money puts equals to five per-cent higher than the related spot exchange rate at the beginning of each month and finally for out of the money put option, the strike been considered as one percent lower than the re-spected currency spot exchange rate. Of course these strikes are arbitrary and the same analy-ses can be built on the other amounts of strike price or time to maturity16.
The pay-off for currency put options at maturity is given by max (K - SX, 0). This would be first subtracted and then divided by the corresponding put premiumsto get the return of such a position:
= (max [(K - SX), 0 ] - P]) / P (7)
p o
R
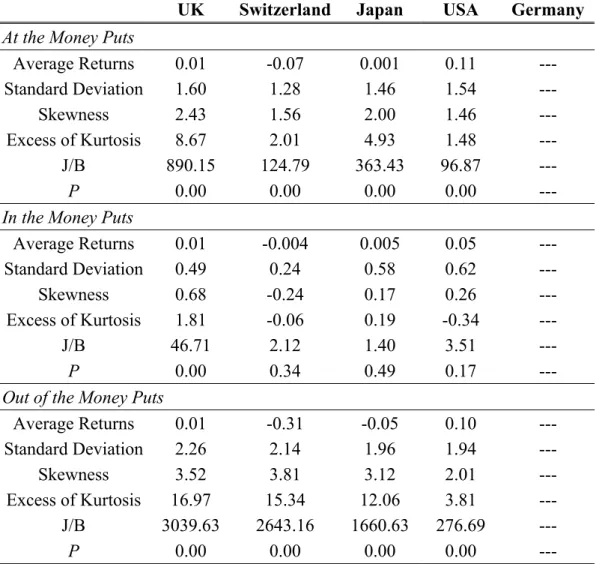
As it is already expected in table 3, one can see that the returns distribution of different types of put options, at the money, in the money, and out of the money put options are asymmetri-cally distributed. The positively skewness of these returns are indicating that the losses due to using put options as a risk insurance would be smaller and the gains magnitude would be lar-ger17.
Hence, adding this type of assets to the international portfolio would definitely induce into an asymmetric total expected return and therefore the optimization under the lower partial mo-ments methodology would satisfy both the theoretical and the empirical features of our study. The converted national return Ri for each financial market in one time interval will be still equal to: f f i f f i i R e R e R = , + + , ⋅ (8)
where here Ri contains not only the local currency rate of returns of assets but also contains the local currency rate of returns of the related put options. Therefore now, for international portfolio manager each time there will be N+4 assets which have to be decided to be
16 Notice that we did not considered the five percent out of the money European put options due to the very small put
premi-ums for this type of options which results mostly in zero return and therefore would not have any additional role in our analysis due to the zero weights.
17 When the skewness of an asset return distribution is negative (left skewed), the downside returns will occur in larger
mag-nitudes than the upside returns; i.e., losses when they occur will tend to be large losses; And when the skewness of the dis-tribution is positive (right skewed), the upside returns will occur in larger magnitudes than the downside returns (when losses occur, they will be smaller and when gains occur, they will be greater).
mally invested in18. To normalize the algorithm of the international asset diversification in
order to be no-speculation in trading the currency puts, we have to customize our restrictions. Thus the optimal weights of puts for each currency should be less or equal to the amount of stocks and bonds invested in the respective market.
) / ( * O O B S x x SX P x( +( ≥ ( ( (9)
where x(S, x(B and x(O are the optimal weights of investment in each foreign stock, bond and currency option markets, P(O represents the puts premia in the local currency (German DM) and SX is the currency spot exchange rate19.
In the optimization, different types of puts will be analyzed separately in order to see which kind of put options would be more beneficial for the investor as a controlling tool for his/her currency exposure risk.
18 This, in the case of using some combination of puts will be different, e.g. if the investor want to use both put at the money
option and in the money option then has to decide on N+8 assets to optimally been invested in.
Table 3: Currency Put Options Returns
UK Switzerland Japan USA Germany
At the Money Puts
Average Returns 0.01 -0.07 0.001 0.11 --- Standard Deviation 1.60 1.28 1.46 1.54 --- Skewness 2.43 1.56 2.00 1.46 --- Excess of Kurtosis 8.67 2.01 4.93 1.48 --- J/B 890.15 124.79 363.43 96.87 --- P 0.00 0.00 0.00 0.00 ---
In the Money Puts
Average Returns 0.01 -0.004 0.005 0.05 --- Standard Deviation 0.49 0.24 0.58 0.62 --- Skewness 0.68 -0.24 0.17 0.26 --- Excess of Kurtosis 1.81 -0.06 0.19 -0.34 --- J/B 46.71 2.12 1.40 3.51 --- P 0.00 0.34 0.49 0.17 ---
Out of the Money Puts
Average Returns 0.01 -0.31 -0.05 0.10 --- Standard Deviation 2.26 2.14 1.96 1.94 --- Skewness 3.52 3.81 3.12 2.01 --- Excess of Kurtosis 16.97 15.34 12.06 3.81 --- J/B 3039.63 2643.16 1660.63 276.69 --- P 0.00 0.00 0.00 0.00 ---
Notes: The statistics are derived by using the monthly data of spot currency exchange rates time series for English Pond, Swiss Franc, Japanese Yen and US dollar against the German Deutsche Mark during the time period of January 1985 till December 2002. Notice that computed premiums have the adjusted historical volatility in each three years time interval. For having the percentage of average returns and the percentage of the volatility these results should be multiplied by 100. Skewness and excess of kurtosis respectively represents the third and forth central moments of the European put option returns. Jarque-Bera associated with the P-value gives the test for normality of the returns.
Here as we can see currency option - as an alternative hedge tool for the currency exposure risk - also shows a significant level of skewness and excess-kurtosis, which leads us to the rejection of the existence of a bell-shaped, symmetric distribution of the currency put option returns. So this also confirms that using the Markowitz mean-variance framework would lead us to the biased estimations and to avoid that we have to customize the mean/LPM framework where risk has been measured by going shortfall.
4 Ex-Post Analysis of the Potential Gains of International
Portfolio Diversification and Hedging the Currency Risk
4.1 Hedging Policies and Mean/LPM-Efficient Frontiers
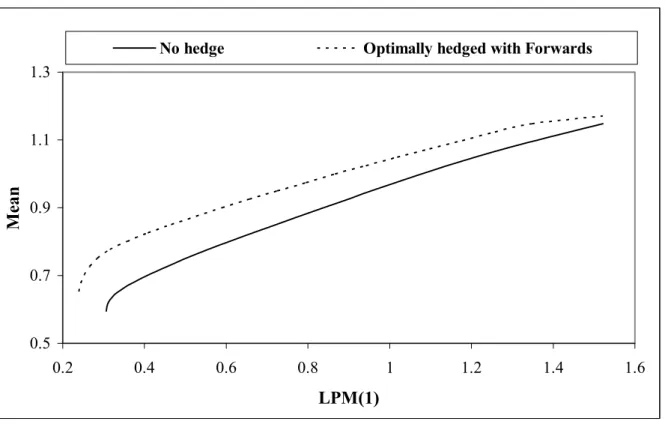
In this part we examine the impact of the two different hedging instruments, forwards and options, by comparing the risk/return characteristics of using these two instruments with the unhedged portfolio selection. Therefore the optimization problem in equation 4 is solved by using the input data, presented in tables 1, 2, and 3. For the case of using forwards, the un-hedged and optimally un-hedged mean/LPM1-efficient frontiers are plotted in figure 1. The same has been done for the currency options20 and the respective frontiers are shown in figure 2 for
put at the money, in the money, and out of the money options. Finally, figure 3 exhibits the relations between hedging by forwards and in the money put options.
Figure 1: Shortfall Risk and Return for International Efficient Portfolios – Unhedged and Optimally Hedged with Currency Forwards
0.5 0.7 0.9 1.1 1.3 0.2 0.4 0.6 0.8 1 1.2 1.4 1.6 LPM(1) Mea n
No hedge Optimally hedged with Forwards
From figure 1 it can be seen that for using forwards as hedging instrument, the optimally hedged efficient frontier clearly dominates the unhedged one. The lowest amount of shortfall expectation in the unhedged case is 0.31, while it is 0.24 for the optimally hedged case with forwards. For all levels of risk, the international frontier represents higher levels of mean re-turn whenever the investor hedges his/her currency exposure by using forwards. It is also ob-vious that hedging with forwards provides higher benefits, in terms of higher mean returns relative to the unhedged case for the low and medium risk portfolios, rather than for the high risk portfolios.
20 Noticed that by construction of the model, there cannot be any full hedge for currency puts since they are treated as assets,
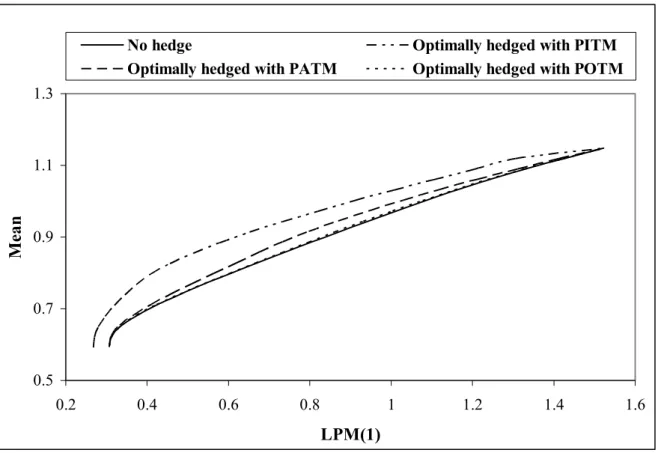
Regarding the different hedging strategies with put options, figure 2 shows that, while all (in/at/out of the money) put option strategies result in dominant efficient frontiers compared to the unhedged case, the in the money put options indicate the largest vertical shift of the frontier relative to the unhedged one. I.e., from the ex-post point of view, in the money put options provide the best hedging instrument among all the other types. The lowest amount of shortfall expectation for in the money put options as hedging instrument is 0.27. Considering frontiers, also show that there is not much difference between the results of optimal hedging with at the money and especially with out of the money put options compared to unhedged frontier. This is due to the low average observed return of at and out of the money put options which itself is dependent on the spot currency trends of our sample. Therefore, it arises the question on the degree of currency time trend effects on using options as hedge tools which later on will be discussed.
Figure 2: Shortfall Risk and Return for International Efficient Portfolios – Unhedged and Optimally Hedged with Currency Put Options
0.5 0.7 0.9 1.1 1.3 0.2 0.4 0.6 0.8 1 1.2 1.4 1 LPM(1) Mea n .6
No hedge Optimally hedged with PITM
Optimally hedged with PATM Optimally hedged with POTM
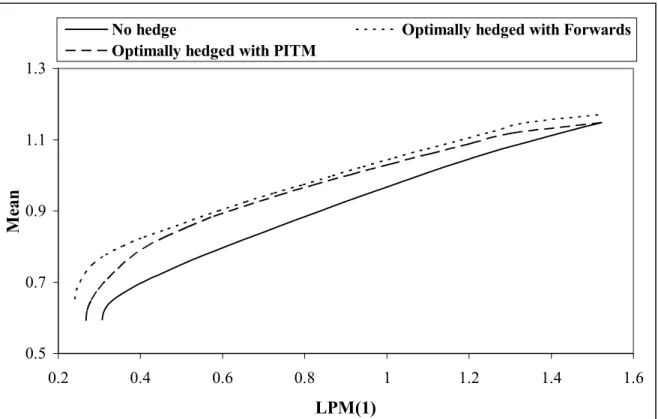
Comparing the hedging effectiveness of forwards and in the money put options, as has been done in table 3, shows that the forwards bring a better hedge performance for all possible portfolios than the in the money put options. However, while the additional benefits in terms of additional mean returns from the forwards hedging relative to the in the money put option hedging is relatively high for low risk portfolios, there are no big differences for the two hedging instruments regarding medium and high risk portfolios
To check the stability of these results in order to implement them in portfolio management, in the following we will have to look at these strategies in an ex-ante framework. Additionally in order to check for the effects of currency trends in using options we will make sub-sample analysis and see how the different types of options can better off the international investor during different financial cycles.
Figure 3: Shortfall Risk and Return for International Efficient Portfolios – Unhedged and Optimally Hedged with Currency Forwards and Optimally Hedged
with Currency Put In the Money Options
0.5 0.7 0.9 1.1 1.3 0.2 0.4 0.6 0.8 1 1.2 1.4 1.6 LPM(1) Me an
No hedge Optimally hedged with Forwards
Optimally hedged with PITM
4.2 Portfolio Compositions and Performance of the Different
Strategies
In order to gain a more precise view of the extent of the diversification potential of the two types of hedging instruments, this section analyzes two selected portfolios in more detail: the minimum risk portfolio (MRP) and tangency portfolio (TP). MRP stands for the portfolio which gives the minimum level of risk, in terms of shortfall expectation. TP represents the portfolio for which the Sortino-ratio21 has been maximized, i.e. the portfolio with the highest
risk adjusted return. In this sense, the percentage of the monthly mean returns and shortfall expectations of the MRP and TP are provided in the following tables 4 and 5. Finally all strategies were evaluated by LPM measure and the related Sortino-ratios, respectively.
The results tabulated in tables 4 and 5, confirm those findings from the efficient frontier analyses in the previous section. Considering first the MRP, it is obvious, that the optimal hedge with currency forwards provides the best MRP, i.e. the MRP with the lowest risk (LPM). Also, the optimal hedge with in the money currency put option provides a consider-able risk reduction relative to the unhedged MRP. However, the risk reduction of the LPM through currency forwards is of more extend. While the currency forward provides a decrease in risk relative to the unhedged MRP of about 21% the risk reduction through the in the money put option is only about 13%. Also interesting, while the risk reduction through the optimal hedge with currency forwards is accompanied by an increase in mean return, the
21 The Sortino-ratio, SR = (E(R
p)-rf) / LPM1, for mean/LPM optimization is similar to the Sharp-ratio in the mean/variance framework and was introduced by Sortino/Price (1994). Sortino/van der Meer (1991) described the downside deviation (below target semi-deviation) and the reward to semi-variability ratio (R/SV) as criteria for capturing the essence of down-side risk. Sortino continued contributing in the area of performance measurement, e. g. Sortino/Price (1994), which are all following to the Roy (1952) safety-first technique and computed by maximizing a reward to variability ratio.
timal hedge with in the money put options has no effect on the mean return of the MRP. This also explains the considerable increase in the Sortino-ratio when one optimally hedges with currency forwards. Finally, using at the money and out of the money currency put options has no effect on the MRP, i.e. here the option weights are zero.
Table 4: Ex-post Risk/Return Profiles of the MRP and TP – Unhedged and Optimally Hedged with Currency Forwards
Unhedged Optimally Hedged with Forwards
Mean LPM SR Mean LPM SR
MRP 0.596 0.306 0.520 0.650 0.241 0.898 TP 0.687 0.386 0.650 0.742 0.273 1.099
Notes: The table provides the mean return (in % p.m.), the first order lower partial moments (in % p.m.) to the risk free interest rate as target, and the Sortino-ratio of the different strategies in the ex-post framework. MRP represents the in-ternational minimum risk portfolio and TP is the inin-ternational tangency portfolio. Results are computed by using the whole sample of observation from January 1985 until December 2002.
Table 5: Ex-post Risk/Return Profiles of the MRP and TP – Optimally Hedged with Currency Put Options
Optimally Hedged Optimally Hedged Optimally Hedged with PATM with PITM with POTM
Mean LPM SR Mean LPM SR Mean LPM SR
MRP 0.596 0.306 0.520 0.596 0.267 0.579 0.596 0.306 0.520 TP 0.687 0.386 0.650 0.686 0.325 0.769 0.688 0.386 0.651
Notes: The table provides the mean return (in % p.m.), the first order lower partial moments (in % p.m.) to the risk free interest rate as target, and the Sortino-ratio of the different strategies in the ex-post framework. MRP represents the international minimum risk portfolio and TP is the international tangency portfolio. Results are computed by using the whole sample of observation from Janu-ary 1985 until December 2002.
Considering the TP, again the optimal hedge with at the money and out of the money put op-tions has nearly no effect on TP performance compared to the unhedged case. On the other hand the use of currency forwards as hedging instrument, results in a substantial increase in TP performance compared to the unhedged case. This increase is induced by an increase in mean return and a decrease in risk. The same, however to lower extend, can be observed for the optimal hedged TP using in the money currency put options. The TP performance, when hedged with in the money options, is also clearly higher than the unhedged TP. However, also in the case of the TP, the forwards provide a better hedge than the put options.
All in all, from the ex-post point of view, there exist clear risk reduction and performance improvement potentials for a German investor, through optimally hedging with currency for-wards or (in the money) currency put options.
In table 6, asset weights and hedge-ratios for the respective hedged and unhedged MRPs and TPs are tabulated. Starting with the MRP, the unhedged strategy consists mainly of German Bonds (87.05% of the total wealth). Although there are also investments in the other bond and stock markets, the investment weights for these markets are relatively low.
Table 6: Optimal Portfolio Weights and Hedge Ratios for Several Hedged and Unhedged MRPs and TPs
Stock Markets Bond Markets Derivative Markets
UK CH JP USA GER UK CH JP USA GER UK CH JP USA GER Unhedged Portfolio Strategies
MRP 0.00 2.99 0.00 1.67 0.78 0.40 5.14 1.01 0.96 87.05 - - - -
-TP 0.00 15.27 0.00 0.18 0.00 12.89 0.00 0.00 0.00 71.66 - - - -
-Optimally Hedged Portfolio Strategies with Forwards
MRP 0.00 4.69 0.00 0.42 2.10 0.00 25.50 27.39 13.05 26.85 - - - - -(0.00) (89.90) (0.00) (33.40) (-) (0.00) (98.57) (100.00) (100.00) (-) - - - - -TP 0.00 10.04 0.00 0.91 0.00 4.93 4.62 44.24 27.22 8.04 - - - - -(0.00) (100.00) (0.00) (100.00) (-) (0.00) (100.00) (100.00) (100.00) (-) - - - -
-Optimally Hedged Portfolio Strategies with PATM (Optimal Weights of PATM)
MRP 0.00 2.99 0.00 1.66 0.78 0.40 5.14 1.02 0.96 87.05 0.00 0.00 0.00 0.00
-TP 0.00 15.27 0.00 0.18 0.00 12.89 0.00 0.00 0.00 71.66 0.00 0.00 0.00 0.00
-Optimally Hedged Portfolio Strategies with PITM (Optimal Weights of PITM)
MRP 0.41 3.73 0.00 1.03 0.93 0.05 23.16 18.22 19.85 29.57 0.00 1.10 0.91 1.04
-TP 0.00 8.21 0.00 5.33 0.00 17.20 0.00 0.00 4.81 63.08 0.86 0.00 0.00 0.51
-Optimally Hedged Portfolio Strategies with P0TM (Optimal Weights of POTM)
MRP 0.00 3.32 0.00 1.42 0.76 0.42 5.86 1.45 1.18 85.56 0.00 0.03 0.00 0.00 -
TP 0.00 15.26 0.00 0.19 0.00 12.87 0.00 0.01 0.00 71.66 0.00 0.00 0.00 0.01 -
Notes: The table contains the optimal weights for the different stock and bond markets for the several optimal hedged and unhedged MRPs and TPs from the viewpoint of a German investor that initially invests in the U.K., Switzerland, Japan, U.S. and his/her home country. Weights are reported in percentage and the values in parenthesis are the percentage optimal forward hedge ratios. MRP represents the minimum risk portfolio and TP is the tangency portfolio. Results are computed by using the whole sample of observation from January 1985 until December 2002.
Appling an optimal hedge with forwards results in a much more diversified portfolio. This optimal hedged MRP portfolio, exhibits substantial weights for the Swiss, Japanese, US, and German Bond Markets (together 92.79% of total wealth). Not surprisingly, the investment weights for the respective stock markets are still low. A similar diversification can be ob-served for the MRP that is optimally hedged with in the money put options. Also this portfo-lio has substantial weights on four of the five bond markets, while the amount of investment in the stock markets is still low. The other two put option hedging strategies result in nearly or exactly the same investment weights like the unhedged MRP, again indicating, that hedging via at and, out of the money options cannot improve the MRP of the German investors.
Considering the TP, it is interesting that the unhedged TP is relatively undiversified. Like for the unhedged MRP, the highest investment weight is given to German Bonds (71.66%). UK Bonds and Swiss Stocks also exhibit substantial weights (12.89% and 15.27% of total wealth), while the weights for all other markets are neglectable. Again this poor diversification is not changed by using at and out of the money put options for optimal hedging the TP. On the other hand, the in the money put options lead to a more diversified portfolio, while the diver-sification is still not broad. The TP hedge with currency forwards leads to a good diversifica-tion for the bond markets with a substantial weight for Swiss stocks (10.04% of total wealth). Along with the optimal stock and bond market weights, table 6 shows the optimal option weights for the different hedging strategies. However the optimal option weights do not di-rectly show how much of the respective foreign currency exposure is actually hedged. For this purpose table 7 provides the aggregated investment weights, i.e. the investment weights for stocks plus bonds of each country, as well as the aggregated hedge ratios for the case of for-wards and in the money put options, i.e. the relative amount of the respective foreign currency exposure which is hedged.
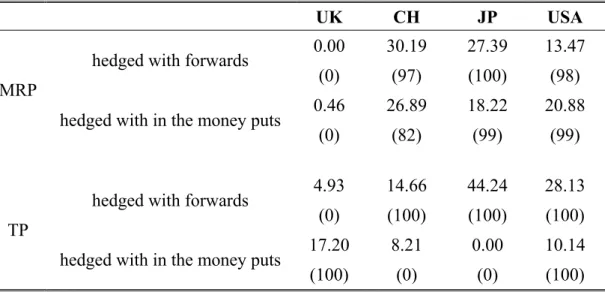
Table 7: Optimal (Aggregated) Investment Weights and Hedge Ratios for MRP and TP – Optimal Hedged with Forwards or In the Money Put Options
UK CH JP USA
0.00 30.19 27.39 13.47 hedged with forwards
(0) (97) (100) (98) 0.46 26.89 18.22 20.88 MRP
hedged with in the money puts
(0) (82) (99) (99) 4.93 14.66 44.24 28.13 hedged with forwards
(0) (100) (100) (100) 17.20 8.21 0.00 10.14 TP
hedged with in the money puts
(100) (0) (0) (100)
Notes: All numbers are in percent. The numbers in the brackets are the aggregated hedge ratios in the case of currency forwards and currency in the money put options, and above of them are the related aggregated investment weights.
From table 7, it is obvious that the relatively low weights of in the money put options for the MRP and TP (see table 6) indicate very high hedge ratios, ranging between 82% till 100% of the respective initial foreign currency exposure. Comparing the optimally hedged MRP with forwards and in the money put options, clarifies that the aggregated investment weights for the different countries and especially the respective hedge ratios are relatively similar. In both cases the foreign currency exposure for each country is nearly fully hedged.
For the TP the optimal hedge via forwards and in the money put options clearly provide dif-ferent aggregated investment weights for the difdif-ferent countries. However, also here the cur-rency exposures for the both cases are mostly fully hedged.
To check these results and to compare the degree of advantage or disadvantage of using the two different types of hedging strategies (options vs. forwards), a back-test procedure is ap-plied in the next section. This will help us to see how an investor would imply these opportu-nities when he is faced with these two possibilities and specially which of the hedging instru-ments statistically would improve his/her portfolio performance and dominates the others.
5 Ex-Ante Analysis and the Potential Diversification
Bene-fits of Currency Risk Hedging
5.1 Design, Structure, and Performance Measurement of Different
Types of Portfolio Strategies under Different Scenarios
The ex-ante evaluation investigates the consistency of the results of the proposed strategies in the ex-post outlook and checks the related impact within the time horizon. This evaluation is a fundamental tool for a portfolio manager as it provides practical advise for decision makers by checking the results in a out of sample framework. Therefore the back-ward testing proce-dure introduced by Eun/Resnick (1994) and Levy/Lim (1994) for both strategies, MRP and TP is applied.
This is done by, first defining an appropriate estimation period length. In the estimation pe-riod the optimal weights for the different strategies are estimated by ordinary mean/LPM op-timization. Then, the optimal weights are applied to the first period (out of sample period, in our case is one month) which follows the estimation period and the returns of the related port-folios are determined. This computation will be repeated by following the sliding window method, till the last observation will be included in the estimation procedure. This means, the estimation period is shifted one month forward, the respective portfolio weights are recalcu-lated for the new estimation period and than applied for the next out of sample period, and so on. The resulting out of sample returns and shortfalls, which can be regarded as independent investment decisions, can be applied to evaluate independently all these different types of strategies.
Since by construction the return of the put options are currency trend dependence and in our sample horizon the currency time trend shows two different distinguishable types of time trend, we will also check the results for these specific sub-periods. In this way the stability of our results due to currency movements during different financial cycles and global trends can be analyzed and even we will have a bridge to these effects on the forward basis. Therefore the ex-ante evaluation also will be done for the two sub-periods where different scenarios of currency trend will be discussed and then the computed out of sample information will be applied for statistically testing for the existence of any improvement through hedging against the currency exposure.
As it is shown in Figure 4, till September 1995 the German Deutsche Mark had appreciation against the foreign currencies. These trends afterwards have opposite fluctuations and the de-preciation of local currency - German Deutsche Mark - started. So we take this month as the breaking point for our sub-periods and divide the total 168 out of sample observation to first,
January 1989 to September 1995 and second, October 1995 till December 2002. Analyzing these results will give the answer to the degree of time dependence of the currency trend and its effect on the appropriate choice among risk controlling strategies.
Figure 4: Spot Exchange Rate
1.05 1.10 1.15 1.20 1.25 1.30 1.35 1986/01 1990/01 1994/01 1998/01 2002/01 DM/CHF 2.0 2.4 2.8 3.2 3.6 4.0 1986/01 1990/01 1994/01 1998/01 2002/01 DM/GBP .010 .012 .014 .016 .018 .020 .022 1986/01 1990/01 1994/01 1998/01 2002/01 DM/JYP 1.2 1.6 2.0 2.4 2.8 3.2 3.6 1986/01 1990/01 1994/01 1998/01 2002/01 DM/USD
In tables 8 and 9 the average return, expected short-fall and the Sortino-ratio for the both strategies in three different scenarios tabulated. For the MRP, results show that optimally forward hedged portfolio brings a significant decrease in the amount of shortfall risk compare to the unhedged portfolio. In the money and out of the money put options also have a lower amount of risk compare to the unhedged portfolio but to a lower extend than forwards. For-ward hedged portfolio brings 23% risk reduction when in the money and out of the money puts have only 1.9% and 1.7% decreasing power. This indicates that hedging would make a better off for the investor who searches for the minimum risk portfolio compare to doing nothing. For forwards the risk reduction is accompanied by a significant increase in the port-folio mean return which is not the case for the currency puts. Therefore we can see the higher Sortino-ratio for forward hedged portfolio than the unhedged one. In the case of tangency portfolio (TP), one can see that forward hedged has approximately four times higher Sortino-ratio compare to the unhedged one which is due to the higher amount of portfolio mean re-turn, strengthened by lower degree of short-fall expectation. The Sortino-ratio difference for the put in the money option compared with the unhedged one is very low. Here we have a higher mean return but also higher shortfall risk which induced in a lower performance im-provement for the in the money put options. At the money and out of the money puts have no word in this regard.
Simple comparison of two types of strategies show that in general minimum risk portfolio strategy gives a better choice than tangency portfolio, since besides of lower amount of short-fall risk, it also gives higher performance according to the higher Sortino-ratio, which contra-dicts the ex-post results.
Table 8: Expectation of the Portfolio Returns and the Shortfall Risk in an Ex-Ante Framework
→→ First Scenario (January 1989 – December 2002)
Unhedged Optimally Hedged with Forwards
Mean LPM SR Mean LPM SR
MRP 0.580 0.365 0.347 0.700 0.296 0.834
TP 0.581 1.054 0.121 0.819 0.536 0.682
→→ Second Scenario (January 1989 – September 1995) Unhedged Optimally Hedged with Forwards
Mean LPM SR Mean LPM SR
MRP 0.614 0.458 -0.010 0.808 0.394 0.482
TP 0.374 1.487 -0.164 0.798 0.674 0.267
→→ Third Scenario (October 1995 – December 2002)
Unhedged Optimally Hedged with Forwards
Mean LPM SR Mean LPM SR
MRP 0.548 0.276 0.912 0.597 0.200 1.504
TP 0.771 0.641 0.752 0.839 0.400 1.355
Notes: The table provides the mean return, first order of lower partial moments with having the risk free interest rate as the target of having shortfall risk and the sortino ratio of different strategies in an ex-post framework. MRP represents the minimum risk international portfolio, regarding that risk is introduced by first order of lower partial moments and TP is the interna-tional tangency portfolio. For the calculation, in the First Scenario the 168 monthly out-of-sample observations of the individual return time series from January 1989 until December 2002 have been used, in the Second Scenario the sub-sample - 82 - monthly out-of-sample ob-servations of the individual return time series from January 1989 until September 1995 have been implemented and for the Third Scenario the sub-sample - 86 - monthly out-of-sample ob-servations of the individual return time series from October 1995 until December 2002 have been applied.
Considering the results of two sub-samples show that the amount of the portfolio mean return, shortfall risk and Sortino-ratio in the first sub-sample is considerably poorer than the second one. When we look at the global trend of currency exchange rate, this indicates that in the appreciation period of local currency, composing an international portfolio selection will bring much lower level of benefit than in the depreciation cycles. This can be interpreted as during the blooming period, the international investors would gain lower benefit compare to the depreciation currency period which actually accords with the economical interpretations. More interesting is that, hedging by forwards during the blooming cycle of local currency would be much more beneficial than in the depreciation period. By comparing the percentage of improvement with the no hedged portfolio in the two sub-sample periods, one can see that in the first sample this improvement on average equals to 200% where in the second sub-period this amount is around 45%.
Table 9: Expectation of the Portfolio Returns and the Shortfall Risk in an Ex-Ante Framework
→→ First Scenario (January 1989 – December 2002)
Optimally Hedged Optimally Hedged Optimally Hedged with PATM with PITM with POTM
Mean LPM SR Mean LPM SR Mean LPM SR
MRP 0.572 0.372 0.319 0.547 0.358 0.262 0.571 0.359 0.329
TP 0.508 1.172 0.046 0.585 1.078 0.122 0.228 1.275 -0.176
→→ Second Scenario (January 1989 – September 1995)
Optimally Hedged Optimally Hedged Optimally Hedged with PATM with PITM with POTM
Mean LPM SR Mean LPM SR Mean LPM SR
MRP 0.596 0.470 -0.049 0.560 0.481 -0.122 0.612 0.457 -0.015
TP 0.228 1.777 -0.220 0.394 1.548 -0.145 -0.334 1.949 -0.489
→→ Third Scenario (October 1995 – December 2002)
Optimally Hedged Optimally Hedged Optimally Hedged with PATM with PITM with POTM
Mean LPM SR Mean LPM SR Mean LPM SR
MRP 0.550 0.281 0.908 0.536 0.240 0.997 0.534 0.265 0.896
TP 0.774 0.595 0.803 0.767 0.630 0.748 0.765 0.633 0.741
Notes: The table provides the mean return, first order of lower partial moments with having the risk free interest rate as the target of having shortfall risk and the sortino ratio of different strategies in an ex-post framework. MRP represents the minimum risk international portfolio, regarding that risk is introduced by first order of lower partial moments and TP is the international tangency portfolio. For the calculation, in the First Scenario the 168 monthly out-of-sample observations of the individual return time series from January 1989 until December 2002 have been used, in the Second Scenario the sub-sample - 82 - monthly out-of-sample observations of the individual return time series from January 1989 until September 1995 have been implemented and for the Third Scenario the sub-sample - 86 - monthly out-of-sample observa-tions of the individual return time series from October 1995 until December 2002 have been applied.
In the case of options, one can see that the total performance, average portfolio return and the shortfall risk in the first sub-sample is far below than the second one, which brings the same economical-financial interpretation. In the local currency depreciation period building an in-ternational diversified portfolio brings more benefit than in the blooms of the local currency. But in general in the ex-ante perspective, using options compare with forwards is not favor-able.
Table 10: Average Optimal Portfolio Weights in an Ex-Ante Analysis Framework
Stock Markets Bond Markets Derivative Markets
UK CH JP USA GER UK CH JP USA GER UK CH JP USA GER Unhedged Portfolio Strategies
MRP 0.28 1.35 0.59 0.66 2.38 3.56 14.37 2.28 2.67 71.87 - - - -
-TP 3.54 17.19 4.92 8.18 5.52 12.16 12.23 12.59 6.23 17.44 - - - -
-Optimally Hedged Portfolio Strategies with Forwards
MRP 0.84 1.80 1.52 2.65 1.47 3.45 20.90 30.96 22.32 14.11 - - - - -(24.35) (34.15) (35.14) (43.01) (-) (38.58) (41.98) (48.66) (48.45) (-) TP 0.86 6.99 3.59 9.85 1.75 10.37 15.69 13.48 27.03 10.39 - - - - -(14.36) (34.41) (35.84) (49.13) (-) (27.01) (36.34) (46.11) (47.56) (-)
Optimally Hedged Portfolio Strategies with PATM Optimal Weights of PATM
MRP 0.28 1.68 0.60 0.68 2.40 3.72 14.30 2.58 2.73 70.96 0.002 0.013 0.019 0.029
-TP 3.47 16.87 4.94 7.92 5.43 12.11 12.21 12.53 6.21 17.40 0.073 0.081 0.488 0.272
-Optimally Hedged Portfolio Strategies with PITM Optimal Weights of PITM
MRP 0.18 1.73 0.63 0.98 2.16 2.76 12.77 2.90 3.36 72.18 0.047 0.072 0.058 0.148
-TP 3.31 16.15 4.98 8.01 5.12 11.87 12.25 12.28 6.29 17.23 0.845 0.261 0.401 0.985
-Optimally Hedged Portfolio Strategies with P0TM Optimal Weights of POTM
MRP 0.15 1.34 0.58 0.63 2.23 2.70 13.06 2.09 2.68 74.52 0.0004 0.013 0.0008 0.004
-TP 3.43 16.96 4.89 8.00 5.47 12.10 12.29 12.61 6.21 17.33 0.018 0.471 0.048 0.174
-Notes: The table contains the average optimal weights of stock indices in an ex-ante framework, for German investor that initially invests in United Kingdom, Switzerland, Japan U.S. and home country. Weights are reported in percentage and the values in parenthesis are the percentage optimal forward hedge ratios. MRP represents the minimum risk interna-tional portfolio, regarding that risk is introduced by first order of lower partial moments and TP is the internainterna-tional tangency portfolio. Results are computed by using the 168 monthly out-of-sample observations from January 1989 until December 2002.
The average optimal weights for the stock and bond markets as well as the hedge ratios of the both MRP and TP are presented in table 10. For the MRP, the unhedged portfolio is poorly diversified and mainly contains the German (72%) and partly the Swiss bonds (14%). Using currency put options does not change this feature which fits with our previous results. Still the main weights belong to the German and then Swiss bonds and the rest of the markets have neglectable proportion of the total investment. But using the optimally forward hedged strat-egy gives a much more diversified portfolio where four of the five bond markets have clear weights. Obviously still stocks have lower weights due to their higher amount of risk.
For the TP the unhedged portfolio gives a more diversified portfolio in terms of stock and bond markets. The Swiss stocks have now 17% and in general 40% of total amount of in-vestment dedicated to the stock markets. Also all the bond markets now have more diversified portions of total wealth. Hedging by forwards changes this pattern, as Swiss stocks weight reduces from 17% to 7% and for the UK from 3.54% to 0.86%. Bonds compose 77% of the whole tangency portfolio where it is 30 to 50% hedged against the currency exposure. Hedg-ing by puts does not change the prototype of tangency portfolio from the unhedged one which satisfies our previous results.
5.2 Stochastic Dominance and Strategy Performance in an Ex-Ante
Framework
The concept of stochastic dominance is quiet old. Hence it is just after 1969, with four inde-pendent papers by Hadar/Russell (1969), Hanoch/Levy (1969), Rothschild/Stiglitz (1970) and
Whitmore (1970), became widely popular in various area of finance and economics. Because of its correspondence with several types of utility functions and its ability to avoid certain criticisms which are normally exist in the mean-target/risk dominance models, it has been enormously used for the decision making process and investment analysis under uncertainty. As Porter (1974) showed, if F dominates G by second degree of dominance then F dominates G by the mean-target semi-variance model22. Levy/Kroll (1978), Bawa (1978, 1982) and Levy
(1992, 1998) discuss this when the portfolio also includes a risk less asset since without con-sidering a risk less asset, this measure in general ends up to a relatively large number of effi-cient sets. Here in order to evaluate the performance improvement of the ex-ante strategies for the purpose of decision making, we do the SSD test for both with and without the risk-free asset by using the classification algorithm of Levy/Kroll (1979) with the extension by Levy
(1992, 1998).
Results show that for the German investor the second degree of stochastic dominance without considering a risk-less asset contains, in the first scenario 7, in the second scenario 3 and in the third scenario 9 portfolios. To be more critical by considering a risk less asset, one can see that the only non-dominated portfolio is the minimum risk portfolio which has been optimized by using forwards in first and second scenarios. In the third scenario the optimally forward hedged tangency portfolio and minimum risk portfolio are the non-dominated strategies which can be offered to the decision maker.
22The α-t efficient set for α=2 is a subset of the second degree stochastic dominance efficient set. Fishburn (1977) extends
these results to the general class of α-t models using first, second and third degree stochastic dominance relationships. When the appropriate derivatives of an investor's utility function exist, the first, second and third degree stochastic domi-nance correspond respectively to u' ≥ 0, u' ≥ 0 andu''≤ 0, andu' ≥ 0, u''≤ 0, u'''≤ 0.