Journal of Economic Perspectives—Volume 24, Number 4—Fall 2010—Pages 399–422
W
hen the hurricane slammed into New Orleans, the 110 mile-per-hour winds drove a massive storm surge inland. The cheaply constructed and poorly maintained levees on both sides of the Industrial Canal failed. With most of the city below sea level, the flood waters reached the eaves of thousands of houses. It took weeks before the water level receded enough for people to begin to return to their homes, and even longer to restore the flooded houses to a livable condition. Many had to sleep in the shelters, while waiting for the federal govern-ment to send trailers.Although the similarities are striking, this not the story of how Hurricane Katrina hit New Orleans in August 2005. Instead, it’s the story of Hurricane Betsy, which hit Louisiana on the evening of September 9, 1965, and the storm surge that flooded 165,000 homes in just a few hours. Betsy was one of the most intense, deadly, and costly storms ever to make landfall in the United States: it killed 76 people in Louisiana and caused $1.5 billion in damage—equal to nearly $10 billion in 2010 dollars. In 1965, no flood insurance was available, so victims had to rely on friends and family, charities, or federal relief.
After that catastrophe, and given the lack of interest by private insurance markets in offering flood coverage, the U.S. government established a new program in 1968— the National Flood Insurance Program (NFIP)—to make flood insurance widely available. Now, after more than 40 years of operation, the NFIP is today one of the longest standing government-run disaster insurance programs in the world.
Catastrophe Economics: The National
Flood Insurance Program
■ Erwann O. Michel-Kerjan teaches at the Wharton School of the University of Pennsylvania and is Managing Director of the Wharton Risk Management and Decision Processes Center. He is also a research associate at the Ecole Polytechnique in France. His e-mail address is
〈erwannmk@wharton.upenn.edu〉. doi=10.1257/jep.24.4.399
Hurricane Katrina hit New Orleans in August of 2005, just two weeks before the 40th anniversary of Hurricane Betsy. On one level, the public flood insurance
program passed the test: by May 2006, 162,000 Gulf Coast claims had been paid— over 95 percent of the claims received by the federal government and by far the most claims the program ever received. By August 2006 virtually all claims were settled, providing insured victims with nearly $16 billion in claim payments. But because the National Flood Insurance Program was already running a deficit, and other hurricanes and floods occurred that same year, the program had to borrow nearly $18.6 billion from the U.S. Treasury. Many blamed the government for failing to charge adequate rates to account for truly catastrophic losses. The issue of whether the program was charging adequate premiums, and how those premiums were spent, seems especially salient because of the increasing concentration of population and assets in flood-hazard areas, along with possible changes in climate patterns that could increase the number and/or severity of floods (Burby, 2001; Weitzman, 2007, 2009).
In this paper, I present an overview of the 40 years of operation of the National Flood Insurance Program, starting with how and why it was created and how it has evolved to now cover $1.23 trillion in assets. I analyze the financial balance of the NFIP between 1969 and 2008. Excluding the 2005 hurricane season as an outlier, poli-cyholders have paid nearly $11 billion more in premiums than they have received in claim reimbursements over that period. However, the program has spent an average of 40 percent of all collected premiums on administrative expenses, more than three-quarters of which were paid to private insurance intermediaries who sell and manage flood insurance policies on behalf of the federal government but do not bear any risk. I then present some of the challenges the NFIP faces today: outdated flood-risk maps; low insurance penetration and retention; lack of motivation by residents to invest in risk protection measures; repetitive losses that account for a large part of the claims; and how the NFIP can be financially sustainable in the face of truly catastrophic losses. Finally, I propose ways those challenges might be overcome through innovative modi-fications, such as the development of multiyear flood insurance contracts attached to the property and the issuance of a catastrophe flood bond.
Program Origin and Evolution
Early VisionCongress passed the Federal Flood Insurance Act in 1956 to develop an experi-mental program to test the economic feasibility of having private sector insurance companies provide flood insurance (Grossman, 1958). But this experimental program was never implemented, mainly due to the lack of interest by the private insurers.
To private insurers in the 1950s and 1960s, flood insurance indeed appeared an unattractive line of business because of the high concentration and correla-tion of risks that are not independent. With most lines of insurance (life, auto, fire insurance), insurance premiums and losses claimed are almost continually in
Erwann O. Michel-Kerjan 401
balance. But with flood insurance, as is the case for catastrophe insurance more generally, losses are low or nonexistent in some years and then sky-high in other years (Kunreuther, Ginsberg, Miller, Sagi, Slovic, Borkan, and Katz, 1978; Jaffee and Russell, 1997; Froot, 1999). Moreover, the 1960s were an especially bad decade for hurricanes, which made the potential costs of associated flooding look both high and volatile.
After Hurricane Betsy hit the United States in September 1965, the Southeast Hurricane Disaster Relief Act of 1965 provided federal relief to victims of the hurri-cane. Congress also implemented a study to explore alternative ways to provide financial protection to victims of future floods other than reliance on public assistance, recognizing that federal disaster relief was a form of de facto free flood insurance (Pasterick, 1998).
The National Flood Insurance Act of 1968 created the National Flood Insur-ance Program (NFIP), which was designed as a voluntary partnership between the federal government and local communities. The NFIP creates flood maps in partici-pating communities, designating risk in different flood zones.1 Property owners in
participating communities are eligible to buy federal flood insurance. The main goal of the NFIP was to provide flood insurance to many more people, with the under-standing that there might still be truly exceptional events for which the program would have to borrow money from the federal government. That the program was not set up to deal alone with truly extreme events is critical to bear in mind when analyzing its effectiveness. The NFIP provides insurance up to a maximum limit for residential property damage, now set at $250,000 for building coverage and $100,000 on contents coverage. The program was structured to subsidize the cost of flood insurance on existing homes, in order to maintain property values, while charging actuarially fair rates on new construction.
Since the enactment of the National Flood Insurance Program, flood insurance in the United States has been provided mainly by the government. However, as I explain below, private insurance companies have played a large role in selling and servicing policies. Also, there is some private flood insurance covering amounts above the residential cap for flood losses and under certain special commercial insurance policies, even though this represents only a small portion of the market today.
Operation through Public–Private Collaboration
Since the inception of the National Flood Insurance Program, the program has been responsible for several key functions: developing the flood maps, estab-lishing the deductible/limit menu, and setting associated premiums—including establishing rules to determine subsidized premiums for certain existing proper-ties. The NFIP also manages the Community Rating System which monitors risk 1 High-risk areas have a 1 percent chance of flooding each year; these are the so-called Special Flood
Hazard Areas (SFHAs), which are divided into zones A and V, the latter being coastal areas subject to storm surge. Lower-risk non-SFHAs are divided into zones B, C, and X. See ⟨http://www.fema.gov⟩ for a full description of all the subzones. Nearly 60 percent of the NFIP policies in force in 2009 were situated in an SFHA (Michel-Kerjan, Lemoyne de Forges, and Kunreuther, 2010).
reduction efforts made by local communities (for example, installing drainage or levee systems) so their residents are less exposed to flood risk and in return, benefit from reductions on their flood insurance premiums.
Originally, NFIP insurance coverage was available to buyers via specialized insur-ance agents, but in 1983, the arrangement was supplemented with a program known as the Write-Your-Own program (also called WYO). The Write-Your-Own program allows participating property/casualty insurance companies to write and service the standard National Flood Insurance Program policy in their own names, although the companies bear none of the risk. Today, nearly all NFIP flood policies are issued through the Write-Your-Own program. Ninety private insurance companies write flood policies, as well as process, settle, pay, and defend all claims arising from the flood policies, while the NFIP retains responsibility for underwriting these losses. The Write-Your-Own program is intended to be a win-win situation for the NFIP and private insurers. The NFIP benefits from the private insurance industry’s marketing channels and the presence of many insurers in flood-prone areas. In return, the private insurers participating in the Write-Your-Own flood program receive an “expense allowance” (discussed in more detail later). In other words, they play the role of a financial intermediary and claims manager on behalf of the federal government, but do not bear any of the risk. Over time, insurers came to see this partnership as an opportunity: they could now add flood risk to the menu of insur-ance coverage they sell to their clients. In doing so, they played an important social role in providing many more people throughout the country access to coverage.
Significant Changes in the Scope of the Program
After a first decade at a relatively small size, the flood insurance program started to grow significantly. Figure 1 shows the expansion of the NFIP from 1978 to 2009 in terms of the number of flood insurance policies in place and the total value of the assets covered by the program.
Originally, the purchase of flood insurance in the United States was not manda-tory by law, since it was thought that mortgage lenders would require this new flood insurance in order to protect their assets. Then Hurricane Agnes made landfall in the northeastern United States in summer 1972, and it became clear that many people had not purchased flood coverage. The Flood Disaster Protection Act of 1973 soon followed: federally-regulated mortgage lenders must require flood insur-ance for the purchase of property acquired or developed in Special Flood Hazard Areas (SFHAs). As a result, the number of policies in force increased in the 1970s to reach a plateau around 2 million in the 1980s (upper line in Figure 1).
Another series of major floods occurred in the early 1990s,2 boosting the
demand for insurance afterwards. These floods also revealed that the flood 2 Three significant flood events in 1992 (a Texas flood, Hurricane Andrew, and a fierce nor’easter)
caused over $750 million in insured losses; a March storm and the floods in the Midwest in 1993 also generated $750 million in payments by the NFIP. The Texas floods in October 1994, the Louisiana floods in May 1995, and Hurricane Opal in September 1995 cost the National Flood Insurance Program a total of over $1.7 billion (all in 2010 prices).
Catastrophe Economics: The National Flood Insurance Program 403
insurance take-up rate remained shockingly low even in SFHAs. Thus, sanctions on lenders were tightened by the National Flood Insurance Reform Act of 1994.3
In addition, the U.S. Federal Emergency Management Agency (FEMA) launched a large-scale information campaign in 1995 called “Cover America.” The combi-nation of these three elements—flood experience, tighter requirements, and risk awareness campaigns—resulted in a significant increase in the program’s size. The number of policies in force reached 4 million by 1997, and continued to increase in the following years. Another significant jump in demand for flood insurance occurred right after the seven major hurricanes that hit the Gulf Coast in 2004 and 2005 and resulting storm surge inland. As of December 31, 2009, the National Flood Insurance Program covered 5.7 million policies and received $3.2 billion in premiums from its policyholders that year.
The lower line in Figure 1 shows the total value of property insured under the National Flood Insurance Program. This is calculated as the sum of the limits minus deductibles on all policies, in 2009 prices. This value was $165 billion in 3 The effectiveness of the flood insurance requirement in practice is still a major issue as take-up rates
have been found to be quite low. Consider the flood in August 1998 that damaged property in northern Vermont. Of the 1,549 of the homeowners suffering losses from this disaster, the Federal Emergency Management Agency found that 84 percent resided in Special Flood Hazard Areas and did not have insurance, even though 45 percent were required to purchase this coverage (Tobin and Calfee, 2005). Figure 1
Evolution of the Number of NFIP Policies in Force and Coverage, 1978–2009
(in 2009 prices)
Source: Author’s calculation from data provided by the U.S. Department of Homeland Security. Note: Figure 1 shows the expansion of NFIP from 1978 to 2009 in terms of the number of flood insurance
policies in place and the total value of the assets covered by the program.
Policies in force (in 1,000s)
1,000 2,000 0 3,000 4,000 5,000 6,000 $200 $400 $0 $600 $800 $1,000 $1,400 $1,200
Coverage (in billion)
Policies in force (left axis) Coverage (right axis)
1978, $348 billion in 1990, and $703 billion in 2000. Between 2001 and 2009, the total exposure increased by another 75 percent, reaching $1.23 trillion at the end of December 2009.
This increase in insured value is due to several factors. First, policyholders have purchased more flood insurance to protect their assets. Inflation-corrected data show that the average quantity of insurance per policy almost doubled over 30 years, from $114,000 in 1978 to $217,000 in 2009. Second, there has been a large population increase in exposed areas such as coastal states, which now account for a very large portion of the portfolio of the National Flood Insurance Program (as shown in Table 1). For instance, according to the U.S. Bureau of the Census, the population of Florida has increased significantly over the past 40 years: it was 6.8 million in 1970, 13.0 million in 1990, and was nearly 18.5 million in 2009. Over the same period, the number of flood insurance policies in force there increased by a multiple of more than seven.
Is the Program Really National?
As one would expect, highly populated coastal states have the largest number of flood insurance policies. However, Figure 2, which shows the number of flood
T1
F2
Table 1
Summary Statistics for the NFIP: Nation and Top 5 States
(data as of March 31, 2010 ) Number of flood policies in force Insurance penetration Quantity of insurance in place Annual premiums Average annual premium per policy Average premium per $1,000 of coverage Nation 5,629,263 4% $1,221,914,068,200 $3,222,657,554 $572 $2.64 Florida 2,141,076 25% $473,469,375,500 $971,566,626 $454 $2.05 % nationwide 38.03% 38.75% 30.15% Texas 681,425 7% $157,415,703,000 $329,049,757 $483 $2.09 % nationwide 12.11% 12.88% 10.21% Louisiana 483,593 26% $104,544,951,700 $313,139,277 $648 $3.00 % nationwide 8.59% 8.56% 9.72% California 276,915 2% $68,233,163,700 $199,504,523 $720 $2.92 % nationwide 4.92% 5.58% 6.19% New Jersey 229,461 6% $50,341,159,900 $186,194,962 $811 $3.70 % nationwide 4.08% 4.12% 5.78% Top 5 States 3,812,470 10% $854,004,353,800 $1,999,455,145 $524 $2.34 % nation 67.73% 69.89% 62.04%
Erwann O. Michel-Kerjan 405
insurance policies in force for each state, also reveals the hyper-concentration of the “national” flood program in a handful of states. The state of Florida, which repre-sented less than 6 percent of the U.S. population in 2010, had nearly 40 percent of the total number of flood policies issued by the National Flood Insurance Program as of March 31, 2010. More than two-thirds of NFIP policies are located in just five coastal states: Florida (2,141,076), Texas (681,425), Louisiana (483,593), California (276,915), and New Jersey (229,461).
Table 1 shows a summary of several coverage, penetration, and pricing measures for the nation and these five states (ranked by the number of flood policies in force). Flood insurance penetration (the second column) is defined as the ratio of the number of policies in force in a state compared with the number of households in that state.4 For instance, as one would naturally expect, flood insurance penetration
is significantly higher in Florida (25 percent) and Louisiana (26 percent), where a large portion of the state is exposed to flood risk, than California (2 percent)
4 Data on the number of buildings in flood zones across the country is incomplete and often inaccurate,
which makes it difficult to accurately determine the of take-up rates in flood zones. Studies on small samples for some specific locations reveal that about half the relevant homes in high-risk areas had flood insurance (Kriesel and Landry, 2004; Dixon, Clancy, Seabury, and Overton, 2006).
Figure 2
Number of NFIP Policies in Force by State, as of March 31, 2010
(in 1,000s)
Source: Data from the U.S. Department of Homeland Security.
6.8 34.9 4.2 4.4 2.6 16.5 19.1 25.1 40.6 135.8 5.4 12.8 12.2 16.4 16.6 15 32.2 15.6 57.9 2.9 21.7 67.1 162.6 15.1 37.5 24.7 68.7 229.5 9.1 3.6 51.8 681.4 97 58.7 276.9 16.2 47.8 25.2 19 483.6 22.9 56.4 76.3 2,141 201.9 8.9 25.5 32.5 12.5 109.7
or Texas (7 percent). These are state-average estimates, which do not show the important differences within a state, for example, exposure to flood hazard, value of the house, and demographics of the homeowners.
The nationwide average annual premium per policy is $572. Prices for insurance, which are set nationally by the National Flood Insurance Program, vary by contract (choice of deductible and limit), flood zone, and characteristics of the house. They do not otherwise vary by state or locality, so the numbers reported in Table 1 reflect the variation in flood risk by state, exposure of the insured property, and of course, how much coverage is bought per policy. However, the quantity of insurance coverage per policy actually doesn’t vary much across states, because of the afore-mentioned cap in coverage imposed by the program. It is in the $215,000–245,000 range for all these five states, with the upper end in California; as of 2010, it was $217,000 on average nationwide.
A somewhat better measure of the cost of insurance than the premium per policy is the ratio of premium over quantity of insurance purchased. On average nation-wide, homeowners pay only $2.64 per $1,000 of flood coverage. This average ratio varies from state to state and, of course, depends on the flood zone and the char-acteristics of the house: on average, insurance cost in 2010 was lower in Florida and Texas ($2.05 and $2.09) and more expensive in Louisiana ($3.00) and New Jersey ($3.70).
In summary, the National Flood Insurance Program has grown significantly since its inception in 1968 to cover $1.23 trillion of insured assets in 2010. It provides financial protection against flood to residents across the nation, but more than two-thirds of its policies are located in just five coastal states. Homeowners are charged a relatively low price (on average less than $50 per month to cover $217,000); that continues to be true even in flood-prone states such as Louisiana, Florida, and Texas, which suffered major flood losses due to the 2004, 2005, and 2008 hurricane seasons. This leads us to question the financial balance of the program, to which I now turn.
Financial Balance
Paid Premiums versus Insurance Reimbursements: A Policyholders’ View
There are many ways to look at the financial balance of an insurance program. Let’s first take the view of the policyholders who purchased flood insurance by comparing the premiums they paid over time with the amount they collected back through claim payments. Figures 3 and 4 are based on financial data provided by the NFIP.
The vertical bars in Figure 3 indicate the difference between collected premiums and paid claims nationwide for each year between 1969 and 2008 (in 2008 prices). In the first decade or so, when the program was still relatively small, the values are all quite close to zero. The upper line indicates the cumulative amount of poli-cyholders’ balance over time. At the end of 2004, it was positive at $7.6 billion.
Catastrophe Economics: The National Flood Insurance Program 407
In other words, policyholders had paid $7.6 billion more in premiums over the period 1969–2004 than they had received in claim payments. This was the case again in 2007 and 2008 (+$1.4 billion and +$2.0 billion, respectively). The year 2006 is clearly an outlier in Figure 3; this is the year that the National Flood Insurance Program paid many of the claims from the 2005 hurricane season.
Breaking down this national analysis at a state level is eye-opening, too. Over the period 1978–2008 (including all claims paid in 2005 and 2006), flood insurance poli-cyholders in Florida paid $16.1 billion in premiums but received only $4.5 billion in claims reimbursement: that is, premiums charged were about 3.6 times the claims. Californians paid $3.5 billion in premiums but received back only $710 million: that is, premiums charged were about 5 times insurance reimbursements. New Jersey policyholders paid $2.7 billion in premiums between 1978 and 2008, but collected only $1.2 billion in claims. The extreme case is Colorado; calculation shows that policyholders paid more than 15 times what they collected in premiums over this 31-year period.
The situation is reversed in Texas, where flood insurance policyholders paid $4.5 billion in premiums but collected a larger $6.7 billion in claims, so that premiums paid for only 67 percent of the claims. And Louisiana over this time had $4.4 billion collected in premiums, but $16.7 billion paid claims, so that premiums covered only one-quarter of the claims. Note here that if one excludes paid claims associated with Hurricane Katrina in Louisiana ($13.2 billion), the balance of Louisiana’s policy-holders over this period would have been positive.
Figure 3
Financial Operation of the NFIP, 1969–2008 (in $1,000)
(in 2008 prices)
Source: Calculations by the author using data from the U.S. Department of Homeland Security (FEMA). Note: Total operating result = (premiums + other earnings) – (claims + operating expenses).
$10,000,000 $5,000,000 $0 –$5,000,000 –$10,000,000 –$15,000,000 –$20,000,000 –$25,000,000
Premiums minus claims (annual) Premiums minus claims (cumulative) Total operating result (cumulative)
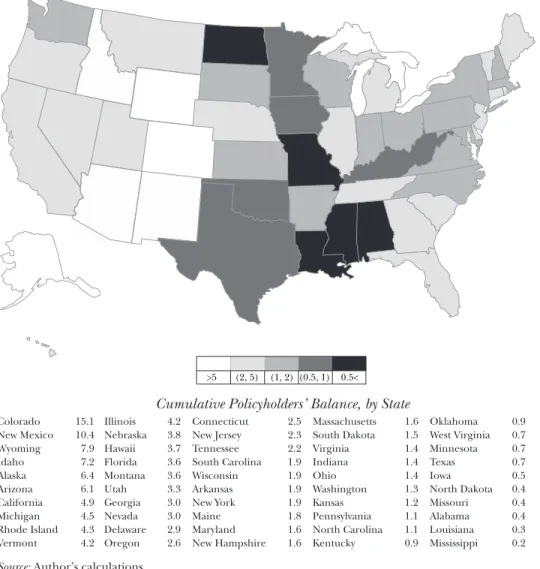
Figure 4 shows the ratio of flood insurance collected by NFIP over flood claims paid (that is, the policyholders’ balance) over the period 1978–2008 for each state. One might argue that the pattern we see is generally to be expected for disaster coverage; that is, we might expect a low-frequency/high-severity line of insurance to display a high volatility of losses. Some states might have been luckier than others, so far. However, the difference across states is still very
F4
Figure 4
Geographic Representation of Policyholders’ Balance, 1978–2008
Cumulative Policyholders’ Balance, by State
Colorado 15.1 Illinois 4.2 Connecticut 2.5 Massachusetts 1.6 Oklahoma 0.9 New Mexico 10.4 Nebraska 3.8 New Jersey 2.3 South Dakota 1.5 West Virginia 0.7 Wyoming 7.9 Hawaii 3.7 Tennessee 2.2 Virginia 1.4 Minnesota 0.7 Idaho 7.2 Florida 3.6 South Carolina 1.9 Indiana 1.4 Texas 0.7 Alaska 6.4 Montana 3.6 Wisconsin 1.9 Ohio 1.4 Iowa 0.5 Arizona 6.1 Utah 3.3 Arkansas 1.9 Washington 1.3 North Dakota 0.4 California 4.9 Georgia 3.0 New York 1.9 Kansas 1.2 Missouri 0.4 Michigan 4.5 Nevada 3.0 Maine 1.8 Pennsylvania 1.1 Alabama 0.4 Rhode Island 4.3 Delaware 2.9 Maryland 1.6 North Carolina 1.1 Louisiana 0.3 Vermont 4.2 Oregon 2.6 New Hampshire 1.6 Kentucky 0.9 Mississippi 0.2
Source: Author’s calculations.
Notes: The map presents the ratio of flood insurance premiums collected by the NFIP from policyholders
in that state over flood claims paid to the policyholders of that state, for all 50 states over the period 1978–2008 (in 2008 prices), that is, it shows the cumulative policyholders’ balance. The lighter shades indicate a higher ratio. The individual ratio for each state is provided in table format.
0.5< (0.5, 1) (1, 2) (2, 5) >5
Erwann O. Michel-Kerjan 409
significant given that the analysis looks at a fairly long period of flood claims data, over three decades.
Other Earnings and Operating Expenses
The financial operation of the National Flood Insurance Program is of course more complex than simply subtracting claims from premiums. There are several other important budget lines.
Financial data provided by the National Flood Insurance Program shows that on the earning side, the main income beyond the premiums is provided by the $30 policy fee paid by all flood policyholders. This fee is intended to cover salaries and administrative costs of the NFIP.
On the expense side, there are operating expenses and floodplain management costs, which include flood studies and surveys, mitigation grants, purchase of repeti-tive loss properties, and salaries. Total costs in this category were $1.7 billion over the period 1991–2008 (those costs were covered by special appropriations until 1990 and so did not enter into the calculations of the operating expenses before 1991).
But the major source of spending, after the payment of claims, is the payment by the National Flood Insurance Program to the insurers and agents participating in the Write-Your-Own program. The program pays an expense load based on the average costs for underwriting, policy writing, advertising, and general expenses. On average, that load represents about 15.6 percent of collected premiums. In addi-tion, insurance companies receive a 15 percent commission allowance, paid to them regardless of whether an agent or broker receives a commission. Another 2 percent is added if the Write-Your-Own insurer or agent meets a five percent net growth in policies on an annual basis. In addition, following a flooding episode, the NFIP pays Write-Your-Own insurance companies for claims adjustment expenses (for example, attorney fees and adjuster fees) along with an allowance of 3.3 percent of each claim settlement amount to pay for their processing expenses. (This formula was adjusted after Katrina to prevent a windfall to companies after catastrophic floods.)
In total, more than one-third of the premiums collected by the program goes to the 90 Write-Your-Own participating companies and the insurance agents. Correcting for inflation, between 1984 (the first year that Write-Your-Own insurers collected fees) and 2008, and excluding loss adjustment expenses for which I do not have data, they collected a total of $9.7 billion (including $6.6 billion for the period 1998–2008).
Of course, one should question whether it is reasonable for the National Flood Insurance Program to continue to pay one-third of its collected premiums— equivalent to a 50 percent loading cost—to financial intermediaries who do not bear any risk. As a comparison, insurers receive 24 percent of the unsubsidized premiums for selling and servicing policies to farmers under the national crop insurance program (Skees, 2001). A 20–30 percent loading cost is not uncommon for private lines of insurance either, but companies pay for rate-making and product development, prices are set competitively, not by federal statute, and insurers need to hold some capital and ensure enough return to their shareholders.
Furthermore, and what is even more surprising, is that the Federal Emergency Management Agency does not seem to know how much of this payment actually covers participating insurers’ expenses versus how much goes toward profit. As stated recently by the U.S. Government Accountability Office (GAO, 2009), “FEMA does not have the information it needs to determine whether its payments to Write-Your-Owns are reasonable.” On the other hand, it is not clear either how much it would cost to the federal government to run such a program nationwide without the private insurance infrastructure and the claim settlement expertise they provide. Better understanding of this cost will be important moving forward.
Combining all earnings and expenses of the National Flood Insurance Program, the lower line in Figure 3 depicts the cumulative total operating result of the program over time, which includes all these expenses. Corrected for inflation, it appears that the program has continuously been running a deficit. At the end of 2004, the NFIP was facing a $1.5 billion cumulative deficit since its inception in 1968 (in 2008 prices). That deficit, which had been built from rolling over expenses from all previous years, seemed manageable given the scope of the program and the significant non-claim expenses it faces. But then came the catastrophes and corresponding financial losses of 2005.
Can the Program Handle Extreme Events by Itself?
Collaboration between insurers and the National Flood Insurance Program enabled a large portion of the losses incurred to be settled in the months following the 2005 hurricanes. As mentioned in the introduction, as of May 2006, over 95 percent of the 162,000 claims reported by the Federal Emergency Management Agency had been settled for flood damage from Hurricane Katrina in Alabama, Florida, Louisiana, and Mississippi. For comparison, the program processed about 30,000 claims in each of the three largest single flood events prior to Hurricane Katrina: the 1995 Louisiana flood, Tropical Storm Allison in 2001, and Hurri-cane Ivan in 2004. The average amount paid per claim for HurriHurri-cane Katrina flood damages, $94,800, was about three times the average paid per claim in the previous record year of 2004. A year after Katrina, virtually all claims (99 percent) had been closed (GAO, 2006). In that sense, when put to a very severe test of its administrative capacity, the partnership between the NFIP and participating insurers worked well.5
But claims from Hurricanes Katrina, Rita, and Wilma, and other floods in 2005 pushed the operating budget of the program into a deep hole. Hurricane Katrina alone generated $16.1 billion in flood insurance payments. Between 2005 and 2008, the program had to borrow a total of $19.3 billion from the U.S. Treasury (King, 2009). It will be very difficult for the program to repay this debt: total annual
5 To put things into perspective, the devastation caused by Hurricane Katrina was such that in just a
few days, New Orleans’s population declined from over 400,000 to near zero. Almost two years after the storm, by July 1, 2007, nearly half of these evacuees had yet to return, as Vigdor (2008) discusses in this journal.
Catastrophe Economics: The National Flood Insurance Program 411
premiums for the program are about $3.2 billion and interest payments alone on the debt are nearly $900 million. In some sense, the debt accumulated after the 2005 losses just confirms what was known since the inception of the National Flood Insur-ance Program: it is designed to be financially self-supporting, or close to it, most of the time, but cannot handle extreme financial catastrophes by itself (Wetmore, Bernstein, Conrad, DiVincenti, Larson, Plasencia, and Riggs, 2006).
Improving the National Flood Insurance Program on Five
Dimensions
This section focuses on five challenges that must be addressed to make the National Flood Insurance Program more sustainable and effective in the long term: 1) improve the accuracy of the flood risk maps; 2) continue to increase insurance penetration and retention; 3) encourage individuals to invest in risk mitigation measures; 4) reduce repetitive losses, the number of subsidized properties, and operating expenses; and 5) strengthen financial sustainability in the face of large-scale catastrophes.
Challenge 1: Improve the Accuracy of the Flood Risk Maps
One of the responsibilities of the Federal Emergency Management Agency (FEMA), which manages the National Flood Insurance Program, is to develop appropriate flood insurance rate maps. FEMA’s role is also to make sure these maps are updated regularly so exposure to the risk—which is evolving with new construc-tion, deterioration of the environmental habitat, erosion, and possibly a change in climate patterns—is measured adequately over time and communicated to those living in risky areas (GAO, 2008a).
If the flood risk maps are mostly accurate in their estimation of flood risks, then moral hazard and adverse selection will be less of a concern in the flood insurance program. If the maps are inaccurate, but their inaccuracies are not biased toward overestimating or underestimating risk, and private information is no better, then, while insurance based on such maps may run into difficulties, the issues of moral hazard and adverse selection should still be contained.
However, a number of facts, taken together, suggest that the quality of the existing flood risk maps is not especially good. There is no accurate and uniform collection of data on the number of properties in floodplains in the United States. According to the Government Accountability Office, 50 percent of the NFIP’s roughly 106,000 maps were more than 15 years old in April 2008, and another 8 percent were 10 to 15 years old (GAO, 2008; King, 2010). Moreover, several reports have also challenged their quality (Burby, 2001). Our analysis above, showing that some states have been paying many times more than the claim payments they’ve received over the past three decades while others paid several times less than they received, raises questions concerning the adequacy of the maps and associated premiums that are charged. The Mitigation Directorate at FEMA has developed a
Flood Map Modernization Plan to update the maps and convert them to a digital format. But this initiative is still underway.
Political dynamics can affect flood mapping as well. New technology allows the Federal Emergency Management Agency to do a better job of evaluating flood expo-sure. Actuarially speaking, it is easy to change the designation of one area so that it is now correctly identified as a 100-year floodplain; but it might still be very difficult to implement this change locally. Evidence suggests that a house located within a floodplain has a lower market value than an equivalent house located outside the floodplain (Bin and Polasky, 2004). Also, the residents living in this now-established floodplain will need to purchase high-risk flood insurance, a more expensive package than low-risk flood insurance. This can result in political pressure on elected officials to postpone the starting date of the “new maps” or to refute the draft map. This might also explain why many areas have not been studied in more detail: for many, keeping the veil of ignorance (and thus being treated as a low risk) might seem the more attractive option.
The solution here is, of course, to increase the quality of these maps, to make sure they are updated quite frequently, and to communicate more effectively on the importance of better understanding everyone’s exposure (Chivers and Flores, 2002). Drawing up detailed flood risk maps for the entire country and appropriately updating them over time is admittedly a monumental job. This might require a national initiative with special appropriation by the U.S. Congress to go well beyond what the Federal Emergency Management Agency has been able to do so far given its current budget.
Challenge 2: Increase Insurance Penetration
While the number of National Flood Insurance Program policies in force has significantly increased over time, evidence presented earlier suggests that perhaps half of residents living in floodplains do not have flood insurance. As an example, a New
York Times analysis published a few days after Hurricane Katrina in 2005 showed that in
the Louisiana parishes affected by the hurricane, the percentage of homeowners with flood insurance ranged from 58 percent in St. Bernard’s to 7 percent in Tangipahoa. Six out of 10 residents in Orleans Parish had no flood insurance (Bayot, 2005).
In order to propose concrete solutions to overcome this challenge, it is first crit-ical to address the question of why such a low proportion of those in flood risk areas have insurance (Kunreuther, Meyer, and Michel-Kerjan, forthcoming). One possible explanation is that people are not aware they reside in a flood-prone area, or are told they are safe—as was the case for people living in areas behind levees in New Orleans. After a levee is built, there is often increased economic development in these areas but property owners see no need to purchase insurance because the area is not consid-ered high-risk anymore. When the levee is overtopped or fails, the resulting losses can be catastrophic (Burby, 2006; Congressional Budget Office, 2009; Kousky, 2010). But even when residents are aware that they might be at risk, they can underestimate the risk, or even simply disregard it (as in the notion of “probability neglect” discussed in Sunstein, 2002, and Sunstein and Zeckhauser, 2010) (Attanasi and Karlinger, 1979;
Erwann O. Michel-Kerjan 413
Karlinger and Attanasi, 1980). For that reason, the Federal Emergency Management Agency has now made risk awareness one of its primary campaigns and has started to require revision of the risk assessment for levee-protected areas.
Some low-income residents might not have the financial resources to pay for flood insurance. Also, given the significant amount of federal relief spent after recent catastrophes, some people may expect the federal government to always help in the aftermath of a disaster, so they feel they do not need to purchase as much insurance as they would otherwise, a version of the Samaritan’s Dilemma which Browne and Hoyt (2000) call “charity hazard.”
Finally, many people view insurance not as protection they hope never to use, but rather as an investment (Kunreuther et al., 1978). If they have not collected on their insurance after a few years, they cancel it. The actual length of time that homeowners keep their policies, and whether low retention rates can explain the lower-than-desired number of policies in force in many flood-prone areas in the United States, are open questions (GAO, 2006). Recently, in Michel-Kerjan and Kousky (2010) and in Michel-Kerjan, Lemoyne de Forges, and Kunreuther (2010), my coauthors and I performed a series of analyses of flood tenure based on the entire portfolio of the National Flood Insurance Program over the period 2000–2009. A key finding is that on average, flood insurance policies lapse after only two to four years. Surprisingly, this result is robust whether or not the policyholders live in Special Flood Hazard Areas, where flood insurance is required for those with federally-backed mortgages.
But banks and financial institutions might fail to enforce this requirement because mortgages are often transferred to other banks (and then to the secondary market) in non-flood-prone regions of the country, where there is less awareness of the flood risk and associated requirement. In other words, many banks require proof of flood insurance coverage at the time the original mortgage is issued, but may not check to see that flood insurance policies are renewed. In a survey of house-holds in coastal areas, Landry and Jahan-Parvar (2008) show that only 12 percent of responders in the Special Flood Hazard Areas say they were required to hold flood insurance by their lender.
One possible solution to ensure that people who need it have (and keep) flood coverage would be for the flood insurance program to replace traditional one-year flood insurance contracts with multiyear flood insurance policies. The Federal Emergency Management Agency could then issue five-, ten-, or even 20-year flood policies (with rates reflecting risk and reviewed periodically). The important element of this proposal is that this extended policy would not be attached to the homeowner but to the property itself and it would be instituted for all properties located in high-risk areas. This proposed approach is discussed in more detail in a series of companion papers (Jaffee, Kunreuther, and Michel-Kerjan, forthcoming; Kunreuther and Michel-Kerjan, 2009, 2010; and Michel-Kerjan, 2010).
Challenge 3: Encourage Investment in Risk Reduction Measures
Many residents living in hazard-prone areas not only lack interest in purchasing natural hazard insurance and keeping it, they also rarely undertake voluntary
loss-prevention measures to protect their property. A 1974 survey of more than 1,000 California homeowners in earthquake-prone areas revealed that only 12 percent of the respondents had adopted any protective measures (Kunreuther, et al., 1978). Fifteen years later, there was little change despite the increased public awareness of the earthquake hazard. In a 1989 survey of 3,500 homeowners in four California counties at risk from earthquakes, only 5 to 9 percent of the respondents in these areas reported adopting any loss reduction measures (Palm, Hodgson, Blanchard, and Lyons, 1990). Other studies have found a similar reluctance by residents to invest in mitigation measures to protect against floods (Burby, Bollens, Holloway, Kaiser, Mullan, and Sheaffer 1988; Laska, 1991). And despite the vast media coverage of the hurricanes and related floods of 2004 and 2005, a survey of 1,100 adults living along the Atlantic and Gulf Coasts undertaken in May 2006 revealed that 83 percent of the respondents had not taken any steps to fortify their homes (Goodnough, 2006).
Why is that the case? Many of the reasons we just discussed for insurance purchase apply here as well: a lack of accurate knowledge about risk; budget constraints; and myopia. Furthermore, the best risk reduction measure against flooding is elevating the house—which can be a significant cost for properties that are already built and would pay back only over a long period of time (Michel-Kerjan and Kousky, 2010). A homeowner who expects to move in a few years may have little incentive to make such an investment.
The development of multiyear flood insurance can help here, too, at an indi-vidual level. It could be complemented by banks or the federal government’s offering home improvement loans to flood insurance policyholders for mitigation activities. If flood insurance policyholders can benefit from an annual reduction on their flood insurance that is greater than the annual loan payment for the home improvement project, this could be a win–win situation for everyone: the homeowners are better protected and pay less by investing in risk reduction measures; the bank would have more secure mortgages; and the general public will have less of its taxes going to disaster relief. This home improvement loan could also be transferred along with the multiyear flood policy to the new owner when the house is sold, as it is done today for some mortgages. Moreover, if such multiyear flood insurance were required of all properties in hazard-prone areas (and this requirement were enforced), this would provide much-needed financial revenue for the National Flood Insurance Program by having a much larger policy base than currently exists. Of course this proposal would be more likely to be sustainable if premiums are actuarially priced for everybody.
At a community level, the federal government has also made some effort through its voluntary Community Rating System (CRS) to reward communities participating in the National Flood Insurance Program that undertake collective mitigating activi-ties—such as improved stormwater management, land-use regulations, and outreach campaigns—by reducing flood insurance premiums to residents in these communi-ties. The reduction in premiums can range up to 45 percent of the full actuarial rate (as determined by the Federal Emergency Management Agency). In Brody, Zahran, Highfield, Grover, and Vedlitz (2008) and Michel-Kerjan and Kousky (2010), evidence is provided supporting the effectiveness of CRS mitigation projects in reducing flood
Catastrophe Economics: The National Flood Insurance Program 415
damages in Texas and Florida. In practice, however, a large proportion of policyholders benefit from only a 5 to 15 percent reduction, if anything, because many communities have not done enough to warrant a more significant premium reduction.
Challenge 4: Reducing Repetitive Losses, the Number of Subsidized Properties, and Operating Expenses
The analysis of the performance of the flood insurance program at a national or even at a state level can hide important local differences. Specifically, data from the National Flood Insurance Program shows that there is an important moral hazard element for a certain number of exposed properties across states. Indeed, houses that experience multiple floods account for a very small percentage of the policies but for a large portion of all claims paid. There are about 71,000 currently insured “repetitive loss properties,” which represent about only 1.2 percent of the NFIP portfolio but account for 16 percent of total claim payments between 1978 and 2008 (24 percent if one considers both current and former repetitive loss properties) (CBO, 2009). About one in ten of these repetitive loss properties have received cumulative flood insurance reimbursements that have exceeded the value of the house (King, 2009).
Furthermore, the large majority of these repetitive loss properties do not pay the actuarial price for flood insurance. Indeed, people purchasing flood insurance for houses that were built before the introduction of the flood insurance rate maps benefit from subsidized rates. The original rationale for the subsidy to existing prop-erties was to provide an incentive to communities to join the program, to maintain the value of the home, and to ensure that new structures are built to safer standards. Because these older properties are much less likely to comply with modern flood risk mitigation standards, they are actually assessed higher premiums on average than newer properties, but even these higher premiums are not adequate to cover expected losses. On average, premiums for these older properties represent only about 40 percent of those properties’ actuarially fair rates (Hayes, Spafford, and Boone, 2007). New construction, built after the risk mapping has been made public, is charged actuarial rates. The expectation was that as the housing stock turned over, fewer and fewer policies would be subsidized, but the turnover has taken longer than anticipated (GAO, 2008b).6
Between 2006 and 2008, Congress authorized a total of $160 million to mitigate severe repetitive loss structures, including acquisition and relocation or demolition of flood-prone structures (with conversion of the underlying property to perma-nent open space) and elevation of flood-prone structures. It is too early to know the extent to which these new programs will be successful in significantly reducing claims from future floods. Moving forward, it would make sense also to reduce
6 The subsidy applies only to the first $35,000 of coverage on the building and $10,000 on contents.
Still, because of their relatively high loss experience and lower premium rates, subsidized homes have been a financial burden on the program. Total claims for these houses exceeded collected premiums by $962 million over the period 1986 through 2004 (GAO, 2008b).
gradually the subsidy currently given to these homeowners, perhaps over a period of 10 or 15 years so it is easier to do politically.
Finally, and as I discussed earlier, the payments to the Write-Your-Own insurers should also receive more scrutiny so everyone better understands what the cost of underwriting and servicing flood insurance really is. A related step might be to introduce some competition among participating insurers. For instance, the Federal Emergency Management Agency could develop a bidding system in which insurers who want to sell flood insurance on behalf of the National Flood Insurance Program must state how much they will charge to do so and for what level of service.
Challenge 5: Strengthen Financial Sustainability in the Face of Catastrophes
Hurricane Katrina remains the most financially costly natural disaster in the history of insurance worldwide (Hayes and Spafford, 2008). By its own admission, the National Flood Insurance Program will probably not be able to repay the debt it currently faces as the result of Hurricane Katrina.
A broader national discussion of the financial management of catastrophes is needed going forward (White House, 2007; Kunreuther and Michel-Kerjan, 2009). After all, the costs of flood risks are not just related to steps taken by property owners, or by local communities, but are also affected by actions of other govern-ment agencies like the U.S. Army Corps of Engineers. Had the New Orleans levees not broken, the flood insurance payments needed by the insured victims of Katrina would have been much lower.
If one feels that all taxpayers in the United States should bear at least some of the costs of catastrophic floods (as opposed to just the homeowners who live in flood-prone areas) then some of the current debt of the program could be forgiven— which is to say it could be spread over all taxpayers as a group. The program would continue to rely on federal money if another truly devastating flood were to occur in the future. Again, this is how the program has been designed.
But if one wants the finances of the program to be balanced, even after a Katrina-sized catastrophe, then the cost of flood insurance for NFIP policyholders must increase significantly. However, this might not be easy to do. Over the period 1978–2008, the average cost of flood insurance nationwide was $2.90 per $1,000 of flood insurance. To counterbalance the cumulative deficit at the end of 2008, this rate should have been increased to an average of $4.70 (taking expenses into account)—an increase of more than 60 percent. And this is a lower boundary, because such an increase would have certainly crowded out many people. Charging the higher rate could have been difficult politically, too. If that $4.70 average rate had been applied since 1978, the program would have had nearly $20 billion in reserve entering 2005. Most likely, well before 2005, the NFIP would have been criticized for charging too much.7
7 For example, it was suggested in 2009 that the Hurricane Relief Fund in Hawaii was charging too
much. Another example relates to the Pension Benefit Guaranty Corporation. In the 1990s, various interest groups lobbied the PBGC to reduce premiums because they were “too high.” In both cases,
Erwann O. Michel-Kerjan 417
This is an economic challenge for the financial management of catastrophes: because they don’t happen frequently, it is imperative to keep a long-term view, which is very hard to do. Moreover, it is always easy after the fact to say “we should have done this or that.” The reality is that we do not know when those “possible” catastrophes will happen, if at all, or how large they might be (Michel-Kerjan and Slovic, 2010).
One solution to this challenge would be for the program to transfer part of its catastrophe exposure to reinsurers or to investors in the financial markets by using alternative risk transfer instruments like a catastrophe bond (“cat bond”), a form of contingent claim.
A catastrophe bond is issued by an organization that seeks to protect its assets against a disaster. It pays interest to investors (typically hedge funds, money managers, and catastrophe funds), who buy this product like any bond. But if a catastrophe occurs of predefined magnitude (for instance, if claims in a given year exceed five years of premiums), the investors lose a least some of the face value of the bond to the organization that suffered the disaster. The market for alternative risk transfer instruments grew out of a series of insurance capacity crises in the 1970s through 1990s that led purchasers of traditional reinsurance coverage to seek more robust ways to buy financial protection. One of the advantages of cat bonds over traditional reinsurance is that the price is fixed for the maturity of the bond (typically three to five years), while the price of catastrophe reinsurance can be highly volatile after a disaster. To date, over 160 catastrophe bonds have been issued to cover earthquakes, hurricanes, terrorism, as well as pandemics around the world (Kunreuther and Michel-Kerjan, 2009).
While most issuers of catastrophe bonds have been private companies, the government of Mexico became the first government to issue such a bond to secu-ritize natural catastrophe risk. It did so in collaboration with the World Bank in 2006, then again in 2009 for a $290 million, three-year maturity bond that covers hurricanes and earthquakes. Other governments are now looking at this solution as well. To my knowledge, the idea of having the National Flood Insurance Program issue catastrophe bonds has not been seriously discussed in policy circles. The economic feasibility of this proposal still needs to be demonstrated in the context of flood insurance. But it certainly seems worth pursuing given the current level of the public debt and the fact that such a bond would transfer part of the exposure to third parties in the markets rather than, de facto, to American taxpayers.
Conclusion
The first decade of the twenty-first century, bookended by the terrorist attacks of 9/11 at the start and a financial wipeout and major oil spill at the end, may well come to be seen as the most daunting decade Americans have lived through in the
the “evidence” to support these positions was that the Fund and the PBGC were at those times running a surplus.
post–World War II era. “A Decade from Hell” is what TIME Magazine called its 2009 retrospective edition—and that was before the BP oil spill.
On the issues of flood risk, we continue to witness fast-growing population and a concentration of assets in exposed areas. Potential effects associated with changes in climate patterns may also be important in the next decades, including sea level rise and longer and more intense hurricanes to be expected in the Atlantic basin (Knutson et al., 2010). In short, more devastating floods and storm surges should be expected in the years to come.
Hurricane Betsy was the most emblematical natural catastrophe in the United States when it made landfall in 1965, triggering a few years later the creation of the National Flood Insurance Program. This paper has analyzed the NFIP’s first 40 years of operation based on a unique access to its entire portfolio. I have tried both to highlight the strengths of the program and also to suggest a number of proposals for change that can make the National Flood Insurance Program much more sustainable for years to come.
Before I end, it is worthwhile to take another look at whether flood risks are, in fact, truly “uninsurable” by private insurers. In that regard, it is instructive to observe how other countries have responded to the problem of flood insurance.
In the United Kingdom, flood insurance is provided exclusively by private insurers and is usually included in homeowners’ insurance policies (Clark, 1998). Mortgage lenders require that a property have full insurance coverage, and in this way, many homeowners are in effect covered against flood. In France, insurance coverage against flooding and other natural hazards is mandatorily included in homeowners’ policies sold by private insurers as well. Homeowner’s insurance itself is mandatory and well-enforced. Flood insurance penetration is thus virtu-ally 100 percent. In return for providing this coverage, French insurers benefit from reinsurance capacity at a very competitive price via the government-run reinsurer, which benefits from an unlimited guarantee from the French Treasury. In Germany, flood insurance is provided exclusively by private insurers but on a voluntary basis and as a supplement to homeowners’ insurance coverage. Although homeowners’ insurance penetration is high in the country (nearly 90 percent), flood insurance penetration is only about 10 percent for single homes (Thieken, Petrow, Kreibich, and Merz, 2006; von Ungern-Sternberg, 2004). In the Nether-lands, a country that is highly exposed to flood risk, the population relies entirely on government relief after the disaster. There is no flood insurance available, although a private insurance option is currently being discussed (Botzen and van den Bergh, 2008). These examples suggest that private insurance might well take more of the risk of flood insurance in a well-designed system, which is something to consider in the United States, too.
This paper discusses public flood risk insurance, but the matter of financing large-scale disasters has relevance for many other catastrophes: hurricanes, earth-quakes, pandemics, terrorist attacks, technological accidents, and even financial crises. In all of these settings, one fundamental question arises: Who will pay for the economic consequences of future catastrophes and how best to organize this
Catastrophe Economics: The National Flood Insurance Program 419
payment? Suitable answers will build on the strengths of the public and private sectors; encourage personal responsibility and the adoption of risk reduction measures; and assure rapid payments in the aftermath of a disaster. Catastrophe economics, which seeks to shed light on these issues, is likely to become a more significant field of research in the coming years.
■ I would like to thank David Autor, Jeff Brown, Mark Browne, Scott Farrow, Christopher Forys,
Thomas Hayes, Claude Henry, Robert Hoyt, Chad Jones, Carolyn Kousky, Howard Kunreuther, Craig Landry, Sabine Lemoyne de Forges, John List, Edward Pasterick, Pierre Picard, Paul Raschky, Thomas Schelling, Timothy Scoville, Timothy Taylor, David Torregrosa, Patrick Ward, and Orice Williams for discussion on this subject and insightful comments on an earlier version of this paper. The NFIP provided me with data that made this research possible. Carol Heller provided excellent research assistance. I’m also thankful to seminar participants at the American Enterprise Institute, Carnegie Mellon, Ecole Polytechnique, Florida State University, NBER, and for ongoing discussions on catastrophe economics with the insurance industry, the Association of State Flood Plain Managers, the U.S. Congress, the OECD, the White House, and the World Bank. Financial support from the Wharton Risk Management and Decision Processes center, the National Science Foundation (grant 0949710 at CMU), CREATE at USC, and the AXA and EDF chairs at the Ecole Polytechnique (France) is acknowledged.
References
Attanasi, Emil D., and Michael R. Karlinger. 1979.
“Risk Preferences and Flood Insurance.” American
Journal of Agricultural Economics, 61(3): 490–95.
Bayot, Jennifer. 2005. “Payouts Hinge on the
Cause of Damage.” New York Times, August 31.
Bin, Okmyung, and Stephen Polasky. 2004.
“Effects of Flood Hazards on Property Values: Evidence Before and After Hurricane Floyd.” Land
Economics, 80(4): 490–500.
Botzen, Wouter, and Jeroen van den Bergh.
2008. “Insurance against Climate Change and Flooding in the Netherlands: Present, Future and Comparison with Other Countries.” Risk Analysis, 28(2): 413–26.
Brody, Samuel D., Sammy Zahran, Wesley E. Highfield, Himanshu Grover, and Arnold Vedlitz. 2008. “Identifying the Impact of the Built
Environment on Flood Damage in Texas.” Disaster, 32(1): 1–18.
Browne, Mark J., and Robert E. Hoyt. 2000.
“The Demand for Flood Insurance: Empirical
Evidence.” Journal of Risk and Uncertainty, 20(3): 291–306.
Burby, Raymond J. 2001. “Flood Insurance and
Floodplain Management: The US Experience.”
Environmental Hazards, 3(3): 111–22.
Burby, Raymond J. 2006. “Hurricane Katrina
and the Paradoxes of Government Disaster Policy: Bringing about Wise Governmental Decisions for Hazardous Areas.” Annals of the American Academy of
Political and Social Science, 604(1): 171–91.
Burby, Raymond J., Scott A. Bollens, James M. Holloway, Edward J. Kaiser, David Mullan, and John R. Sheaffer. 1988. Cities under Water: A
Comparative Evaluation of Ten Cities’ Efforts to Manage Floodplain Land Use. Boulder, CO: Institute of
Behavioral Science, University of Colorado.
Chivers, James, and Nicholas E. Flores. 2002.
“Market Failure in Information: The National Flood Insurance Program.” Land Economics, 78(4): 515–21.
Management Strategy for UK Coastal Resilience.”
Geographical Journal, 164(3): 333–43.
Congressional Budget Office (CBO). 2009. The
National Flood Insurance Program: Factors Affecting Actuarial Soundness. Washington, DC.
Dixon, Lloyd, Noreen Clancy, Seth A. Seabury, and Adrian Overton. 2006. The National Flood
Insurance Program’s Market Penetration Rate: Estimates and Policy Implications. Santa Monica, CA: RAND
Corporation.
Froot, Kenneth A., ed. 1999. The Financing of
Catastrophe Risk. Chicago, IL: Chicago University
Press.
Goodnough, Abby. 2006. “As Hurricane Season
Looms, States Aim to Scare.” The New York Times, May 31.
Government Accountability Office (GAO).
2006. Flood Insurance: Extent of Noncompliance with
Purchase Requirements Is Unknown. Washington, DC:
U.S. GAO.
Government Accountability Office (GAO).
2008a. Flood Insurance. FEMA’s Rate-Setting Process
Warrants Attention. GAO-09-12. Washington, DC:
U.S. GAO
Government Accountability Office (GAO).
2008b. Flood Insurance. Options for Addressing the
Financial Impact of Subsidized Premium Rates on the National Flood Insurance Program. GAO-09-20.
Washington, DC: U.S. GAO.
Government Accountability Office (GAO).
2009. Flood Insurance: Opportunities Exist to Improve
Oversight of the Write-Your-Own Program. GAO-09-455.
Washington, DC: U.S. GAO.
Grossman, David A. 1958. “Flood Insurance: Can
a Feasible Program Be Created?” Land Economics, 34(4): 352–57.
Hayes, Thomas L., and Dan R. Spafford. 2008.
Actuarial Rate Review. Washington, DC: Federal
Emergency Management Agency.
Hayes, Thomas L., Dan R. Spafford, and J. Parker Boone. 2007. Actuarial Rate Review. Washington, DC:
Federal Emergency Management Agency.
Jaffee, Dwight, Howard Kunreuther, and Erwann Michel-Kerjan. Forthcoming. “Long Term
Property Insurance.” Journal of Insurance Regulation.
Jaffee, Dwight, and Thomas Russell. 1997.
“Catastrophe Insurance, Capital Markets and Uninsurable Risks.” Journal of Risk and Insurance, 64(2): 205–230.
Karlinger, Michael R., and Emil D. Attanasi.
1980. “Flood Risks and the Willingness to Purchase Flood Insurance.” Water Resources Research, 16(4): 617–22
King, Rawle O. 2009. National Flood Insurance
Program: Background, Challenges, and Financial Status.
Washington, DC: Congressional Research Services.
King, Rawle O. 2010. Mandatory Flood Insurance
Purchase in Remapped Residual Risk Areas Behind Levees. Congressional Research Service, 7-5700.
February 2010.
Knutson, Thomas R., John L. McBride, Johnny Chan, Kerry Emanual, Greg Holland, Chris Landsea, Isaac Held, James P. Kossin, A. K. Srivastava, and Masato Sugi. 2010. “Tropical Cyclones and
Climate Change.” Nature Geoscience, 3(3): 157–63.
Kousky, Carolyn. 2010. “Learning from
Extreme Events: Risk Perceptions after the Flood.”
Land Economics, 86(3): 395–422.
Kriesel, Warren, and Craig Landry. 2004.
“Participation in the National Flood Insurance Program: An Empirical Analysis for Coastal Properties.” Journal of Risk and Insurance, 71(3): 405–420.
Kunreuther, Howard C., Ralph Ginsberg, Louis Miller, Philip Sagi, Paul Slovic, Bradley Borkan, and Norman Katz. 1978. Disaster Insurance
Protec-tion: Public Policy Lessons. New York, NY: John Wiley.
Kunreuther, Howard, Robert J. Meyer, and Erwann Michel-Kerjan. Forthcoming. “Strategies
for Better Protection against Catastrophic Risks.” In Behavioral Foundations of Policy, ed. E. Shafir. Princeton, NJ: Princeton University Press.
Kunreuther, Howard C., and Erwann O. Michel-Kerjan. 2009. At War with the Weather: Managing
Large-scale Risks in a New Era of Catastrophes. New
York, NY: MIT Press.
Kunreuther, Howard C., and Erwann O. Michel-Kerjan. 2010. “Market and Government Failure
in Insuring and Mitigating Natural Catastrophes: How Can Long-Term Contracts Help.” Chap. 4 in Public Insurance and Private Markets, ed. Jeffrey R. Brown. Washington, DC: American Enterprise Institute Press.
Landry, Craig E., and Mohammad R. Jahan-Parvar. 2008. “Flood Insurance Coverage in the
Coastal Zone.” Available at http://ideas.repec.org /p/pra/mprapa/15498.html.
Laska, Shirley B. 1991. Floodproof Retrofitting:
Homeowner Self-Protective Behavior. Boulder, CO:
Insti-tute of Behavioral Science, University of Colorado.
Michel-Kerjan, Erwann. 2010. “Reform of the
National Flood Insurance Program: Introducing Long-Term Flood Insurance.” The Huffington Post, April 28.
Michel-Kerjan, Erwann O., and Carolyn Kousky.
2010. “Come Rain or Shine: Evidence on Flood Insurance Purchases in Florida.” Journal of Risk and
Insurance, 77(2): 369–97.
Michel-Kerjan, Erwann, Sabine Lemoyne de Forges, and Howard Kunreuther. 2010. “Policy
Ten-ure under the National Flood Insurance Program.” Unpublished Paper, Center for Risk Management, The Wharton School, Philadelphia, PA.
Erwann O. Michel-Kerjan 421
2010. The Irrational Economist: Making Decisions in
a Dangerous World. New York, NY: PublicAffairs
Press.
Palm, Risa, Michael E. Hodgson, R. Denise Blanchard, and Donald I. Lyons. 1990. Earthquake
Insurance in California: Environmental Policy and Individual Decision Making. Boulder, CO: Westview
Press.
Pasterick, Edward T. 1998. “The National Flood
Insurance Program.” Chap. 6 in Paying the Price: The
Status and Role of Insurance against Natural Disasters in the United States, ed. H. Kunreuther and R. J.
Roth, Sr. Washington, DC: Joseph Henry Press.
Skees, Jerry R. 2001. “The Bad Harvest: Crop
Insurance Reform Has Become a Good Idea Gone Awry.” Regulation, 24(1): 16–21.
Sunstein, Cass R. 2002. “Probability Neglect:
Emotions, Worst Cases, and Law.” The Yale Law
Journal, 112(1): 61–107.
Sunstein, Cass R., and Richard J. Zeckhauser.
2010. “Dreadful Possibilities, Neglected Prob-abilities.” Chap. 14 in The Irrational Economist, ed. E. Michel-Kerjan and P. Slovic. New York, NY: PublicAffairs Press.
Thieken, Annegret H., Theresia Petrow, Heidi Kreibich, and Bruno Merz. 2006. “Insurability and
Mitigation of Flood Losses in Private Households in Germany.” Risk Analysis, 26(2): 383–95.
Tobin, Richard, and Corinne Calfee. 2005.
The National Flood Insurance Program’s Mandatory Purchase Requirement: Policies, Processes, and Stake-holders. Washington, DC: American Institutes for
Research.
Vigdor, Jacob. 2008. “The Economic
After-math of Hurricane Katrina.” Journal of Economic
Perspectives, 22(4): 135–54.
von Ungern-Sternberg, Thomas. 2004. Efficient
Monopolies: The Limits of Competition in the European Property Insurance Market. Oxford University Press.
Weitzman, Martin L. 2007. “A Review of the Stern
Review on the Economics of Climate Change.”
Journal of Economic Literature, 45(3): 703–724.
Weitzman, Martin L. 2009. “On Modeling
and Interpreting the Economics of Catastrophic Climate Change.” Review of Economics and Statistics, 91(1): 1–19.
Wetmore, French (Chair), George Bernstein, David Conrad, Cynthia DiVincenti, Larry Larson, Doug Plasencia, and Russell Riggs. 2006. An
Evaluation of the National Flood Insurance Program: Final Report. (With Jacquelyn Monday, Michael
Robinson, and Marc Shapiro.) Washington, DC: American Institutes for Research.
White House. 2007. Economic Report of the
President. Washington, DC: Council of Economic