2050
ENERGY
REVOLUTION:
PATHWAY TO A CLEAN
ENERGY REVOLUTION
FOR BELGIUM
© BEL TRA/GP Introduction 3 Technical summary 4THE ‘ENERGY REVOLUTION’ SCENARIO: A SUSTAINABLE PATHWAY TO A CLEAN ENERGY FUTURE FOR BELGIUM 5
1 Development of energy demand 6
2 Population development 6
3 GDP development 6
4 Projection of energy intensities 6
5 Final energy demand 7
6 Electricity generation 8
7 Heat supply 10
8 Primary energy consumption 11
9 CO2-emissions 11
10 Costs of electricity generation 12 11 Employment in the electricity sector 13
Greenpeace calls for 13
Summary map 14
published byGreenpeace Belgium
dateJune 2006
instituteScenario developed by Stefan Kronshage, Dr. Wolfram Krewitt and Dr. Ulrike Lehr, Institute of Technical Thermodynamics, Department of Systems Analysis and Technology Assessment (DLR), Stuttgart, Germany
design&layoutTania Dunster, hemisphere, Sweden
Introduction
The climate challenge :climate change is real and is happening now. Climate change - the result of the greenhouse gases we are pumping into the atmosphere – already impacts our lives and is expected to severely affect us in the coming years. We have already experienced a global mean temperature rise of 0.6°C during the last century and, as a result of the greenhouse gases we have already pumped into the atmosphere, we are committed to 1.2° or 1.3°C warming, even if all emissions were to stop tomorrow. As highlighted by the International Panel on Climate Change (IPCC) in its
Third Assessment Report1, an increase in mean temperature above 2°C
compared to pre-industrial levels would dramatically increase the disruption of the climate system and damages to ecosystems. An average global warming of 2°C would:
* threaten millions of people with increased risk of hunger, malaria and
flooding, and billions with increased risk of water shortages, mainly among the poor and in developing countries (particularly in sub-Saharan Africa, South Asia, and parts of South-East Asia and Latin America).
* Risk melting the main ice sheets, particularly the Greenland ice sheet and
the West Antarctic ice sheet, with the probability of the sea level rising by many metres over several centuries. This would threaten large populations everywhere, particularly in low-lying areas in developing countries (such as Bangladesh, South China or Egypt) and low-lying island states everywhere. Not to mention ‘low countries’ like Belgium where, in an average scenario with sea level rising by 8 metres, more than one tenth of the territory (40% of Flanders) would be below sea level by the end of the millennium.
* Provoke damage to major ecosystems, with loss of forests and species
affecting the lives of everyone on earth, and economic costs falling disproportionately on the poor and developing countries.
The goal of responsible climate policy should therefore be to keep the increase in global mean temperature below 2°C above pre-industrial levels, and then to bring it down as quickly as possible. This requires reducing greenhouse gas emissions from industrialised countries by 80% by mid-21st century, while global emissions from all countries must be reduced by about 50% by mid-21st century.
An ‘energy revolution’ is needed :to keep global mean temperature below the 2°C level, we have a very short window of time in which to act. Within no more than one to two decades, we have to change the number one culprit as far as greenhouse gases emissions are concerned: the way we produce and consume energy. In Belgium, the energy sector accounts for about 80% of total greenhouse gas emissions.
As we face this challenge and the short period in which to act, the Belgian electricity sector, in particular, stands at a crossroads. This sector is still characterised by large, centralised power plants using fossil and nuclear fuels. Most of the operating Belgian power plants are well over 20 years old and the nuclear phase-out law foresees the closure of all reactors by 2025. Over the next twenty years, the power sector will therefore have to make large investments and decide whether the new capacity will be fossil or the efficient use of renewable energy.
Political and industry leaders should ensure that the decisions made in the next two decades help achieve the energy shift needed to contribute to the global fight against dangerous climate change, end the nuclear threat and ensure security of supply for the future.
A sustainable pathway to a clean energy future for Belgium :in order to clarify what political and industrial action needs to be taken in Belgium, Greenpeace has asked the Institute of Technical Thermodynamics, Department of Systems Analysis and Technology Assessment of the German Aerospace Center (DLR) to develop the energy blueprint outlined in this report. This blueprint shows a pathway from the unsustainable Belgian energy system today towards sustainable energy use.
This pathway demonstrates that a massive reduction of our CO2emissions and the rapid phase-out of nuclear power are indeed possible.The ‘Energy Revolution’ Scenario developed by DLR foresees the closure of all nuclear reactors, all coal power plants and a 70% reduction of Belgian CO2emissions by 2050 (compared to 1990). Instead of increasing by more than 20% between 2000 and 2050 under a Reference Scenario, per capita CO2emissions in the ‘Energy Revolution’ Scenario drop by nearly 75% in the same period. The pathway in this scenario is achieved with existing technological options offered by renewable energy sources and energy-efficiency – i.e. without making use of the ‘flexible mechanisms’ of the Kyoto Protocol, end-of-pipe solutions such as carbon capture and storage or technological fixes like ‘clean coal’.
The scenario shows that in the long run, an efficient renewable energy system will be cheaper than conventional energy use. The rapid growth of renewable energy technologies will lead to large investments. This dynamic market growth will result in a shift of employment opportunities from conventional energy-related industries to new occupational fields in the renewable energy industry. In the mid term, renewable energy sources are expected to provide between 10,000 to 14,000 jobs in the field of electricity generation alone. This scenario proves that renewable energy sources combined with energy-efficiency have the potential to enable Belgium to switch to clean energy, contribute to saving the climate, protect its economy from world market prices of imported fossil and nuclear fuels, and to provide future generations with secure access to energy.
No time to waste!
Belgium has little time left to kick start the renewable energy revolution. Belgium is not on track to meet its first Kyoto targets (-7.5% by 2008-2012) and has the lowest but one renewable energy targets of the former EU15 Member States. A delay of even a few years will make it impossible for Belgium to get back on track to achieve the needed medium- and long-term CO2reduction targets.
Whilst there are many technical options that can allow us to meet our first Kyoto targets, provided there is sufficient political will, some of these have limited potential to achieve the necessary long-term emissions reduction. Therefore, we have to make clear and precise choices today.
Greenpeace calls for Belgian policy-makers and the Belgian electricity sector to invest in our future and take action now. Belgium can
phase-out nuclear power while drastically reducing its CO2emissions.The
choice is clearly not between a nuclear disaster and climate catastrophe. The choice is between a wholly unsustainable energy system, and clean and safe energy accessible to all.
See http://www.ipcc.ch.
Technical summary
Today, in Belgium, four sectors are nearly equally responsible for energy-related CO2emissions: transport (professional and private), heating (industry, offices and housing), electricity production and industrial processes. About 98% of Belgium’s primary energy supply comes from fossil fuels (oil, gas and coal) and uranium, for all of which Belgium relies on imports. Nuclear power is only used to produce electricity and accounts for a relatively high share (about 55%) in this sector. On the other hand, nuclear power represents a much lower share of the total energy use: about 10% of the final energy consumption. Renewable energy sources (RES) only account for about 2% of the latter. Compared to the average in other EU25 Member States, this is a rather low use of RES. The most relevant sources for renewable electricity production in Belgium today are biomass, hydro power and, to a lesser extent, wind power. The current Belgian energy system is both unsustainable and challenging.The energy consumption per inhabitant is high.The same holds for the per capita CO2emission. Despite the high share of nuclear electricity, every Belgian person causes an average emission of about 11 tonnes of CO2per year (compared to an average 8 tonnes per capita and year in the EU15 Member States). At the same time, Belgium is confronted with some limitations as far as some RES are concerned: it has comparatively limited supplies of renewable energy sources suited for combined heat and power (CHP) generation and which can deliver ‘dispatchable’ energy, namely biomass and geothermal energy. Belgium is also one of the only European countries with a relatively small potential for hydro-power use. On the other hand, Belgium has a largely untapped potential for RES such as offshore wind and solar thermal energy.
Belgium is characterised by high levels of energy demand and CO2emissions, which call for prompt and determined political action to transform the current Belgian energy system.The ‘Energy Revolution’ Scenario developed in this report describes how this transformation can be achieved, i.e. a pathway which turns the present situation into a sustainable energy supply for Belgium:
* exploiting the existing large energy-efficiency potentials is crucial. This is a prerequisite for achieving a significant share of renewable energy sources in the overall energy supply system, for compensating the phasing out of nuclear energy and coal, and for reducing the
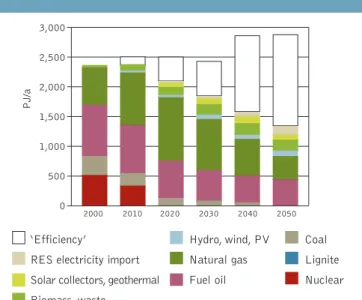
consumption of other fossil fuels. It is possible to reduce primary energy demand from about 2400 PJ/a in 2000 to 1300 PJ/a in 2050.
* The electricity sector will be the forerunner of RES utilisation. By
2050, 65% of the electricity generated in Belgium will come from renewable energy sources. A capacity of 14,000 MW will generate 38 TWh/a RES electricity in 2050. By then, the greatest contributors will be wind power, photovoltaic (PV) power and biomass. Taking renewable electricity imports into account, more than 80% of the electricity consumed in Belgium will be produced by renewables.
* In the heat supply sector, the contribution of renewables will continue to
grow, reaching a share of 43% in 2050. Solar collectors and biomass/waste in particular will substitute conventional systems for heating and cooling.
* In the long-term, substantial shares of fossil fuels for CHP are being
substituted by biomass. At the same time, the decreasing demand for heat and the potential for producing heat directly from renewable energy sources limit the further expansion of combined heat and power generation.
* Because the use of biomass for CO2reduction in stationary applications is more cost-effective, its availability in Belgium limits the use of bio fuels. On the other hand, the substitution of fossil fuels by bio fuels is an important measure for bringing down CO2emissions in the transport sector. Before bio fuels are introduced on a large scale in the transport sector, the existing large efficiency potentials have to be exploited. Because the relatively low domestic potential for biofuel generation would restrict an ambitious deployment already in 2010, the importing of bio fuels from 2010 onwards is assumed.
* By 2050, nearly 40 % of the primary energy demand can be covered by
renewable energy sources (see figure 1).
CO2EmissionsUnder the Reference Scenario, per capita CO2emissions will increase by more than 20% between 2000 and 2050, far removed from a sustainable development path. Under the ‘Energy Revolution’
Scenario, per capita CO2emissions drop by nearly 75% between 2000 and
2050 (from 10.8 t/capita to 2.8 t/capita).
Under the ‘Energy Revolution’ Scenario, CO2emissions will decrease to 31
million tons per year in 2050, a reduction of approximately 72% compared to 2000 and 70% compared to 1990.
Other measures could be taken to reduce overall Belgian emissions by targeting other greenhouse gases, methane, nitrous oxide and F-gases,
which have a higher global warming potential than CO2. Such measures,
however, go beyond the scope of this report.
Costs of electricity generationCompared to the Reference Scenario, the massive introduction of renewable energy technologies for electricity generation under the ‘Energy Revolution’ Scenario leads to higher specific generation costs from 2010 until 2040. These higher costs are to a large extent compensated by the reduced demand for electricity. By 2050, with escalating fossil fuel prices, costs approach a similar level.
Assumptions as to fossil fuel prices in the Reference and ‘Energy Revolution’ Scenarios are relatively conservative. Any further increase in fossil fuel prices is a direct additional burden on fossil electricity generation, and reduces the cost-gap between the two scenarios.
Including the costs of CO2emissions would clearly advance the long-term
economic benefits of the ‘Energy Revolution’ Scenario. When these CO2
-related costs are taken into account, electricity generation costs in 2050 are actually 1.3 ct/kWh lower under the ‘Energy Revolution’ Scenario. Additional costs should also be weighed against the increase of risks, e.g. of flooding and heat waves, associated with climate change, which are potentially much higher.
Employment in the electricity sector The growing contribution of renewables is expected to provide between 10,000 to 14,000 jobs (gross figures) in the field of electricity generation from renewable energy sources in the mid-term. In the long-term, because of increasing labour productivity and growing import quotas, the total number of jobs related to electricity generation is expected to shrink.
The number of jobs in the energy-efficiency sector is expected to increase, but this goes beyond the scope of this report.
3,000 2,500 2,000 1,500 1,000 500 0 2000 2010 2020 2030 2040 2050 PJ/a
FIGURE1: DEVELOPMENT OF PRIMARY ENERGY CONSUMPTION UNDER THE‘ENERGY REVOLUTION’SCENARIO
(‘EFFICIENCY’ = REDUCTION COMPARED TO THE REFERENCE SCENARIO)
Hydro, wind, PV Natural gas Fuel oil ‘Efficiency’
RES electricity import Solar collectors, geothermal Biomass, waste
Coal Lignite Nuclear
THE ‘ENERGY REVOLUTION’ SCENARIO: A SUSTAINABLE PATHWAY TO A CLEAN ENERGY FUTURE FOR BELGIUM
Scenarios are used to describe possible future development paths, to give decision-makers an overview of future perspectives and to indicate how far they can shape the future energy system. Two different scenarios are presented here to characterise the wide range of possible development paths for the future Belgian energy supply system: a Reference Scenario, reflecting a continuation of current trends and policies into the future (business-as-usual), and the ‘Energy Revolution’ Scenario, a normative scenario developed in a back-casting process. Both scenarios are based on the methodology and assumptions of the European (EU25) scenario
developed by DLR for Greenpeace2.
Scenarios by no means claim to predict the future; they simply describe two potential development paths out of the broad range of possible ‘futures’. The ‘Energy Revolution’ Scenario is designed to indicate the efforts and actions required to achieve ambitious climate mitigation objectives, and to illustrate the options Belgian policy-makers have at hand to cope with the challenge of changing our energy supply system into a sustainable one.
Data compilation To set up its scenarios, DLR used – in addition to its internal expertise - commonly accessible European databases and studies, as well as methods of extrapolation and reasoned estimation where no explicit data was available.The following main European data sources were used:
* The European Commission’s ‘European Energy and Transport – Trends
to 2030’3and ‘European Energy and Transport – Scenarios on key
drivers’4publications.
* The Eurostat Online Database for base-year model calibration.
Data and scenarios from regional or national sources, whenever they were available, were used to refine and upgrade the database. The following studies were thus used to support the development of the ‘Energy Revolution’ Scenario:
* Renewable energy revolution in Belgium 1974-2025,
Belgian Science Policy, 2004.
* Optimal offshore wind energy developments in Belgium,
Belgian Science Policy, 2004.
* Monitoring and Modelling Initiative on the Targets for Renewable
Energy (MITRE), Country Report Belgium, European Commission.
* The share of renewable energy in the EU, Country Profiles, Commission
Staff Working Document, 2004.
* Gestion de la demande d’énergie dans le cadre des efforts à accomplir
par la Belgique pour réduire ses émissions de gaz à effet de serre, Final report for the Ministry of Economic Affairs, Fraunhofer Institute for Systems and Innovation Research, 31 May 2003.
* Wind Force 12 - a blueprint to achieve 12% of the world’s electricity
from wind power by 2020, the European Wind Energy Association (EWEA) and Greenpeace, 2005.
* De mogelijkheden en belemmeringen voor hernieuwbare energie in
Vlaanderen, ODE-Vlaanderen, September 1997.
* Potential of short-term energy efficiency and energy saving measures
in Belgium, E-ster, May 2005.
Reference scenario The Reference Scenario is based on the
aforementioned European Commission publications. This Scenario takes existing policies into account. Baseline assumptions include, for example, the modernisation of the EU economy and the completion of the internal electricity and gas markets, certain policies to support renewables and energy-efficiency, as well as the nuclear phase-out decision in some Member States. The Reference Scenario does not include additional policies to reduce greenhouse gas emissions. As the European Commission’s scenario only covers a time horizon up to 2030, it has been extended based on the extrapolation of key macroeconomic indicators. This Scenario provides a baseline reference for comparison with the ‘Energy Revolution’ Scenario. ‘Energy revolution’ scenario The ‘Energy Revolution’ Scenario is a normative scenario developed in a back-casting process. To prepare this scenario, DLR used the simulation tool PlaNet, which allows for modelling the energy system structure of the region under consideration and for preparing long-term energy supply scenarios in line with given targets. These key targets were:
* a reduction of Belgian CO2emissions, which is consistent with an overall greenhouse gas emissions reduction target of 80% by 2050 for industrialised countries.
* The rapid phasing out of all nuclear reactors.
Although general framing conditions referring to population development and GDP growth remain unchanged compared to the Reference Scenario, the ‘Energy Revolution’ Scenario is therefore characterised by:
* the closure of nuclear power stations after a lifetime of 30 years
(instead of 40 years as foreseen in the nuclear phase-out law), on the basis of real-life start of operation for each nuclear power plant.
* Significant efforts towards fully exploiting the large energy-efficiency potentials.
* As far as possible, all cost-effective renewable energy potentials are made accessible for heat and electricity generation, as well as for the production of bio fuels. Renewable electricity technologies are expanded to the limits of their estimated economic potentials while still ensuring realistic growth rates of capacity expansion. When only a mid-term potential was provided, a higher share (more than 100% of the mid-term potential) is generally assumed to be the long-term potential (2050). The share of renewables has to remain in line with a secured capacity supply of at least 120% of the expected peak demand (see below).
* Due to limited potential and nature conservation concerns, hydro-power
does not significantly increase from its 2000 level.
* Available biomass is optimised in CHP power plants
(as opposed to conventional ones).
* The domestic biomass potential does not cover demands from the power,
heat and transportation sectors. Despite this, a share of bio fuels for cars equal to the EU25 average level is assumed.Therefore, bio fuel imports could be necessary, which cannot be made explicit using the PlaNet model.
* Fossil fuel power plants are used to fill the gap between renewable power
generation and electricity demand.They are provided to an extent that the secured capacity exceeds the estimated peak load demand by at least 20%. Natural gas as primary energy carrier is preferred to fuel oil and coal. The following chapters outline the main results of the ‘Energy Revolution’ Scenario, with special emphasis on the electricity sector.
The complete PlaNet results worksheets are available by contacting Greenpeace.
Energy revolution, a sustainable pathway to a clean energy future for Europe. Available at: www.greenpeace.be. European Energy and Transport – Trends to 2030, European Commission, Directorate-General for Energy and Transport, 2003. ISBN 92-894-4444-4.
European Energy and Transport – Scenarios on key drivers, European Commission, Directorate-General for Energy and Transport, 2004. ISBN 92-894-6684-7
2 | 3 | 4 |
1. Development of energy demand
The development of the future energy demand is basically determined by three key factors:
* Population development, i.e. the number of people consuming energy or
using energy services.
* The development of economic activities, for which the Gross Domestic
Product (GDP) is a commonly used indicator. In general, an increase in GDP accompanies an increase in energy demand.
* Energy intensity, which is a measure of how much energy is required to
produce, for example, a unit of GDP. Exploiting the still large energy-efficiency potentials can reduce energy intensities.
Both the Reference and the ‘Energy Revolution’ Scenarios are based on the same projections of population development and the development of economic activities. The future development of energy intensities, however, differs between the two, taking into account the efforts for increasing energy-efficiency under the ‘Energy Revolution’ Scenario.
2. Population development
Following the population development projection of the Belgian Directorate-General for Statistics and Economic Information, the population in Belgium is expected to grow from 10.3 million people in 2000 to 11 million people around 2040 (see figure 2). Then population growth is expected to almost stall at that level until 2050. Growth in coming decades means a further challenge for reducing energy demand and thus the pressure on the environment and energy resources.
3. GDP development
While we anticipate that the Belgian population will only slightly grow, people will continue to enjoy a rise in living standards.The per capita GDP, often considered as an aggregated welfare indicator, is today above the European average. As an advanced economy, Belgium is expected to have an average GDP growth of 1.9% per year until 2050, which is below the European average.Thus, in 2050, the per capita GDP in Belgium is 62,000€(see figure 3).
4. Projection of energy intensities
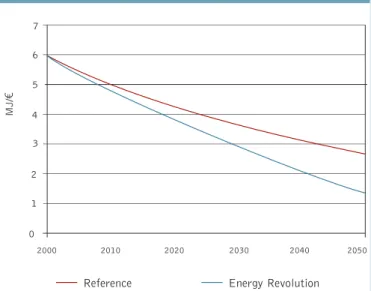
Growing economic activity and economic welfare does not necessarily result in an equivalent increase in energy demand. The energy demand per unit GDP in Belgium today is significantly higher than the European average, indicating that there is still a large potential for exploiting energy-efficiency measures. Even under the Reference Scenario, it is assumed that energy intensity will be reduced by about 1.6 % per year, leading to a reduction of final energy demand per unit GDP by 55 % between 2000 and 2050. Under the ‘Energy Revolution’ Scenario, it is assumed that due to active policy support, the technical potential for efficiency measures is largely exploited. This results in an average reduction of energy intensity of 2.9 % per year between 2000 and 2050 and an overall reduction of energy intensity by almost 80 % (see figure 4).
11.0
2000 2010 2020 2030 2040 2050
FIGURE2:POPULATION DEVELOPMENT PROJECTION FOR BELGIUM
10.5 10.0 9.5 9.0 8.5 8.0 Mi ll ion people 11.5 12.0 2000 2010 2020 2030 2040 2050
FIGURE3:PROJECTION OF AVERAGE GDP PER CAPITA DEVELOPMENT IN BELGIUM 40,000 30,000 20,000 10,000 0 GDP per capita (€2000) 70,000 60,000 50,000 2000 2010 2020 2030 2040 2050
FIGURE4:PROJECTION OF ENERGY INTENSITIES UNDER THE REFERENCE AND‘ENERGY REVOLUTION’SCENARIO IN BELGIUM
4 3 2 1 0 7 6 5
Reference Energy Revolution
MJ/
© P
.
LANGR
OCK/ZENIT/GP
5. Final energy demand
Combining projections on population development, GDP growth and energy intensities result in future development pathways for final energy demand in Belgium, shown in figure 5 for both the Reference and the ‘Energy Revolution’ Scenarios. Under the Reference Scenario, the total final energy demand increases by 13% from 1480 PJ/a in 2000 to 1670 PJ/a in 2050. In the ‘Energy Revolution’. Scenario, final energy demand peaks in 2010, and then falls back to 840 PJ/a in 2050, which is more than 40 % less than today’s final energy demand.
The accelerated increase in energy-efficiency is a crucial prerequisite for achieving a sufficiently large share of renewable energy sources in the Belgian energy supply. Moreover, energy-efficiency is not only beneficial to the environment, but also from an economic point of view. Taking into account full service life, in most cases the implementation of energy-efficiency measures saves costs compared to the additional energy supply. The mobilisation of cost-effective energy saving potentials leads directly to the reduction of costs. Therefore, a dedicated energy-efficiency strategy also helps to compensate in part for the additional costs required during the market introduction phase of renewable energy sources.
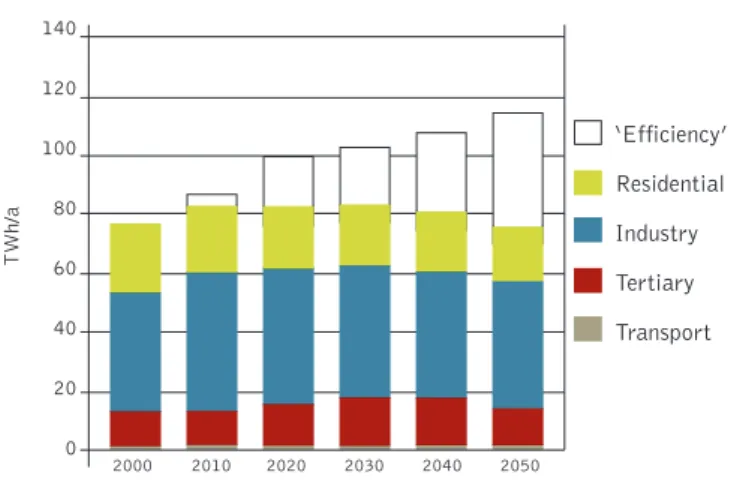
Under the ‘Energy Revolution’ Scenario, the final electricity demand is expected to peak around 2030. In coming years, the Belgian industry sector is expected to push up electricity demand (figure 6). Due to the exploitation of efficiency measures, electricity consumption starts to decrease in the industry sector after 2020. While electricity demand in the residential sector grows in the Reference Scenario, changing consumption patterns as well as technical and constructional improvements can immediately switch the trend and make residential electricity consumption fall. In the tertiary sector (services and agriculture), the peak of electricity demand will not happen before 2030.
Despite continuous economic growth, after 2030 overall electricity consumption is anticipated to drop, leading to an electricity demand of about 76 TWh/a, which is slightly lower than today. Compared to the Reference Scenario, efficiency measures avoid the generation of about 40 TWh/a in 2050. The continuous reduction in energy demand can be achieved in particular by using highly efficient electronic devices representing the best available technology in all demand sectors.
FIGURE5:PROJECTION OF TOTAL FINAL ENERGY DEMAND BY SECTOR FOR BOTH THE REFERENCE AND‘ENERGY REVOLUTION’SCENARIOS
2000 2010 2020 2030 2040 2050 800 600 400 200 0 PJ/a 1,000
Reference Scenario Energy Revolution Scenario
Transport Services Industry Residential
1,600 1,400 1,200 2000 2010 2020 2030 2040 2050 800 600 400 200 0 PJ/a 1,000 1,600 1,400 1,200 1,800 1,800 140 120 100 80 60 40 20 0 2000 2010 2020 2030 2040 2050 TWh/a
FIGURE6:DEVELOPMENT OF FINAL ELECTRICITY DEMAND BY SECTORS
(‘EFFICIENCY’ = REDUCTION COMPARED TO THE REFERENCE SCENARIO)
‘Efficiency’ Residential Industry Tertiary Transport
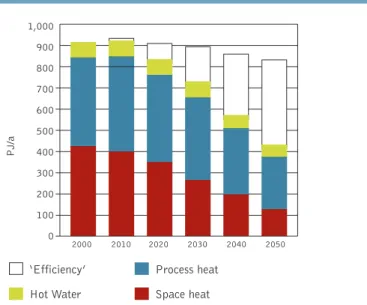
Solar architecture in both residential and commercial buildings helps to curb the growing demand for active air-conditioning. Efficiency gains in the heat supply sector are even larger. Under the ‘Energy Revolution’ Scenario, the final energy demand for heat supply will be reduced by almost 50% by 2050 (figure 7). Compared to the Reference Scenario, which is characterised by putting less effort into the implementation of energy-efficiency measures, in 2050, the consumption of more than 400 PJ/a can be avoided through efficiency gains. Space heating is by far the largest contribution to this reduction, as the result of energy-related renovation of existing residential buildings, as well as the introduction of low-energy standards and ‘passive houses’ for new buildings, enjoying both the same comfort and energy services, will accompany a much lower energy demand in the future.
Reducing energy demands in industry, the residential and the tertiary sectors is complemented by significant efficiency gains in the transport sector, which is not analysed in detail in the present study. Under the ‘Energy Revolution’ Scenario, it is assumed that the final energy demand for transportation will be reduced from 340 PJ/a in 2000 to 200 PJ/a in 2050. This reduction in energy demand can be achieved by the
introduction of highly efficient vehicles, by shifting the transport of goods from road to rail, and by changes in mobility-related behaviour patterns.
6. Electricity generation
In the ‘Energy Revolution’ Scenario, the development of the electricity supply sector is characterised by a dynamically growing RES market and a continuously increasing share of renewable energy sources. Fossil fuel power plants are used to fill the gap between renewable power generation and electricity demand. Secured capacity is always exceeding the estimated peak load demand by at least 20%.
The following strategy paves the way for a future renewable energy supply:
* phasing out nuclear electricity generation by shutting down plants after
a lifetime of 30 years. This means that no power from nuclear sources is produced from 2015 onwards, corresponding to an abatement of 32 TWh/a for the decade 2010-20205. This is possible, on the one hand,
because the demand for power generation from condensation power plants declines by about 18 TWh/a in that decade thanks to a strong growth in CHP power production. The remaining 14 TWh/a are provided by highly efficient gas-fired combined-cycle power plants and emerging wind and biomass electricity generation.
* At the same time, reducing the use of carbon-intensive solid fossil fuels
for electricity generation shall be a priority target for Belgian energy policy. As a first step, coal power plants can be substituted by bringing into operation new and highly efficient gas-fired combined-cycle power plants, and again by increasing the capacity of wind turbines and biomass. The potential for wind (both onshore and offshore) is expected to be a capacity of around 7,000 MW. Photovoltaic solar energy will contribute substantial shares of electricity from 2030 onwards. In the long-term, the most important sources of electricity generation will be wind, PV, biomass and natural gas.
* Because of limited potential and nature conservation concerns, the use
of hydro-power will remain limited and will not grow much compared to 2000 levels.
* The installed capacity of renewable energy technologies will increase
from 400 MW in the year 2000 to 14,000 MW in 2050. This growth in RES capacity by a factor of 35 in 50 years requires policy support and well-designed policy instruments.
* By 2050, 65% of the electricity produced in Belgium comes from
renewable energy sources (see figure 9).
* Because of a still growing electricity demand and the age of existing power plants, there will be large demand for investment in new capacities during the next 20 years. As investment cycles in the power sector are long, decisions for restructuring the electricity supply system need to be taken now.
At each point of time (2000, 2010, ...), the capacity still in operation is accounted.
5 | 1,000 900 800 700 600 500 400 300 200 100 0 2000 2010 2020 2030 2040 2050 PJ/a
FIGURE7:DEVELOPMENT OF FINAL ENERGY DEMAND FOR HEAT SUPPLY
‘Efficiency’ Hot Water
Process heat Space heat
To achieve an economically attractive growth in renewable energy sources, a balanced and timely mobilisation of all available RES sources is of great importance. This mobilisation depends on technical potentials, current costs, cost-reduction potentials, and technological maturity. Figure 10 and table 1 show the complementary evolution of the different RES
technologies over time. Wind turbines and biomass power plants will mainly contribute to the growing market share of RES technologies, which will be complemented by an increasing contribution from PV power.
© B
.
NIMTSCH/GP
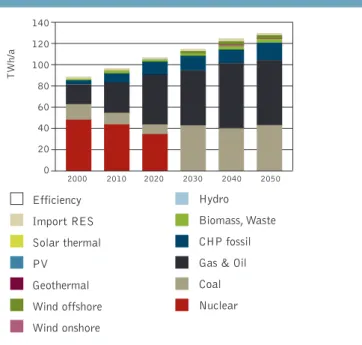
FIGURE8:DEVELOPMENT OF THE ELECTRICITY SUPPLY STRUCTURE UNDER THE REFERENCE SCENARIO
140 120 100 80 60 40 20 0 2000 2010 2020 2030 2040 2050 TWh/a Efficiency Import RES Solar thermal PV Geothermal Wind offshore Wind onshore Hydro Biomass, Waste CHP fossil Gas & Oil Coal Nuclear
FIGURE9:DEVELOPMENT OF THE ELECTRICITY SUPPLY STRUCTURE UNDER THE‘ENERGY REVOLUTION’SCENARIO
(‘EFFICIENCY’ = REDUCTION COMPARED TO THE REFERENCE SCENARIO) 140 120 100 80 60 40 20 0 2000 2010 2020 2030 2040 2050 TWh/a Efficiency Import RES Solar thermal PV Geothermal Wind offshore Wind onshore Hydro Biomass, Waste CHP fossil Gas & Oil Coal Nuclear 40 35 30 25 20 15 10 5 0 2000 2010 2020 2030 2040 2050 TWh/a
FIGURE10:GROWTH OF RES ELECTRICITY GENERATION UNDER THE
‘ENERGY REVOLUTION’SCENARIO,BY INDIVIDUAL SOURCES
PV Geothermal
Wind offshore
Wind onshore Hydro small
Biomass Hydro large 2000 103 6 97 14 14 0 0 227 394 2010 109 7 102 855 405 450 15 481 1460 YEAR Hydro - small (< 1 MW) - large (> 1 MW) Wind - onshore - offshore Solar PV Biomass Total
TABLE1:PROJECTION OF RES CAPACITY FOR ELECTRICITY GENERATION UNDER THE‘ENERGY REVOLUTION’SCENARIO,IN MW
2020 116 9 107 3307 1639 1668 241 1375 5039 2050 119 10 109 6945 2741 4204 5013 1973 14049 2030 119 10 109 4769 2203 2566 1208 1934 8030
7. Heat supply
In 2000, renewables provided about 2.6 % of Belgian energy demand for heat supply, the main contribution being biomass. Past experience in several countries shows that it is easier to implement effective support instruments in the grid-bound electricity sector than in the heat market, with its multitude of different actors. Dedicated support instruments are therefore required to ensure a continuously dynamic development of renewables in the heat market. Assuming such a supportive environment, the share of renewables in the heat sector closely follows the growth in the electricity sector until 2020/2030. After this period, RES growth in the heat sector stalls due to the limited potentials of biomass, waste and geothermal energy sources. The share of renewables still rises significantly between 2040 and 2050 as total heat demand declines:
* energy-efficiency measures can reduce the current energy demand for
heat supply by about 50 %.
* Solar collectors, biomass/biogas and, to a lesser extent, geothermal energy
are increasingly substituting conventional fossil-fired heating systems.
* A shift from coal and oil to natural gas in the remaining conventional
applications leads to a further reduction of CO2emissions. Figure 12 shows the crucial strategic importance of heat consumption savings for gaining substantial contributions of renewable energy sources.
FIGURE11:DEVELOPMENT OF THE HEAT SUPPLY STRUCTURE UNDER THE REFERENCE SCENARIO
1,000 900 800 700 600 500 400 300 200 100 0 2000 2010 2020 2030 2040 2050 PJ/a ‘Efficiency’ Electricity RES direct Fossil direct RES CHP Fossil CHP
Fossil distr. heating RES distr. heating
FIGURE12:DEVELOPMENT OF THE HEAT SUPPLY STRUCTURE UNDER THE‘ENERGY REVOLUTION’SCENARIO
(‘EFFICIENCY’ = REDUCTION COMPARED TO THE REFERENCE SCENARIO) 1,000 900 800 700 600 500 400 300 200 100 0 2000 2010 2020 2030 2040 2050 PJ/a ‘Efficiency’ Electricity RES direct Fossil direct RES CHP Fossil CHP
Fossil distr. heating RES distr. heating
8. Primary energy consumption
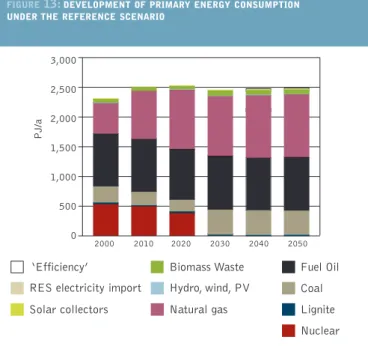
Taking into account the assumptions outlined above, the resulting primary energy consumption in Belgium under the ‘Energy Revolution’ Scenario is shown in figure 14. Compared to the Reference Scenario (figure 13), the primary energy demand will be reduced by almost 50% in 2050. Nearly 40% of the remaining primary energy demand can be covered by renewable energy sources.
Because of the method generally used for the calculation of primary energy consumption, the share of renewables seems to be lower than their actual importance for providing energy carriers. This is due to the fact that the amount of electricity generation from hydro, wind, solar and
geothermal energy equals the primary energy consumption, while for nuclear and fossil fuels, only a fraction of the primary energy gets transformed into electricity due to substantial heat losses.
9. CO2emissions
Despite the national target of reducing greenhouse gas emissions (-7.5% by
2008-2012 compared to 1990), Belgian CO2emissions increased by 10%
between 1990 and 2000, reaching in 2000 a level of about 111 million tons per year. Under the ‘Energy Revolution’ Scenario, CO2emissions will decrease to 31 million tons per year in 2050, a reduction of approximately 72% compared to 2000 and 70% compared to 1990 (see figure 15). Annual per capita emissions will drop from 10.8 t/capita in 2000 – which is clearly above the European average of 7.9 t/capita – to 2.8 t/capita in 2050, a drop of nearly 75%. Substituting coal-fired power plants with highly efficient natural gas-fired power plants and electricity from renewable energy sources provides the main contribution for reducing CO2intensity in the electricity sector, despite the phase-out of nuclear power generation. Additional measures could be taken to reduce overall Belgian emissions by targeting other greenhouse gases (methane, nitrous oxide and F-gases),
which have a higher global warming potential than CO2. Such measures,
however, go beyond the scope of this report.
FIGURE13:DEVELOPMENT OF PRIMARY ENERGY CONSUMPTION UNDER THE REFERENCE SCENARIO
3,000 2,500 2,000 1,500 1,000 500 0 2000 2010 2020 2030 2040 2050 PJ/a ‘Efficiency’
RES electricity import Solar collectors Biomass Waste Hydro, wind, PV Natural gas Coal Fuel Oil Lignite
FIGURE14:DEVELOPMENT OF PRIMARY ENERGY CONSUMPTION UNDER THE‘ENERGY REVOLUTION’SCENARIO
(‘EFFICIENCY’ = REDUCTION COMPARED TO THE REFERENCE SCENARIO)
2000 2010 2020 2030 2040 2050 3,000 2,500 2,000 1,500 1,000 500 0 PJ/a 160 140 120 100 80 60 40 20 0 2000 2010 2020 2030 2040 2050 Mi ll t/a
FIGURE15:DEVELOPMENT OF CO2 EMISSIONS BY SECTOR UNDER THE
‘ENERGY REVOLUTION’SCENARIO
(‘EFFICIENCY’ = REDUCTION COMPARED TO THE REFERENCE SCENARIO)
‘Efficiency’ Transport
Residential
Tertiary sector Public electricity & CHP
Industry Nuclear
‘Efficiency’
RES electricity import Solar collectors Biomass Waste Hydro, wind, PV Natural gas Coal Fuel Oil Lignite Nuclear
10. Costs of electricity generation
In the Reference Scenario, nuclear power (until 2025) and coal (later on) provide a substantial share of electricity generation. The cost of electricity thereby increases less than in a scenario with a higher share of electricity produced by gas-fired power plants.
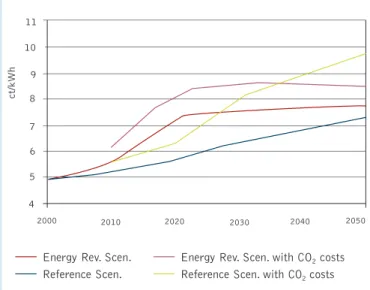
As figure 16 shows, the massive introduction of renewable energy
technologies for electricity generation under the ‘Energy Revolution’ Scenario leads to higher specific generation costs from 2010 until 2040 compared to the Reference Scenario. In 2050, with escalating fossil fuel prices, costs approach a similar level in 2050, and the gap shrinks to 0.4 ct/kWh. Any increase in fossil fuel prices beyond the relatively conservative price projection given in table 2 would, however, be an additional direct burden on fossil electricity generation, and thus reduce the cost-gap between the two scenarios.
When taking the costs of CO2emissions into account, because of the high CO2intensity of electricity generation under the Reference Scenario, there is break-even around 2037. In 2050, the specific electricity generation costs are actually 1.3 ct/kWh lower under the ‘Energy Revolution’ Scenario. Figure 17 shows that the higher specific electricity generation costs under the ‘Energy Revolution’ Scenario are also to a large extent compensated by the reduced demand for electricity. Assuming average costs of 4.5 ct/kWh for implementing energy-efficiency measures, the additional cost for electricity supply under the ‘Energy Revolution’ Scenario – again, excluding the costs of CO2emissions – is only slightly higher than in the Reference Scenario in 2010. After 2020, when the cost difference achieves a maximum of 1.2 billion €/a, these additional costs, which stand for Belgian society’s investment in a climate-friendly, safe and economic energy supply future, will decrease, and before 2040 electricity supply under the ‘Energy Revolution Scenario’ will become cheaper than in the Reference Scenario. The inclusion of the costs of CO2emissions would provide further evidence of the long-term economic benefits of the ‘Energy Revolution’ Scenario.
Additional costs should also be weighed against the increase of the risks, e.g. of flooding and heat waves, associated with climate change, which are potentially much higher.
bi ll io n € /a
FIGURE17:DEVELOPMENT OF TOTAL ELECTRICITY SUPPLY COSTS
(WITHOUT TAKING THE COST OF CO2INTO ACCOUNT);
REF=REFERENCE SCENARIO,ALT= ‘ENERGY REVOLUTION’SCENARIO
10 9 8 7 6 5 4 3 2 1 0
REF ALT REF ALT REF ALT REF ALT
Generation Efficiency REF ALT 2000 2010 2020 2030 2040 2050 2000 5.3 2.8 1.4 Crude oil Natural gas Hard coal
TABLE2:ASSUMED EVOLUTION OF PRIMARY ENERGY CARRIER PRICES IN€2000/GJ 2050 8.9 8.6 2.8 2030 6.7 6.3 2.3 2020 5.6 5.0 2.1 2010 4.8 4.1 1.9 Source:DLR, 2005 11 2000 2010 2020 2030 2040 2050
FIGURE16:DEVELOPMENT OF SPECIFIC ELECTRICITY GENERATION COSTS UNDER THE TWO SCENARIOS
(CO2COSTS INCREASE FROM15€/TCO
2IN2010TO50€/TCO2IN2050) 10 9 8 7 6 4 c t/kWh 5
Energy Rev. Scen.
Reference Scen. with CO2costs
Energy Rev. Scen. with CO2costs
11. Employment in the electricity sector
The rapid growth of renewable energy technologies described under the ‘Energy Revolution’ Scenario will lead to large investments in new technologies. This dynamic market growth results in a shift of employment opportunities from conventional energy-related industries to new occupational fields in, for example, the wind and solar industry. The growing contribution of renewables is expected to provide between 10,000 to 14,000 jobs in the field of electricity generation from renewable energy sources in the mid- to long-term (figure 18)6. This
includes both ‘direct’ effects related to electricity generation and the production of investment goods, as well as ‘indirect’ effects covering the upstream production chain.
The employment effects are estimated by using assumptions on import shares, labour productivity and their growth rates until 2050. Because of increasing labour productivity and growing import quotas, in the long-term the total number of jobs related to electricity generation is expected to shrink. The number of jobs in the energy-efficiency related industries is also expected to increase substantially, but this goes beyond the scope of this report.
Greenpeace calls for
Greenpeace calls for Belgian policy-makers to take action and invest in our future.
Greenpeace calls for an energy revolution made of the following measures: 1. A long-term vision and target on greenhouse gas reduction by the Belgian governments (federal and regional)
* Greenpeace expects the federal Environment minister to urgently lead a
process in order to adopt, by the end of 2006, a binding national long-term greenhouse gas emissions reduction target consistent with limiting the global temperature rise to below 2°C. For industrialised countries, this translates to 80% below 1990 levels by 2050.
2. The closure of all nuclear power plants
* Greenpeace urges political parties in the federal government to ensure
the closure of all nuclear power plants. 3. The closure of all coal power plants
* Greenpeace urges the federal and regional governments to come up, by
the end of 2006, with an action plan to ensure the closure of all coal power plants.
4. An increased support for renewables
* Greenpeace urges the federal and regional governments to adopt
concrete and ambitious measures to promote renewable energy sources by namely supporting, at the European level, the adoption of a legally binding target to achieve a minimum of 25% renewable energy (combined with efficiency) from primary energy in the EU25 by 2020 (within this overall target, sectoral targets need to be adopted for the electricity, heat and transport sectors).
* Greenpeace also urges these governments to take political action by the
end of the year to overcome distortions in the Belgian electricity market created by decades of massive financial, political and structural support towards conventional polluting and dangerous technologies, in order to create a level-playing field for renewable energy sources. Adoption of polluter-pays taxation and internalisation of external costs, or equivalent compensation to renewable energy sources, is important to achieve fairer competition on the electricity market.
* This also requires reforming the electricity sector to enable new
renewable energy technologies to be developed on a larger scale by removing long and complex authorisation procedures, and granting renewable energies priority access to the grid at fair, transparent prices. 5. An increased support for energy-efficiency
* Greenpeace urges the federal and regional Energy ministers to lead
their governments into adopting a concrete and ambitious action plan to promote energy-efficiency, both in the production (co-generation) and use of energy. Authorities should ‘govern by example’ by reducing energy consumption in the public sector (e.g. large-scale relighting), strengthen and control existing energy-efficiency standards, adopt further fiscal measures to stimulate energy-efficiency and run information and awareness campaigns targeting all consumers and the industry.
FIGURE18:PEOPLE IN EMPLOYMENT IN BELGIUM RESULTING FROM ELECTRICITY GENERATION FROM RENEWABLE ENERGY SOURCES IN THE‘ENERGY REVOLUTION’SCENARIO
14 12 10 8 6 4 2 0 2000 2010 2020 2030 2040 2050 people i n employment (i n 1,000) PV
Wind Hydro small
Biomass
Gross employment figures are given here. They relate to the total amount of people employed in the renewable energy sectors. Net employment effects, which considers that other jobs might get lost by an expansion of renewable energy technologies, are not taken into account.
ENERGY REV
OLUTION:
A SUST
AINABLE P
A
THW
A
Y
T
O
A CLEAN ENERGY
REV
OLUTION FOR BELGIUM
(f ossil & waste) INST ALLED C A P
Note:
all data are r
ound ed to the lo we r 250MW (f or eff ic iency , to the lo we r TWh) 1 symbol = 250 MW (f or eff ic iency , 1 symbol = 1 TWh) TWh TWh TWh TWh TWh
FUTURE FOR
BELGIUM
asbl greenpeace belgium vzw
Haachtsesteenweg 159 Chaussée de Haecht, 1030 Brussels, Belgium t +32 (0)2 274 0200 f +32 (0)2 274 0230
[email protected] www.greenpeace.be