INFORMS is located in Maryland, USA
Marketing Science
Publication details, including instructions for authors and subscription information: http://pubsonline.informs.org
Consumer Protection on Kickstarter
Daniel Blaseg, Christian Schulze, Bernd Skiera
To cite this article:
Daniel Blaseg, Christian Schulze, Bernd Skiera (2020) Consumer Protection on Kickstarter. Marketing Science 39(1):211-233. https://doi.org/10.1287/mksc.2019.1203
Full terms and conditions of use: https://pubsonline.informs.org/Publications/Librarians-Portal/PubsOnLine-Terms-and-Conditions
This article may be used only for the purposes of research, teaching, and/or private study. Commercial use or systematic downloading (by robots or other automatic processes) is prohibited without explicit Publisher approval, unless otherwise noted. For more information, contact [email protected].
The Publisher does not warrant or guarantee the article’s accuracy, completeness, merchantability, fitness for a particular purpose, or non-infringement. Descriptions of, or references to, products or publications, or inclusion of an advertisement in this article, neither constitutes nor implies a guarantee, endorsement, or support of claims made of that product, publication, or service.
Copyright © 2020, The Author(s)
Please scroll down for article—it is on subsequent pages
With 12,500 members from nearly 90 countries, INFORMS is the largest international association of operations research (O.R.) and analytics professionals and students. INFORMS provides unique networking and learning opportunities for individual professionals, and organizations of all types and sizes, to better understand and use O.R. and analytics tools and methods to transform strategic visions and achieve better outcomes.
Consumer Protection on Kickstarter
Daniel Blaseg,aChristian Schulze,bBernd Skierac,d
aDepartment of Strategy and General Management, Universitat Ramon Llull, ESADE, 08172 Sant Cugat-Barcelona, Spain; b
Frankfurt School of Finance & Management, 60322 Frankfurt am Main, Germany;cFaculty of Economics and Business, Goethe University Frankfurt, 60629 Frankfurt am Main, Germany;dDeakin University, Australia
Contact:[email protected], https://orcid.org/0000-0002-9218-3806(DB);[email protected], http://orcid.org/0000-0001-5731-4068(CS);[email protected], https://orcid.org/0000-0001-9285-2013(BS)
Received:September 23, 2018
Revised:June 6, 2019; September 27, 2019 Accepted:September 27, 2019
Published Online in Articles in Advance:
January 17, 2020
https://doi.org/10.1287/mksc.2019.1203 Copyright:© 2020 The Author(s)
Abstract. This article investigates consumer protection on Kickstarter—a popular and sizeable, yet largely unregulated reward-based crowdfunding platform. Specifically, the article focuses on Kickstarter campaigns’use of price advertising claims (PACs) and their failure to honor the promised discounts. Analyses show that between 2009 and 2016, more than 500,000 consumers who backed a wide variety of game or technology campaigns lost on average $45.72 because of broken PAC promises. Whereas 75% of PAC campaigns did not provide the promised discounts, in almost 50% of all cases backers who were promised a discount paid more, not less, than the retail price. In contrast, backers of campaigns that did not promise a discount received larger effective discounts. Analyzing an extensive data set comprising 34,745 Kickstarter campaigns, complete backing histories of more than 400,000 backers, and more than 4 million consumer comments, complaints, and reviews, we show that broken PAC promises pose a substantial problem to consumers, that the problem is persistent across more than 6 years, and that it has not been resolved through self-regulation by market participants thus far.
History:Avi Goldfarb served as the senior editor and Dina Mayzlin served as associate editor for this article. This paper has been accepted for theMarketing ScienceSpecial Issue on Consumer Protection.
Open Access Statement:This work is licensed under a Creative Commons Attribution 4.0 International License. You are free to copy, distribute, transmit and adapt this work, but you must attribute this work as“Marketing Science. Copyright © 2020 The Author(s).https://doi.org/10.1287/mksc.2019.1203, used under a Creative Commons Attribution License:https://creativecommons.org/licenses/by/4.0/.” Funding:D. Blaseg acknowledges the support of the Joachim Herz Stiftung and the E-Finance Lab
Frankfurt am Main e.V.
Supplemental Material:Datafiles and the e-companion are available athttps://doi.org/10.1287/mksc.2019.1203.
Keywords: kickstarter•crowdfunding•consumer protection•self-regulation
1. Introduction
I FEEL CHEATED and LIED to. They promised retail price no less than $9 after Kickstarter but you can buy them on their website for $5. I thought Kickstarters were getting a special deal.
—M. A., backer of the Brimstone campaign The project funded with KS backers being promised savings off retail of up to $1500. Yet they are actually selling them right now for $1000 LESS than Kickstarter backers paid 2 years ago!
—J. S., backer of the Scrooser campaign Reward-based crowdfunding is no longer a niche phenomenon. In the past decade, more than 75 mil-lion backers have pledged more than $10 bilmil-lion on Kickstarter, Indiegogo, and GoFundMe. Yet despite their reach, size, and age, crowdfunding platforms still resemble more of a “wild west” environment (Leamy 2018) than a maturing industry. The broad absence of regulation in such a sizeable market over a rather long period of time provides an interesting research setting for studying consumer protection.
In this article, we investigate consumer protection on Kickstarter, focusing specifically on price advertising claims (PACs). PACs are a form of advertising used in the sale of products whereby current prices are com-pared with a suggested reference price such as former prices, retail prices, or suggested prices by manufacturers (see Compeau and Grewal1998for a review and meta-analysis of the literature). Regulators such as the Federal Trade Commission (FTC) have promulgated specific guidelines to determine the conditions under which a PAC is deceptive and causes economic injury to consumers. For example, if a seller makes a PAC such as “Sold for $25 only today, 50% off the regular retail price,”regulation requires animmediateprice increase after the end of the promotion (for example, Code. Mass. Law, 940 C.M.R. §6.05), anactualprice increase to the stated amount (for example, FTC 16 C.F.R. Part 233), and
maintenance of the stated amount for a reasonable time (Better Business Bureau Code of Advertising §9.4).
On Kickstarter, a campaign might ask consumers to pay $70 to receive a product they promise will
later have a price of $140. The key question is as follows: “Do consumers actually get the price ad-vantage that was promised or do they incur economic injury because they did not?” In the example in Figure1, consumers on Amazon ended up paying a retail price of $59.99 upon product launch—57% less than what was promised ($140) and even 14% less than what consumers on Kickstarter actually paid ($70).
We focus this article on PACs because PAC regu-lation is widely applied in the United States and around the world (Boddewyn 1982) and because it remains a current topic. For example, broken PAC promises resulting in economic injury of only $36 for the plaintiff recently led courts to grant a class action lawsuit that ended up costing offline retailer J.C. Penney $50 million in a settlement (Spann v. J.C. Penney Corp.; see Stempel2015). Still, PAC regulation has not been enforced on Kickstarter thus far.
Anecdotal evidence regarding PACs—as in the introductory quotes by angry Kickstarter backers or in the example in Figure1—points toward potential problems. If the anecdotal evidence is indeed in-dicative of a systematic and unresolved consumer pro-tection problem, it might affect hundreds of thousands of consumers who could incur substantial economic injury from broken PAC promises.
To analyze consumer protection on Kickstarter systematically, we have compiled an extensive data set. We match the detailed data available on Kickstarter with information from various outside sources:
• Hand-collected prices from 1,548 webshops, as well as from Amazon, Steam, and price aggregators (e.g., camelcamelcamel and steamprices),
• Consumer reviews from Amazon and Steam, • Official consumer complaints as filed with the Federal Bureau of Investigation (FBI), the Federal Trade Commission (FTC), the Better Business Bureau (BBB), the Securities and Exchange Commission (SEC), and the Consumer Financial Protection Bureau (CFPB),
• Supplementary campaign data on nondelivery of rewards from Kickscammed and from news articles retrieved from CrunchBase,
• Survey data from 179 managers of successfully funded Kickstarter campaigns and 31 crowdfunding experts.
In total, we analyze 34,745 Kickstarter cam-paigns, complete backing histories of 442,185 backers, 4,279,494 consumer comments, 233,701 campaign up-dates, 1,704 blog articles from Kickstarter, 18,488 news articles from 500 publishers (e.g., TechCrunch, Wired), 94,569 consumer reviews, and 4,432 pages of consumer complaintsfiled with official authorities.
We use this data to investigatefive questions about consumer protection on Kickstarter: (1) Is there a substantial problem with broken PAC promises on Kickstarter? (2) Do consumers care? (3) Did con-sumers learn to avoid the problem? (4) Did campaign managers take actions that solved the problem? (5) Did Kickstarter take actions that solved the problem? Our analyses provide the following main results:
1. There is a substantial problem with broken PAC promises on Kickstarter. More than 75% of consumers who fund campaigns that use PACs (subsequently referred to as PAC campaigns) on Kickstarter do not receive the promised discounts. The problem is widespread and affects more than 500,000 individual backers. Products from PAC campaigns that are later offered to the public on average command a retail price on product launch that is $45.72 lower than promised by the Kickstarter campaign (the average promised price in these campaigns is $137.34). Even worse, in almost 50% of all cases the retail price is even lower than what backers paid on Kickstarter. Different from what PAC campaigns promise, their backers pay more, not less, than the retail price. All else equal, backers of cam-paigns that did not promise a discount (subse-quently referred to as NoPAC campaigns) on average
Figure 1. (Color online) Example for Use of PACs During Kickstarter Campaign and Lower than Promised Actual Retail Price at Product Launch on Amazon
received larger discounts than backers of PAC cam-paigns. In addition to not receiving the promised discount, consumers who funded campaigns that use (versus do not use) PACs also have a lower likelihood of ever receiving the product, experience longer de-livery delays, and receive products of lower objective quality.
2. Consumers care.All else equal, consumers who fund campaigns that use (versus do not use) PACs on Kickstarter are unhappier, as indicated by lower sentiment in backers’ comments on the Kickstarter platform, and have greater probability offiling con-sumer complaints with the FBI, FTC, BBB, SEC, or CFPB. Also, damaged consumers vote with their feet: consumers that did (versus did not) experience bro-ken PAC promises firsthand are significantly less likely to fund another campaign on Kickstarter.
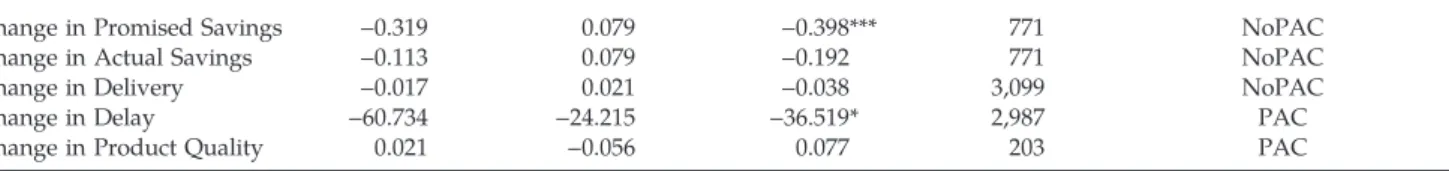
3. Consumers did not learn to avoid the problem.
We observe no PAC-specific population-level learn-ing: all else equal, campaigns that use (versus do not use) PACs on Kickstarter do not experience a relative decrease in funding likelihood over time. We also do not observe learning for (expert) subpopulations of Kickstarter backers: a surveyed group of crowd-funding experts does not expect PAC campaigns to perform worse regarding savings over the retail price, delivery likelihood, delivery delay, or prod-uct quality. Finally, we observe no individual-level learning: PAC campaign backers who experienced damage firsthand do not show a disproportionate decrease in funding likelihood for future PAC cam-paigns (versus Kickstarter camcam-paigns in general).
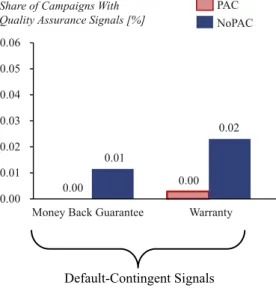
4. Campaign managers did not take actions that solved the problem.Only 13 of our 34,745 Kickstarter campaigns offer voluntary default-contingent signals in the form of money-back guarantees (4 campaigns, 0.01%) or warranties (9 campaigns, 0.03%); 21 cam-paigns (0.06%) provide default-independent signals such as external certifications via some seal of ap-proval. An industry-wide code of conduct has not been adopted. Hence, there is no discernable sign of self-regulation by campaign managers.
5. Kickstarter did not take measures that solved the problem.Among the seven major policy updates introduced by Kickstarter between the platform’s start in 2009 and the end of 2016,five policy updates protect Kickstarter (i.e., the platform), not the con-sumer. Among the two policy changes that could help improve consumer protection, the potentially most impactful change (introduction of a “risk and chal-lenges” section and prototype requirements for tech-nology products) was introduced in September 2012. The difference-in-difference-in-differences (DDD) anal-ysis reveals no positive effect of this change on damage from PAC (versus NoPAC) campaigns.
In summary, we find no evidence of consumer protection“happening automatically,”that is, with-out regulatory intervention, during the observed six-year period. Instead, the evidence points toward a substantial and persistent problem with broken PAC promises on Kickstarter.
Our study first and foremost contributes to the fast-growing stream of literature on reward-based crowdfunding (see Kuppuswamy and Bayus 2017a for a review) as thefirst to study consumer protection. We explicitly focus on the consequences (rather than the antecedents) of PAC usage, adding to the sparse crowdfunding literature that investigates phenom-ena after successful funding. Extant articles have mainly focused on phenomena before successful (or unsuc-cessful) funding of the campaign (e.g., Agrawal et al. 2015, Chan and Parhankangas 2017, Kuppuswamy and Bayus2017b, Younkin and Kuppuswamy2017). Only three articles look at what happens after cam-paign funding. Mollick (2014) examines delays in delivery, Roma et al. (2017) investigate how crowd-funding performance attracts professional investors, and Viotto da Cruz (2018) researches crowdfund-ing as an informational mechanism by linkcrowdfund-ing prod-ucts’ crowd feedback to the probability of market releases. In addition, our research highlights the on-going relevance of PAC regulation (Pechmann and Silk 2013) and speaks more broadly to the widely debated topic of consumer protection in unregulated markets and platform economies (Lagarde 2017, Ohlhausen2015).
In the remainder of the article, we detail the setting and available data for our empirical study and discuss the variables of interest. We then detail our identifi -cation strategy. Next, we present analyses, model-free evidence and results along the five questions outlined above, investigating whether there is a sub-stantial problem and whether it matters to consumers, whether consumers learn to avoid the problem, and whether the problem is mitigated by self-regulation by either campaign managers or the Kickstarter platform. We analyze the economic relevance of ourfindings and conclude with a summary, discussion of implications, and limitations.
2. Data in the Empirical Study
2.1. Data from Kickstarter and Related Websites
Consumers learn about Kickstarter campaigns via campaign websites that follow a standard format. Campaigns can describe their offerings using text, images, and videos. They specify the price of the“one standard product, unlimited availability”reward and potential other rewards, and inform consumers about the delivery date, shipping options, the identity and experience of the campaign manager, and potential campaign risks. Finally, campaigns must specify their
campaign goal and a campaign end date. If the cam-paign reaches or surpasses that goal (i.e., the camcam-paign is funded) by the specified date, it receives backers’ money and is obliged to deliver the reward. If the campaign does not reach the goal, then Kickstarter will not charge consumers’ credit cards. All of this information, as provided by the campaign manager, is publicly available at the start of the campaign and is part of our data.
In our study, we specifically compare Kickstarter campaigns that use versus do not use PACs. To identify the use of PACs, we employ a rule-based text mining approach on reward descriptions—a popular approach to identifying patterns commonly observed in texts (Netzer et al.2012). In line with Grewal and Compeau (1992), we identify two main types: (1) PACs indicating direct potential savings (e.g.,“$10 less than retail price” or “20% off retail”) and (2) PACs con-taining a reference price (e.g., “Retail price will be $100”). Based on this information, we determine the promised price in U.S. dollars. Although other rewards might exist (for example, receiving a special or limited-edition version of the product, early bird rewards, nontangible philanthropic rewards, or multiple prod-ucts in a multibuy deal), we focus on the price of the most relevant“one standard product, unlimited availability” reward—the only reward type that is available in all campaigns and to all consumers at any time throughout the funding period, thus enabling us to compare all campaigns.
Beyond providing information about the campaign, crowdfunding websites offer a means for backers and the campaign manager to interact. The campaign manager can inform backers with updates about the current status and progress. These comments and updates are public and also part of our data.
Funded campaigns are obliged to deliver the product to backers. However, not all campaigns succeed in their endeavor and either entirely fail to deliver or deliver the product late. Information on (non)de-livery is partially available on the Kickstarter plat-form (e.g., in the comments posted by backers and in the updates by campaign managers). We augment the information on Kickstarter through specialized third-party platforms Kickscammed and CrunchBase to assess the delivery status of funded campaigns. Matching of information from third-party websites and Kickstarter is done using campaign names. Based on this procedure, each campaign is categorized as “delivered” (i.e., de-livery has been confirmed),“not delivered”(i.e., failure has been announced), or“not delivered yet”(i.e., no confirmed delivery and no announced failure).
2.2. Data from Amazon and Steam
After successfully funded Kickstarter campaigns de-liver the rewards to their backers, they often seek to
increase their market and sell to a broader set of con-sumers (Mollick and Kuppuswamy 2014, Viotto da Cruz 2018). The most relevant retail platforms are Steam for games and Amazon for technology prod-ucts. We identified 361 campaigns that moved on to sell their products on these platforms. We use Steam and Amazon to gather information about consumer reviews of these products. Specifically, we use the Amazon star ratings and the Steam thumbs up/ thumbs down ratings as indicators of product qual-ity. Moreover, we gather retail prices from Amazon and Steam directly, as well as from the websites Steamprices and camelcamelcamel for historical retail prices at launch.
2.3. Data from Other Webshops
Although Amazon and Steam are the most relevant retail platforms for selling Kickstarter games and technology products, many campaigns decide to sell through other, more specialized webshops. To gather pricing data from these pages, we trained four human coders to assess all links provided by campaign managers after the funding period in the campaign’s header section to manually gather actual and, if available, historical product prices for the exact prod-uct sold in the Kickstarter campaign. In total, we identified 1,548 campaigns that sold their products on webshops other than Amazon and Steam. Each cam-paign was assessed by two independent coders. A Krippendorf’s Alpha of 0.819 indicates an acceptable level of intercoder reliability. In case of disagree-ments, afinal decision was made by a third coder.
2.4. Data from Consumer Protection Entities (FBI, FTC, BBB, SEC, CFPB)
For information about official complaints filed by backers of Kickstarter campaigns, we gathered data (requested directly or under the Freedom of Infor-mation Act) from the four most relevant consumer protection entities in the United States: the FTC, the BBB, the SEC, and the CFPB. In addition, we re-quested data from the FBI’s Internet Crime Complaint Center for information on fraud related to Kickstarter. We received 4,432 pages of information, which we manually matched with Kickstarter campaign data using the names of campaigns and their campaign managers. Matching revealed that official complaints for 142 of 11,948 successfully financed campaigns (1.19%) werefiled with FBI, FTC, BBB, SEC, or CFPB.
2.5. Data from Campaign Managers and Crowdfunding Experts
We conducted an online survey among 179 managers of successfully funded Kickstarter campaigns, which provided insight into campaign managers’ motiva-tions for (not) offering PACs, into the effects of PACs
on campaign operations, and into otherwise unob-servable campaign characteristics. Moreover, we surveyed 31 crowdfunding experts (academics and practitioners) via structured, face-to-face interviews about their expectations for PAC versus NoPAC campaigns regarding savings, delivery, delay, and product quality.
3. Measures of Interest and Their Links to
Price Advertising Claims (PACs)
3.1. Link Between PACs and Promised Savings and Actual Savings
The focal measure of interest when investigating consumer protection related to PACs is Promised Savings. Current regulation clearly states that not receiving (part of) the promised discount is consid-ered an economic injury to consumers (for example,
Hinojos v. Kohl’s Corp., No. 11-55793). Throughout this article, our use of the term economic injury strictly refers to this well-established legal interpretation. In line with this interpretation, we define Promised Savings = Retail Price / Promised Price–1, measuring the percentage difference between the retail price (found on Amazon, Steam, or other webshops) and the retail price promised to consumers by the Kickstarter campaign. If the promised price was $140, but the retail price turned out to be $59.99, then Promised Savings = $59.99/$140–1 =–0.57. If Promised Sav-ings takes on a negative value, the consumer did not receive the promised discount and incurred eco-nomic injury in the legal sense—we thus consider the PAC promise broken. If Promised Savings≥0, then the Kickstarter campaign kept its PAC promise and brought the product to market at the announced retail price. By definition, NoPAC campaigns do not an-nounce a retail price. We thus use the price paid on Kickstarter instead of the promised price to calculate Promised Savings for these campaigns.
In addition, we employ a second, more conserva-tive measure for savings. We defineActual Savings = Retail Price / Kickstarter Price–1. Whereas Promised Savings lets us see whether backers of PAC cam-paigns on Kickstarter saved thepromisedamount, Ac-tual Savings reveals whether backers on Kickstarter saved any amount at all. If Retail Price is $59.99 and Kickstarter Price is $70, then Actual Savings = $59.99 / $70–1 =–0.14. The negative value means that backers did not realize any savings over the retail price by buying on Kickstarter.
3.2. Link Between PACs and Delivery, Delay, Product Quality
Beyond Promised Savings and Actual Savings, we investigate three additional metrics commonly dis-cussed as campaign outcomes in the crowdfunding
literature (Belleflamme et al. 2014, Mollick 2014): Delivery (whether the campaign delivers a product), Delay (time difference between the announced and the actual date of delivery for the product), and Product Quality (consumer ratings for the product). We do not have causal evidence of a link between PAC usage and Delivery, Delay, or Product Quality. We analyze the three metrics because of the suggestive evidence presented below and leave it to future re-search to investigate the causality of this link further. It is a well-established notion in the entrepre-neurship literature that financial cushions improve new venture performance, because greater cushions allow ventures to absorb small mistakes and un-expected costs more easily (Katz and Gartner1988, Chrisman et al.1998). On Kickstarter, PAC campaigns likely have smaller financial cushions than their NoPAC counterparts do. If a campaign decides to include a PAC, the discount it provides to backers reduces the gross margin and thus the financial cushion of the PAC campaign vis- `a-vis an otherwise identical NoPAC campaign that does not offer a discount.
For Kickstarter-specific insights on this topic, we sur-veyed 179 Kickstarter campaign managers.1Many (free-form) comments by campaign managers support the notion that PAC campaigns in particular lack a financial cushion. Campaign managers pinpointed three specific consequences. First, campaigns might fail to deliver anything because they cannot af-ford to complete production. The managers stated, “Discounts reduce the contribution margin,” “Costs turned out to be higher,” and in consequence the “Discounted price does not cover production costs.” If campaigns lack a financial cushion, they could fail to deliver the product altogether. Second, if campaigns do deliver, they might take longer be-cause managers needed to identify ways to save costs: “Switching to overseas production”and“We had to switch suppliers in order to avoid a massive loss” are common comments that link a lack of financial cushion to delays. Finally, reduced margins might force campaigns to compromise on quality. “You can’t produce high quality at low costs,”one manager stated. One openly admitted, “We had to cut cor-ners”; other managers reported using lower-quality materials or cheaper, lower-quality partners for production.
Suggestive evidence in the entrepreneurship liter-ature and from interviews with Kickstarter campaign managers about a potential effect of PAC usage on Delivery, Delay, and Product Quality lead us to include these measures in our empirical study on consumer protection. Still, we focus on Promised Savings as our focal measure.
3.3. Terminology: Damage and Economic Injury
In the empirical analyses, we compare PAC and NoPAC campaigns on Kickstarter. The comparison of PAC versus NoPAC campaigns does not allow us to make statements about the absolute utility backers derive from supporting Kickstarter campaigns vis-`a-vis outside options, such as preorders on Amazon or nonpurchase. It does, however, allow us to com-pare the relative benefit backers of (unregulated) PAC campaigns derived vis- `a-vis Kickstarter backers of NoPAC campaigns. Throughout this article, we use the term damage to describe relative differences in Promised Savings and Actual Savings, Delivery, Delay, and Product Quality between PAC and NoPAC cam-paigns. Whenever we subsequently report damage experienced by PAC backers, we thus refer torelative
damage in comparison with NoPAC backers. In contrast,economic injurycaptures not relative but absolute injury as defined by regulators and enforced by courts. We strictly use the term in its legal sense with Economic Injury = Promised Price – Retail Price
(Hinojos v. Kohl’s Corporation, No. 11-55793).
4. Identi
fi
cation
The assignment of campaigns to the PAC versus NoPAC conditions is not random. As campaign man-agers make the decision to (not) use PACs before
the start of the campaign, we expect that the as-signment of PAC versus NoPAC systematically re-lates toprecampaign characteristics. To help identify the effect of PACs in our study, we therefore employ propensity score matching (PSM) based on observ-able precampaign characteristics. This technique has been widely used in marketing (Gensler et al.2012) to control for potential endogeneity resulting from the nonrandom assignment of treatments. Propensity scores are calculated as the predicted probability that a campaign uses PACs given its observable and statistically significant precampaign characteristics (Rosenbaum and Rubin1984).
The key question in using PSM for identification is whether matching on observables captures all rele-vant factors or whether potentially unobservable fac-tors would alter the results. We will discuss both questions below.
4.1. Observed Precampaign Characteristics
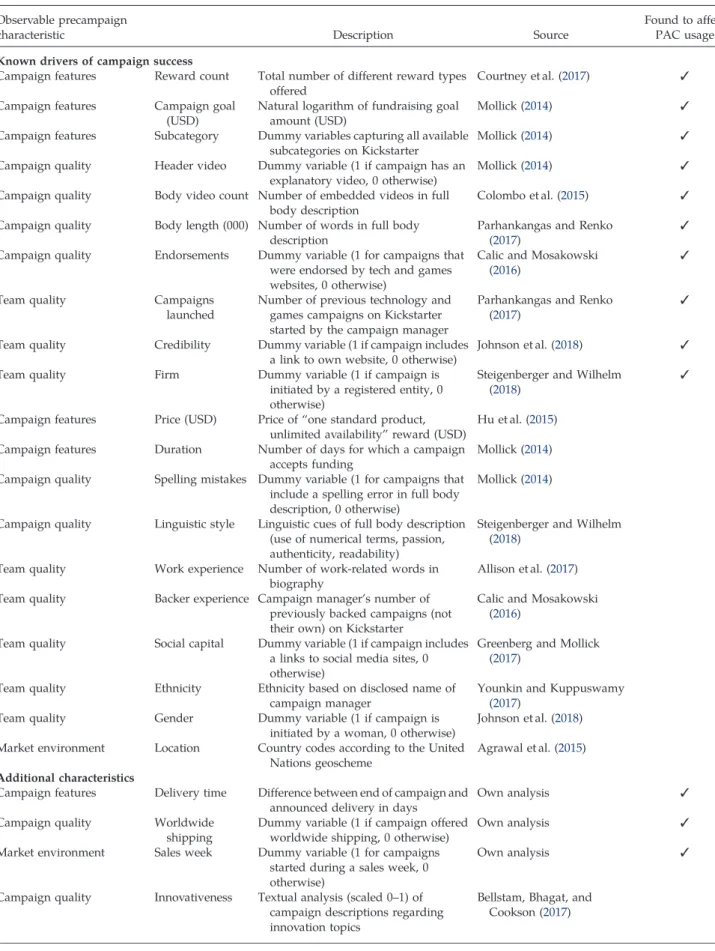
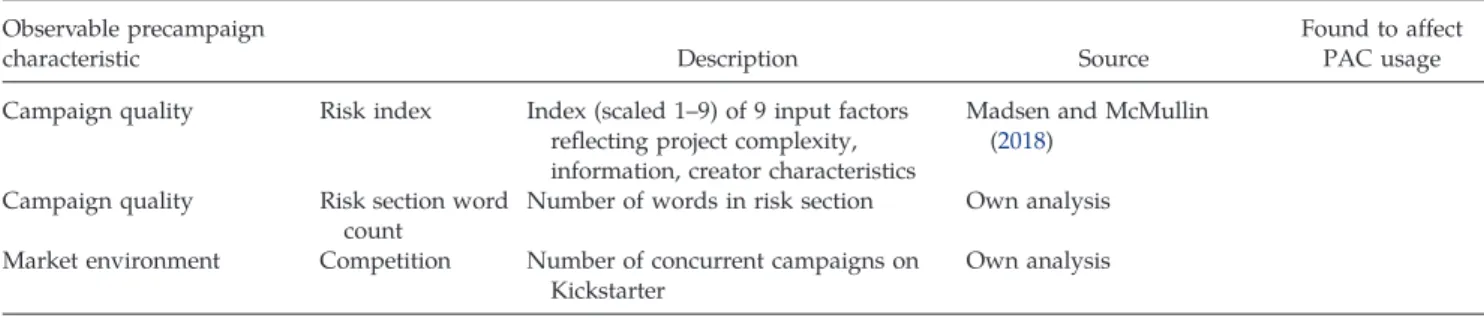
In matching PAC and NoPAC campaigns, we con-sider 20 known drivers of campaigns’funding success derived from the extant literature. These 20 drivers contain all known precampaign characteristics that have been confirmed to affect campaign success on Kickstarter in three or more published studies. Com-bined, they capture differences in campaign features, campaign quality, team quality, and campaigns’ mar-ket environment on launch. For our analyses, we test
whether these known drivers of campaign success also affect PAC usage. As shown in Table1, only 10 of these drivers do, and we subsequently include them in our analyses.
In addition to the 20 known drivers in the literature, we tested another 7 potential drivers, 3 of which in-deed affect PAC usage. For example, we observe that if a campaign is started around a major holiday or sales event (where campaign managers encounter more PACs in the environment), the campaign is more likely to use PACs. In contrast, competition at campaign launch, campaign risk, or innovativeness do not affect PAC usage. We summarize all 27 pre-campaign characteristics in Table 1 and use all sig-nificant drivers of PAC usage in the analyses going forward.
4.2. Unobserved Precampaign Characteristics
The list of 27 potential drivers of PAC usage covers campaign features (e.g., campaign goal, subcategory), campaign quality (e.g., header and body videos, en-dorsements, innovativeness), team quality (e.g., cam-paigns launched, credibility, incorporated firm) and market environment (e.g., location, competition, sales week). Still, other unobservable confounds might exist that could bias our results. Most prominently, these might relate to expected product quality, team quality (self-assessed team quality, ability to deliver, deliver on time), and financing characteristics (availability of alternative funding options, likelihood to reach funding goal). To address these points and better understand the data-generating process, we conduct-ed a survey of 179 managers of successfully fundconduct-ed Kickstarter campaigns. Of these, 93 used PACs in their campaign and 86 did not.
As detailed in Table 2, we asked campaign man-agers about product and team quality, as well as financing characteristics to uncover potential unob-served differences between PAC and NoPAC cam-paigns. Survey results provided no indication that PAC and NoPAC campaigns differ significantly along these dimensions in the prelaunch phase. To minimize adverse effects from potential social de-sirability bias, we designed the survey so that cam-paign managers were unaware about the study’s focus on PACs when they answered the questions in Table2.
Moreover, we asked campaign managers about their decision to (not) use PACs in a free-form question. Of these managers, 45% (40 PAC managers and 41 NoPAC managers) did not provide any reason, and another 23% (23 PAC managers and 18 NoPAC managers) considered their choice for or against PACs as the norm (“Common practice on Kickstar-ter,” or “It’s not permitted by Kickstarter”). Only about one-third of all surveyed campaign managers
Table 1. 27 Observable Precampaign Characteristics Tested to Affect Usage of Price Advertising Claims in Kickstarter Campaigns in a Logistic Regression
Observable precampaign
characteristic Description Source
Found to affect PAC usage Known drivers of campaign success
Campaign features Reward count Total number of different reward types offered
Courtney et al. (2017) 3 Campaign features Campaign goal
(USD)
Natural logarithm of fundraising goal amount (USD)
Mollick (2014) 3
Campaign features Subcategory Dummy variables capturing all available subcategories on Kickstarter
Mollick (2014) 3
Campaign quality Header video Dummy variable (1 if campaign has an explanatory video, 0 otherwise)
Mollick (2014) 3
Campaign quality Body video count Number of embedded videos in full body description
Colombo et al. (2015) 3 Campaign quality Body length (000) Number of words in full body
description
Parhankangas and Renko (2017)
3 Campaign quality Endorsements Dummy variable (1 for campaigns that
were endorsed by tech and games websites, 0 otherwise)
Calic and Mosakowski (2016)
3 Team quality Campaigns
launched
Number of previous technology and games campaigns on Kickstarter started by the campaign manager
Parhankangas and Renko (2017)
3 Team quality Credibility Dummy variable (1 if campaign includes
a link to own website, 0 otherwise)
Johnson et al. (2018) 3 Team quality Firm Dummy variable (1 if campaign is
initiated by a registered entity, 0 otherwise)
Steigenberger and Wilhelm (2018)
3 Campaign features Price (USD) Price of“one standard product,
unlimited availability”reward (USD)
Hu et al. (2015) Campaign features Duration Number of days for which a campaign
accepts funding
Mollick (2014) Campaign quality Spelling mistakes Dummy variable (1 for campaigns that
include a spelling error in full body description, 0 otherwise)
Mollick (2014)
Campaign quality Linguistic style Linguistic cues of full body description (use of numerical terms, passion, authenticity, readability)
Steigenberger and Wilhelm (2018)
Team quality Work experience Number of work-related words in biography
Allison et al. (2017) Team quality Backer experience Campaign manager’s number of
previously backed campaigns (not their own) on Kickstarter
Calic and Mosakowski (2016)
Team quality Social capital Dummy variable (1 if campaign includes a links to social media sites, 0 otherwise)
Greenberg and Mollick (2017)
Team quality Ethnicity Ethnicity based on disclosed name of campaign manager
Younkin and Kuppuswamy (2017)
Team quality Gender Dummy variable (1 if campaign is initiated by a woman, 0 otherwise)
Johnson et al. (2018) Market environment Location Country codes according to the United
Nations geoscheme
Agrawal et al. (2015) Additional characteristics
Campaign features Delivery time Difference between end of campaign and announced delivery in days
Own analysis 3
Campaign quality Worldwide shipping
Dummy variable (1 if campaign offered worldwide shipping, 0 otherwise)
Own analysis 3
Market environment Sales week Dummy variable (1 for campaigns started during a sales week, 0 otherwise)
Own analysis 3
Campaign quality Innovativeness Textual analysis (scaled 0–1) of campaign descriptions regarding innovation topics
Bellstam, Bhagat, and Cookson (2017)
noted that their choice for or against PAC usage was a deliberate decision. Nineteen percent (19 PAC man-agers and 15 NoPAC manman-agers) stated that con-siderations of demand and profitability drove their decision (“To attract more backers,” but also “Kickstarter is for early adopters. They are not price sensitive”). The remaining 13% (11 PAC managers and 12 NoPAC managers) provided other reasons, such as concerns about complexity. None of the an-swers pointed toward additional relevant drivers that are not included in our analyses already.
4.3. Potential Bias from Omitted Variables
The list of observed, considered precampaign char-acteristics is extensive, and differences between PAC and NoPAC campaigns along these dimensions are small and nonsystematic. In particular, we do not see any indication that PAC campaigns are systemati-cally inferior to NoPAC campaigns, which could support the idea of “PAC usage as a last resort.” Moreover, the existence of major differences in un-observed product quality, team quality, orfinancing characteristics is unlikely, given the answers of 179 campaign managers. Campaign managers’free-form answers also did not point toward additional relevant drivers. Still, it is possible that we do not completely address self-selection and that omitted variables bias our results. We thus investigate the robustness of our
results to potential omitted variable bias following three slightly different approaches by Altonji et al. (2005), Gonz ´alez and Miguel (2015), and Oster (2019). Oster’s (2019) approach to assess potential omitted variable bias is in essence an extension of the pro-cedure of Altonji et al. (2005) to consider (a) the var-iation of the estimated coefficient of interest (e.g., PAC campaign) through the inclusion of additional covariates, as well as (b) the associated shift inR2to assess how sensitive results are to potentially omitted variables (see Oster (2019) for details and a formal derivation). The key assumption of the approach is that the selection on observable variables is infor-mative about the selection on unobservable ones.
Following this approach, we calculate an estimate of the bias-adjusted treatment effect of using PACs on our main dependent variable of interest, Promised Savings (as detailed in Section 3.1). In Table 3, we report the coefficient for PAC campaign β without any controls (column (1)) and with all precampaign characteristics as control variables (column (2)).2In column (3), we report an identified set of parameters on the treatment effect, bounded on one side by the controlled treatment effectβ˜and on the other by the bias-adjusted effectβ*withδ= 1 andR
max1.3R˜, as proposed by Oster (2019). The identified set excludes zero and the bounds of the identified set are within the confidence interval of β˜, suggesting that the results
Table 1. (Continued)
Observable precampaign
characteristic Description Source
Found to affect PAC usage Campaign quality Risk index Index (scaled 1–9) of 9 input factors
reflecting project complexity, information, creator characteristics
Madsen and McMullin (2018)
Campaign quality Risk section word count
Number of words in risk section Own analysis Market environment Competition Number of concurrent campaigns on
Kickstarter
Own analysis
Table 2. Results of Survey of 179 Kickstarter Campaign Managers Regarding Their Assessment of Own Campaign’s Product
Quality, Team Quality, and Financing Options Before Campaign Start
Unobservable precampaign characteristic PAC (n= 93) NoPAC (n= 86) Difference Scale Product quality
Expected quality of main product before campaign start 5.39 5.31 −0.07n.s. 1 (very low) to 7 (very high) Team quality
Self-assessed quality of team behind campaign 5.47 5.34 −0.14n.s. 1 (very weak) to 7 (very strong) Confidence in delivering main product to backers 5.05 5.01 −0.04n.s. 1 (not confident) to 7 (very confident) Confidence in keeping promised delivery date (rather
than deliver late)
3.75 3.81 0.06n.s. 1 (not confident) to 7 (very confident) Financing
Confidence in reaching funding goal 5.25 5.38 0.14n.s. 1 (not confident) to 7 (very confident) Confidence in obtaining funding from other sources
in case of not reaching funding goal
4.01 4.31 0.30n.s. 1 (not confident) to 7 (very confident) n.s.p≥0.10; *p<0.10; **p<0.05; ***p<0.01.
from our controlled regressions are robust to omitted variable bias.
The calculation ofβ*is very sensitive to reasonable choices of the maximum R2. We thus assess the ro-bustness of our analysis using a more conservative value ofRmax 0.5 (Gonz ´alez and Miguel2015). The identified set in column (4) again excludes zero.
Finally, we calculate the ratioδ(i.e., the degree of proportionality) of the impact of unobserved vari-ables relative to the observed explanatory varivari-ables. The degree of proportionalityδindicates how much stronger selection on unobservables (versus selection on observables) has to be for the coefficient of PAC campaignβto equal 0 (Altonji et al.2005). The value of the δ ratio (column (5)) is well in line with values considered robust in the literature (Manchanda et al. 2015, Krauth2016) and indicates that any unobserved campaign characteristics would need to be 2.442 times as relevant as all the observed characteristics combinedto nullify our results (Altonji et al.2005). In summary, results from all three analyses consistently suggest that ourfindings are unlikely to be driven by omitted variables.
4.4. Propensity Score Matching (PSM) Procedure
In the subsequent PSM analyses, we apply nearest neighbor matching with caliper, which is preferred when analyzing large samples of untreated obser-vations (NoPAC) relative to the treated group (PAC) (Caliendo and Kopeinig2008). The method matches each PAC campaign with the NoPAC campaign that has the closest propensity score (Rosenbaum and Rubin 1984). The use of caliper width increases the quality of matching by ensuring that matching occurs only when the absolute difference between the pro-pensity scores of two potentially matched campaigns is reasonably small and less than a predefined caliper distance (ε). In line with the literature, we define the caliper distance as the proportion of the standard deviation of the propensity score (σP), calculated as
ε0.25σP(Guo and Fraser2014). Results are stable to the use of kernel matching as an alternative technique. Although campaigns show significant differences in precampaign characteristics before use of the PSM procedure, the Hotelling test of equal vector means reveals no significant differences between PAC and NoPAC groups after PSM, indicating successful match-ing (Cao and Sorescu 2013). We provide details on PSM and Hotelling test results in the online appendix.
5. Results of the Empirical Study
To investigate whether consumer protection “ hap-pened automatically”in the observed six-year period during which PAC regulation was not applied to Kickstarter or whether there is a substantial, persistent, and unresolved problem with broken PAC promises on Kickstarter, we investigatefive questions: (1) Is there a substantial problem with broken PAC promises on Kickstarter? (2) Do consumers care? (3) Did con-sumers learn to avoid the problem? (4) Did campaign managers take measures that solved the problem? (5) Did Kickstarter take measures that solved the problem? We subsequently present our analyses, model-free evidence, and results regarding each question.
5.1. Is There a Substantial Problem with Broken PAC Promises on Kickstarter?
5.1.1. Analyses. Our analyses of potentially broken PAC promises focus on Promised Savings as the key measure, which allows us to reliably quantify eco-nomic injury. This measure is aligned with current regulation, by which not receiving the full prom-ised discount is considered an injury to consumers (Hinojos v. Kohl’s Corporation, No. 11-55793). In addi-tion, we report Actual Savings as a second, more conservative measure for savings. Both Promised Savings and Actual Savings directly link to PACs (see Section3.1for details).
In addition, we report Delivery, Delay, and Product Quality. As noted in Section3.2, all three measures are potential indirect sources of damage to backers
Table 3. Assessment of Potential Omitted Variable Bias Following Oster (2019), Gonz´ales and Miguel (2015), and Altonji, Elder, and Taber (2005)
(1) (2) (3) (4) (5) Baseline effect ˙ β, (SE), [R˙] Controlled effect ˜ β, (SE), [R˜] Identified set [β,˜ β*′(min{1.3R˜, 1}, 1)] Identified set [Rmax= 0.5] δforβ= 0 PAC campaign −0.374*** −0.396*** [–0.436,–0.396] [–1.771,–0.396] 2.442 (0.023) [0.123] (0.025) [0.161] Robust toward omitted variable bias
3 3 3
Reference Oster (2019) Gonz´ales and Miguel
(2015)
Altonji, Elder, and Taber (2005) *p<0.10; **p<0.05; ***p<0.01.
that are commonly discussed in the crowdfunding literature (Belleflamme et al.2014, Mollick2014). We defineDelivery =1 if product has been delivered and 0 otherwise. Among both PAC and NoPAC campaigns, failure to deliver a product is not unusual. We are, however, interested in whether the likelihood of delivery is lower for PAC campaigns versus NoPAC campaigns. To identify whether a campaign delivered (labeled as known positive) or has announced failure to de-liver (known negative), we use text mining on three sources: (1) campaign updates posted on Kickstarter, (2) information from Kickscammed, a public web-site where users can report crowdfunding cam-paigns they consider to be scams, and (3) articles on CrunchBase, which provides 18,488 news articles relating to Kickstarter from websites such as Tech-Crunch, Wired, CNet and Gizmodo. We match in-formation from Kickscammed and CrunchBase to the respective campaigns using the campaign names.
For the classification, we seek to extract information about whether the campaign has started to ship the promised rewards (e.g., “Shipped,” or “Delivery started”) or has announced failure (e.g.,“We failed,” or“We stopped work”). If information on successful delivery is available, we define this campaign as delivered (Delivery = 1). To circumvent false an-nouncements, we also require at least one backer to confirm the receipt of the product in the comments. If information on failure is available, we define these campaigns as not delivered (Delivery = 0). If a cam-paign has not confirmed delivery and has not an-nounced failure to deliver, we classify the campaign as not delivered yet.
Further, we operationalize Delay = min(Actual De-livery Date – Announced Delivery Date; 0), where de-livery delays are measured in days, and early and punctual deliveries are coded as 0. We calculate the delay as the difference between the announced de-livery date and the actual date of the shipping an-nouncement (only for campaigns with Delivery= 1). As campaign managers announce shipping dates in a month-year format, we calculate delay based on the last day of the month and regard shipping within the announced month as on time (i.e.,Delay= 0).
We base our measure of Product Quality on re-views from consumers outside the Kickstarter plat-form. Amazon enables consumers to submit reviews in text form and ratings of products in the form of numerical star ratings (ranging from one tofive stars), whereas Steam allows users to submit text reviews and a thumbs-up or thumbs-down recommendation. Average ratings for a product are the average of the number of stars on Amazon and the share of positive recommendations on Steam. We make the rating systems comparable by rescaling the Amazon ratings to a percentage value (=(Average Star Rating–1)/4). We then compare the ratings from PAC and NoPAC campaigns.3
The number of observations naturally differs among thesefive metrics (Figure 2). We are able to observe Promised Savings and Actual Savings for a total of 1,9094campaigns (390 PAC campaigns, 20.43%). We observe Product Quality for a total of 361 campaigns (78 PAC campaigns, 21.61%), where the product is sold on either Amazon or Steam on successful completion of the Kickstarter campaign. We observe
Figure 2. Overview of Number of Available Observations for Analyses of Savings, Delivery, Delay, Product Quality, Complaints, and Sentiment (in Bold Boxes)
Delivery for 8,673 campaigns, which either delivered (8,385 campaigns, 96.68%) or officially failed to do so (288 campaigns, 3.32%).5 We observe Delay for all 8,385 campaigns that delivered.
The following analyses compare PAC campaigns against NoPAC campaigns, rather than against an ideal benchmark. The reason is that Kickstarter backers cannot expect the same experience as buyers in an online store. For example, Mollick (2014) has shown that backers should expect delivery delays when funding campaigns on Kickstarter. Because comparing PAC campaigns’ Delay against an ideal benchmark ofDelay= 0 would be misleading, we use comparable Kickstarter campaigns that do not use PACs (NoPAC) as a more conservative benchmark.
5.1.2. Model-Free Evidence. Model-free evidence on Promised Savings and Actual Savings (Figure3) re-veals that PAC campaigns not only fail to deliver the promised discount in 75.9% of all cases (blue bars to the left of the dotted line, left histogram); in 47.2% of all cases, they even fail to deliver any savings at all. In comparison, NoPAC campaigns (which by defi ni-tion do not promise a discount) provide a significantly larger de facto discount to backers on Kickstarter, who pay lower prices than online retail consumers (see Table4).
In Table 4, we report model-free evidence for all five measures as they differ between NoPAC and PAC campaigns. We observe a significant differ-ence between PAC and NoPAC campaigns across all measures. Promised Savings and Actual Sav-ings are lower, Delivery likelihood is lower, Delay is longer, and Product Quality is lower for PAC (versus NoPAC) campaigns.
5.1.3. Results. After successful application of PSM (see the online appendix for details), we compare PAC and NoPAC campaigns via a simple t-test for Promised Savings and Actual Savings, Delay, and Product Quality, as well as viaχ2-test for Delivery. Results for all five measures in this causal analysis confirm the model-free evidence: PAC campaigns have lower savings (promised and actual), lower likelihood of ever delivering the product, and longer delays and lower product quality in case of delivery compared with their NoPAC counterparts (Table5). The size of the effects is comparable to the model-free evidence.
5.2. Do Consumers Care?
5.2.1. Analyses. Crowdfunding research typically as-sumes that backers are maximizing their personal (financial) surplus (Hu et al.2015) and are motivated to support campaigns on Kickstarter because of at-tractive (and atat-tractively priced) rewards (Cholakova and Clarysse 2015). However, backers might also engage in crowdfunding because the process itself provides them with additional utility (e.g., bring-ing the product to life) over buybring-ing via traditional retail (Kuppuswamy and Bayus 2017b, Bitterl and Schreier2018).
If backers gain a lot of utility from bringing the product to life, then the objectively measurable dam-age they incur from PAC (versus NoPAC) campaigns shown in Section 5.1 might not be relevant to them. To establish whether consumers care, we analyze whether backers, in particular PAC backers, react negatively when experiencing damage regarding Promised Savings and Actual Savings, Delivery, Delay, and Product Qualityfirsthand. To this end, we
Figure 3. (Color online) Distribution of Promised and Actual Savings for Campaigns Using Price Advertising Claims (PACs)
compare PAC backers that differ regarding the out-come of theirfirst PAC campaign.6For the analysis of Promised Savings, for example, we compare backers whose first PAC campaign honored the promised price (no damage) against backers whose first PAC campaign did not and sold the product for less than the promised price at online retailers (damage). If backers care about thefive metrics we analyze, then experiencing damage firsthand in any of these di-mensions should result in a drop in funding likeli-hood for future Kickstarter campaigns compared with backers that experienced no damage in that dimension. Our composition of the no-damage con-trol group is conservative, as backers in that group may have experienced other damages that reduce their likelihood to invest in another Kickstarter cam-paign in the future.
We base our analyses in this section on the com-plete backing histories of 442,185 backers—a sizeable subset7 of all backers in Kickstarter’s games and technology categories—and employ PSM tofind com-parable backers8 that did versus did not experi-ence damage along each of thefive measures on their first PAC campaign.
Moreover, we investigate whether the damage ex-perienced by backers of PAC campaigns (with backers of NoPAC campaigns as a reference group) is out-weighed by countervailing benefits to these backers. If backers experience (unobserved) additional bene-fits from supporting campaigns using PACs that are not prevalent in NoPAC campaigns and that outweigh the damage experienced by PAC backers
that we documented previously, we should observe that backers’ sentiment for PAC campaigns is more positive than or identical to backers’ sentiment for NoPAC campaigns. Also, we should expect a lower or identical likelihood of official complaints for PAC versus NoPAC campaigns.
We analyze backer sentiment through backers’ comments posted on the campaign website after the end of the funding period. Of 11,948 successfullyfi -nanced campaigns, 10,818 campaigns (90.54%) re-ceived at least one comment. The average number of comments per campaign is 396. We automatically analyzed these comments using Linguistic Inquiry and Word Count (LIWC). Using word counts for a given text, LIWC calculates the proportion of words that match predefined dictionaries for different types, such as positive and negative words. As one of the most popular tools used in social science research to measure emotional expression, the LIWC approach has been applied to a broad range of text cate-gories, including crowdfunding campaign descrip-tions (Younkin and Kuppuswamy 2017). We base our analysis on the LIWC standardized summary variable of emotional tone, which combines positive and negative sentiment in a single variable scaled from 0 to 1, such that numbers greater than 0.5 suggest a predominantly positive sentiment. We then com-pare the average sentiment from PAC and NoPAC campaigns.9
We further defineComplaint= 1 if a campaign has received officialfiling of a consumer complaint (with either FBI, FTC, BBB, SEC, or CFPB) and 0 otherwise.
Table 5. Results ofT- andχ2-Tests Analyzing Differences in Damage to Backers Between Campaigns Using Price Advertising Claims (PAC) vs. Campaigns Not Using Price Advertising Claims (NoPAC) after Successful Propensity Score Matching
After PSM PAC campaigns NoPAC campaigns Difference in means Observations
Campaigns with less beneficial outcome for consumers
Promised Savings −0.205 0.176 −0.381*** 754 PAC
Actual Savings 0.048 0.176 −0.127*** 754 PAC
Delivery 0.947 0.972 −0.025*** 2,850 PAC
Delay 99.846 84.330 15.516*** 2,702 PAC
Product Quality 0.735 0.802 −0.067** 132 PAC
*p<0.10; **p<0.05; ***p<0.01.
Table 4. Model-Free Evidence on Damage to Backers of Campaigns Using Price Advertising Claims (PAC) vs. Campaigns Not Using Price Advertising Claims (NoPAC)
Model-free PAC campaigns NoPAC campaigns Difference in means Observations
Campaigns with less beneficial outcome for consumers
Promised Savings −0.207 0.168 −0.374*** 1,909 PAC
Actual Savings 0.049 0.168 −0.119*** 1,909 PAC
Delivery 0.948 0.971 −0.023*** 8,673 PAC
Delay 99.227 83.076 16.151*** 8,385 PAC
Product Quality 0.709 0.806 −0.097*** 361 PAC
We match 4,432 pages of complaints with all 11,948 successfullyfinanced campaigns in our dataset by using names of campaigns and their campaign managers.
5.2.2. Model-Free Evidence. Table6shows that backers who experience damage10 in their first PAC cam-paign see a (statistically significant) lower likelihood of ever funding another Kickstarter campaign in the games or technology categories when compared against backers who do not experience the same kind of damage.
In Table 7, we further report model-free evidence comparing backers’benefits between PAC and NoPAC campaigns. Model-free evidence suggests that backers of PAC campaigns show significantly lower aver-age sentiment scores (i.e., are more negative in their comments) than backers of NoPAC campaigns.
Complaint rates mirror this finding. In total, we record at least one complaint for 94 NoPAC (0.93% of 10.160 funded NoPAC) and 48 PAC (2.68% of 1.788 funded PAC) campaigns. The likelihood of a PAC campaign backer filing an official complaint is thus substantially greater than for backers of NoPAC campaigns. Notably, we observe no com-plaints (0.00%) among the 94 PAC campaigns that kept their PAC promises. The relatively low share of campaigns with complaints overall reflects the sub-stantial effort that is required tofile such an official complaint (Raval2016).
5.2.3. Results. Results after successful matching of PAC backers who do (versus do not) experience damage in their first PAC campaign confirm the model-free evidence. In Table8we see that damage
regarding Promised Savings and Actual Savings, Delivery, Delay, and Product Quality matters to PAC backers. If they experience damage in the respec-tive dimensions, their likelihood of funding another Kickstarter campaign in the games or technology categories drops by up to 90.65%.
We then compare the matched PAC and NoPAC campaigns regarding backer sentiment (t-test) and complaint likelihood (χ2test). Results shown in Table9 mirror the model-free evidence: backers in PAC cam-paigns show significantly more negative sentiment in their comments on the campaign websites and are 50% more likely tofile an official complaint (mean for PAC campaigns is 0.027; mean for NoPAC campaigns is 0.018 after matching).
5.3. Did Consumers Learn to Avoid the Problem? 5.3.1. Analyses. Literature arguing against the ex-plicit regulation of PACs contends that skeptical consumers will learn to discount PACs and thus protect themselves from deception (Urbany et al. 1988, Biswas and Blair1991, Kaufmann et al.1994). In markets with high transparency (such as Kickstarter, where all historic transactions and backer comments are public), consumers might learn from past be-havior (their own and others’) and adapt their be-havior and attitudes (Dellarocas 2003). As shown in Section 5.2, damaged consumers learn to avoid Kickstarter campaigns in general—the crucial ques-tion is, however, whether they learn to avoid PAC campaigns specifically.
In the following, we distinguish PAC-specific learn-ing on three different levels: population (i.e., all consumers learn), subpopulation (i.e., groups such
Table 6. Model-Free Evidence on Reductions in Funding Likelihood for Another Kickstarter Campaign Among Backers That Experienced Damage vs. No Damage in Their First PAC Campaign
Model-free
Drop in funding likelihood
for another campaign Observations
Promised Savings −4.4%*** 182,821 Actual Savings −12.2%*** 191,317 Delivery −91.3%*** 408,571 Delay −6.7%*** 399,778 Product Quality −29.3%*** 87,577 *p<0.10; **p<0.05; ***p<0.01.
Table 7. Model-Free Evidence on Backer Sentiment and Likelihood of Official Complaints for Campaigns Using Price Advertising Claims (PAC) vs. Campaigns Not Using Price Advertising Claims (NoPAC)
Model-free PAC campaigns NoPAC campaigns Difference in means Observations
Campaigns with less beneficial outcome for consumers
Sentiment 0.557 0.598 −0.041*** 10,818 PAC
Complaint 0.027 0.009 0.018*** 11,948 PAC
as the more knowledgeable consumers learn), and individual (i.e., consumers that experienced damage firsthand learn).
• On the population level, PAC-specific learning across all consumers (new and experienced) should be evident in a reduced funding likelihood for PAC campaigns as time progresses because they provide less consumer benefit than NoPAC campaigns.
• On the subpopulation level, we should see more experienced“crowdfunding experts”expecting greater damage from PAC (versus NoPAC) campaigns.
• For individual-level learning, we should see dam-aged (versus nondamdam-aged) PAC campaign backers to show a decrease in the likelihood of funding another PAC campaign that is larger than the decrease in likelihood of funding another campaign on Kickstarter in general. For the population-level analysis, we look for a reduction in funding likelihood for PAC campaigns over time. This reduction could be either an abso-lute reduction in funding likelihood for more recent versus older PAC campaigns (a conservative measure for learning: consumers learn that PAC campaigns are not as good as originally anticipated) or a rela-tive reduction in funding likelihood for recent PAC campaigns compared with recent NoPAC campaigns (where consumers learn that PAC campaigns are less attractive than NoPAC campaigns, akin to a diff-in-diff logic).
In the analysis, we defineRecent Campaign= 1 if the campaign started between April and September 2016 and 0 if the campaign started in the same time frame in the year before (April to September 2015). Although learning about the economic injury associated with PAC
campaigns should occur on a continuous basis given a constant stream of new PAC campaigns, we chose April 2016 as a turning point in our analysis, because it marks the time when the Kickstarter campaign Coolest Cooler failed. Coolest Cooler raised more than $13 million from more than 60,000 backers in 2014, making it one of the most prominent Kickstarter campaigns ever. When the campaign announced it would not deliver a product in April 2016, media coverage was tremendous. Coolest Cooler was a PAC campaign, promising a 38% discount over the retail price. We expect that the highly publicized failure of this PAC campaign added to consumer learning.
To assess population-level learning, wefirst com-pare the funding likelihood of more recent PAC campaigns with the funding likelihood of older PAC campaigns. Second, we compare the change in fund-ing likelihood for recent versus older PAC campaigns against the change in funding likelihood for recent versus older NoPAC campaigns.
For the subpopulation-level learning analysis, we surveyed 31 crowdfunding experts (academics and practitioners attending a crowdfunding conference in 2016, each of whom backed on average 6.72 campaigns) via structured, face-to-face interviews. Specifically, we were interested in their expectations for PAC versus NoPAC campaigns regarding savings, de-livery, delay, and product quality. We collected their answers on a seven-point Likert scale, such that smaller (greater) numbers signified worse (superior) performance of PAC versus NoPAC campaigns. The scale midpoint, 4, thus signified equal expected performance.
Table 8. Reductions in Funding Likelihood for Another Kickstarter Campaign Among Backers That Experienced Damage vs. No Damage in Their First PAC Campaign; Results After Successful Propensity Score Matching
After PSM Promised savings Actual savings Delivery Delay Product quality Likelihood of funding another campaign
Outcome offirst PAC campaign
No damage 0.529 0.528 0.520 0.589 0.660
Damage 0.458 0.475 0.049 0.485 0.507
Drop in funding likelihood –13.43%*** –10.06%*** –90.65%*** –17.69%*** –23.15%***
Number of observations 68,400 155,684 17,644 181,210 51,716
*p<0.10; **p<0.05; ***p<0.01.
Table 9. Results ofT- andχ2-Tests Analyzing Differences in Backer Sentiment and Likelihood of Official Complaints Between Campaigns Using Price Advertising Claims (PAC) vs. Campaigns Not Using Price Advertising Claims (NoPAC)
After PSM PAC campaigns NoPAC campaigns Difference in means Observations
Campaigns with less beneficial outcome for consumers
Sentiment 0.557 0.586 −0.028*** 3,372 PAC
Complaint likelihood 0.027 0.018 0.009* 3,546 PAC
For the individual-level learning analysis, we ex-tended the analysis presented in Table8to include the funding likelihood for future PAC campaigns. For individual-level learning about PACs to occur, the drop in funding likelihood for future PAC campaigns between the two groups (damage versus no damage) needs to be larger than the drop in funding likelihood for future Kickstarter campaigns in general.
Regulators typically step in unless there is population-level learning, in order to make sure that all con-sumers are protected (which is not the case with subpopulation-level learning) and to make sure that consumers are protected before they themselves experience damage (which is not the case if only individual-level learning is prevalent) (Financial Conduct Authority 2017). Still, we subsequently in-vestigate all three levels.
5.3.2. Model-Free Evidence. In Table 10 we report model-free evidence for the funding likelihood of recent and older PAC and NoPAC campaigns. The results show an increase in funding likelihood of PAC campaigns over time, which indicates a lack of PAC-specific consumer learning on the population level. While the increase in funding likelihood for PAC cam-paigns (0.511–0.490 = 0.021) is slightly larger than for NoPAC campaigns (0.306–0.295 = 0.012) in the same period, neither of the increases is statistically significant. As previously reported in Table 6, backers whose first PAC campaign caused damage are less likely to fund another Kickstarter campaign compared with backers whose first campaign caused no damage—indicating that backers care about the damage they experienced firsthand. In Table 11, we present model-free evi-dence that compares the drops in funding likelihood
for Kickstarter campaigns in general versus for PAC campaigns. The drop in funding likelihood for another PAC campaign is never larger than the drop in funding likelihood for Kickstarter campaigns in general. We thus have no indication of PAC-specific individual-level learning from the model-free evidence.
5.3.3. Results. For the population-level analysis, we first compare recent and older PAC campaigns after successful PSM. The probit regression in Table 12 shows that funding likelihood for these campaigns increases over time (positive coefficient for recent campaigns), offering no indication of PAC-specific consumer learning from this analysis.11
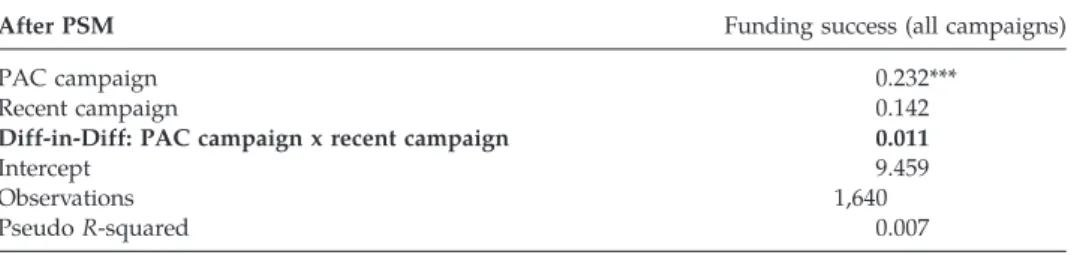
To compare the relative increase in funding like-lihood for PAC campaigns over time with those of NoPAC campaigns, we first apply PSM and then follow the format of a diff-in-diff analysis. Please note that we do not claim that NoPAC campaigns are a perfect control group (after all, the failure of Coolest Cooler may have affected the funding likelihood of NoPAC campaigns as well). Results of the analysis confirm the model-free evidence: the difference in funding likelihood of PAC versus NoPAC campaigns is not significant. If anything, the average funding likelihood of matched PAC campaigns has seen a faster increase (Table 13), which would contradict learning about PACs. We thus cannot observe signs of PAC-specific population-level consumer learning in these analyses.
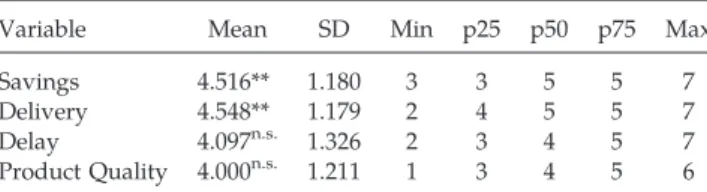
For the subpopulation-level analysis, we surveyed 31 crowdfunding experts as detailed in Table 14. In line with our previous analyses, we do not find evidence of PAC-specific consumer learning, not even among crowdfunding experts. Experts expect
Table 10. Model-Free Evidence on Average Funding Likelihood for Recent (April to September 2016) vs. Older (April to September 2015) Campaigns Using Price Advertising Claims (PAC) vs. Not Using Price Advertising Claims (NoPAC)
Model-free
PAC campaigns NoPAC campaigns
Observations Older campaigns Recent campaigns Older campaigns Recent campaigns
Funding likelihood 0.490 0.511 0.295 0.306 8,215
Table 11. Model-Free Evidence on Reductions in Funding Likelihood for Another Kickstarter Campaign in General vs. Another PAC Campaign Among Backers That Experienced Damage in Their First PAC Campaign
Model-free
Drop in funding likelihood for
PAC-specific consumer learning? Observations Another campaign Another PAC campaign
Promised Savings −4.4% −0.4% No 182,821
Actual Savings −12.2% −4.3% No 191,317
Delivery −91.3% −89.3% No 408,571
Delay −6.7% 3.8% No 399,778
Product Quality −29.3% −11.9% No 87,577
Note. PAC-specific consumer learning would require the drop in funding likelihood for“Another PAC campaign”to be significantly larger than the drop in funding likelihood for“Another campaign.”
PAC campaigns to offer greater savings and de-livery likelihood. They do not expect differences in delay or product quality between PAC and NoPAC campaigns.
Finally, we analyze individual-level learning. Results after PSM confirm the model-free evidence. Backers who experienced damage in theirfirst PAC campaigns show no PAC-specific learning, as the decrease in funding likelihood for PAC campaigns is smaller, not larger, than for Kickstarter campaigns in general (Table15). Put differently, Kickstarter backers that experienced dam-age in theirfirst campaign do care about this damage (as evidenced by substantially lower likelihoods of funding another campaign across allfive dimensions), but they do not attribute their bad experiences to cam-paigns’ usage of PACs and thus do not specifically avoid funding PAC campaigns in the future.
In summary, the above analyses examine the same topic from very different angles but provide the same conclusion: we do not see evidence of PAC-specific consumer learning, neither on the population level that is most relevant for regulators nor on the sub-population or individual level.
5.4. Did Campaign Managers Take Measures that Solved the Problem?
5.4.1. Analyses. Self-regulation in the context of our study could include private self-regulation, by which an individual enterprise regulates itself independent of
others, and industry self-regulation, by which enter-prises decide to cooperate with each other and build an industry-level organization that sets rules and standards (Gunningham and Rees1997). In reward-based crowdfunding, such an industry-level organi-zation currently does not exist. Because of this lack of industry self-regulation (potentially indicating market participants’ lack of interest in addressing consumer protection), we focus on private self-regulation by campaign managers.
Self-regulation by campaign managers is closely connected to signaling theory, by which enterprises credibly communicate the level of some unobservable element in a transaction by providing an observable signal (Tang et al. 2008). For such a signal to be ef-fective in a crowdfunding setting, it must be ob-servable by backers and be difficult (or too expensive) to mimic by a low-quality campaign (Belleflamme et al.2014, Ahlers et al. 2015). The literature distin-guishes between two types of signals: (1) default-independent signals of self-regulation, which involve an upfront expenditure in reputation building that will be forfeited should product quality turn out to be poor, and (2) default-contingent signals of self-regulation, which do not involve any up-front ex-penditure but place future profits at risk (Rao et al. 1999, Kirmani and Rao2000).
On Kickstarter, product quality is de facto unob-servable to consumers when they make the decision to fund the campaign. Hence, campaign managers may try to signal credibility and convince consumers with quality assurances. Such self-regulation by campaign managers should be evident in a substantial number of campaigns containing default-independent signals like seal of approval (Tang et al. 2008) or code of conduct (Wotruba 1997) and default-contingent sig-nals likemoney back guarantee(Moorthy and Srinivasan 1995) and warranty (Kirmani and Rao 2000). We identify campaigns using such signals by employing a rule-based text mining approach on campaigns’ de-scriptions and risk sections.
Table 12. Population-Level Learning: Results of Probit Regression Analyzing Differences in Funding Likelihood Between Recent (April to September 2016) vs. Older (April to September 2015) PAC Campaigns After Successful PSM
After PSM Funding success (only PAC campaigns) Recent campaign 1.029**
Intercept 34.864
Observations 340
PseudoR-squared 0.031
Note. Year-monthfixed effects are included. *p<0.10; **p<0.05; ***p<0.01.
Table 13. Population-Level Learning: Results of Probit Regression Analyzing Differences in Increase in Funding Likelihood Between Recent (April to September 2016) vs. Older (April to September 2015) PAC Campaigns vs. NoPAC Campaigns After Successful PSM
After PSM Funding success (all campaigns)
PAC campaign 0.232***
Recent campaign 0.142
Diff-in-Diff: PAC campaign x recent campaign 0.011
Intercept 9.459
Observations 1,640
PseudoR-squared 0.007
Note. Year-monthfixed effects are included. *p<0.10; **p<0.05; ***p<0.01.