DOI: 10.12928/TELKOMNIKA.v16i1.5895 343
Measuring Enterprise Resource Planning (ERP)
Systems Effectiveness in Indonesia
Adhi Wibowo*1, Marti Widya Sari21
School of Mechanical Engineering. University of Birmingham, Birmingham, United Kingdom 2
Informatics Department, Universitas PGRI Yogyakarta Jl. PGRI I No 117 Sonosewu Yogyakarta 55182, Indonesia *Corresponding author, e-mail: adhi.wibowo@yahoo.com, widya@upy.ac.id
Abstract
Refining DeLone and McLean’s (D&M) information system model and technology-organisation-environment (TOE) framework, this research identifies the prominent factors that determine ERP system success. Hypotheses are also drawn based on supporting theories to evaluate the causal relationship between the success determinants. The level of achievement is measured by system quality, information quality, service quality, external quality and top management support, which intermediated by perceived usefulness and user satisfaction towards business benefits. To provide empirical evidence, 86 valid samples out of 156 were collected using a web survey that targeted ERP users in Indonesia. Furthermore, Partial Least Squares–Structural Equation Modelling (PLS-SEM) algorithm were applied to check the proposed hypotheses. The results suggest system quality, information quality and service quality significantly affect user satisfaction, whereas they moderately impact on perceived usefulness. Interestingly, external pressures were reported as being the biggest influence on user satisfaction and positively impacted on perceived usefulness. Despite being fairly predictive to perceived usefulness, top management support along with general perceptual factors ultimately promote system success by elevating business benefits.
Keywords: ERP, information system, enterprise, resources, planning
Copyright © 2018 Universitas Ahmad Dahlan. All rights reserved.
1. Introduction
Enterprise Resource Planning (ERP) has emerged to be one of the biggest IT investment in the early 1990s to respond the challenge of business functionality integration from its predecessor Manufacturing Resource Planning II [1]. Since then, this billion-dollar system has attracted attention not only from manufacturing industry but also from other organisations [2] notes how the ‘ERP system’s true ambition attempts to integrate all department and function across a company onto a single computer system. Also, by implementing the information system model, organisations expect to gain competitive advantages and considerable benefits, including increased productivity and performance improvement, better resource management, lower total cost ownership and accelerated business growth [3]. However, information system model implementations often have a high failure rate [4]. One study found that between 50% and 75% of advanced manufacturing or information technology implementation in the US firms failed [5]. Furthermore, greater difficulties with ERP implementation in developing countries were indicated due to poor change management, lack of resources and most importantly organisational issues such as high hierarchical structure and highly bureaucratic government [6]-[7] also found a system-design mismatch with the reality and culture of organisations as another contributory factor for implementation failure in developing countries. While ERP system implementation failure is considered high, the ERP market in developing countries is growing, and ERP adoption by organisations is increasing [8]. Therefore, it is crucial to understand the magnitude of ERP system success factors to ensure that organisations gain the most benefits and to minimise potential risks.
2. Research Method
2.1. Research Design and Hypotheses
There are many ways to examine the association between the ERP success factors and to comprehend which dimensions have significant effects on ERP system effectiveness. Non-experimental quantitative design in which the data is collected from questionnaires is the best research approach to achieve such purposes. Explanatory studies are also employed to explain the causal relationship between factors that have been hypothesised below. In addition, a combination of quantitative technique in this survey research is considered for several reasons:
a. Broader subjects are required in ERP research to cover more implementation in various industries.
b. The research allows greater accuracy and objectivity than when conducted by a qualitative method.
c. It prevents personal bias occurring by keeping respondents at a distance.
A computer-assisted questionnaire was developed to cover a larger sample size as well as to provide more flexibility to respondents in filling in the survey. Additionally, an online survey instrument was used to reduce data entry errors and efficient data collections.
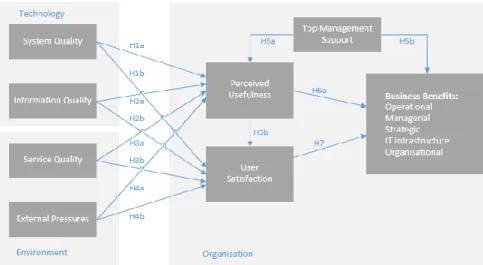
In the research model in Figure 1, system quality defines the expected attributes of an ERP system that produces information, including reliability, responsiveness and flexibility [9]. The high quality of the system, including hardware specification, network infrastructure and system design, signify user satisfaction in the ERP system [10]. Information quality measures the expected features of an ERP system’s product, output and contents, such as accuracy, validity, currency/up-to-date and security [9], [11].
Figure 1. Research model structure (after D&M, 2003)
Service quality measures the attributes of overall support provided by the service provider and the internal/external support team, comprising competency, capability and credibility. [11]-[13] investigated perceived usefulness as a relevance factor that influences the shared beliefs about the benefits of technology. Other researchers signify the theoretical framework developed by Delone and McLean that the factors of system quality and information quality, along with service quality, are significant for the success of the ERP system [14]-[18]. In short, a reliable, high-performance ERP system, along with accurate ERP information and excellent ERP support, will likely affect user satisfaction in utilising the the system. Hence, the formulated hypotheses were:
H1a: ERP system quality significantly affects perceived usefulness of ERP system usage. H1b: ERP system quality significantly affects user satisfaction of ERP system usage.
H2a: ERP information quality significantly affects perceived usefulness of ERP system usage. H2b: ERP information quality significantly affects user satisfaction of ERP system usage. H3a: ERP service quality significantly affects perceived usefulness of ERP system usage.
H3b: ERP service quality significantly affects user satisfaction of ERP system usage.
[19] explain external control theory as environmental pressure, such as information technology growth and industry/market competition, influencing the decision-making process in an organisation. With the rapid development and regular updating of new technology, especially ERP, people and organisations need to be highly adaptable to changes in system usage. According to the TOE framework [20], the environmental context includes the government as the regulator. In this research, external pressure defines a measure of the external factors that influence the ERP system success, including local policy/regulation, technology growth and market competition. Previous ERP studies also have confirmed that the government plays an important role as the policymaker and in providing regulatory support in system information implementation success [21]-[25]. Besides, the system in which the technology being updated is potentially to have a positive influence on how users perceive usefulness and satisfaction in using ERP system. As a result, this study drew hypotheses:
H4a: External pressure significantly affects perceived usefulness of ERP system usage. H4b: External pressure significantly affects user satisfaction of ERP system usage.
To be successfully carried out, complex ERP implementation involves many stakeholders, including senior management. High-level project management and sponsors are required to achieve IT-based business innovations, a context of ERP business benefits. A study by [26] reveals that senior-level management, business promoters and champion involvement are the important factors succeeding ERP system implementation. Top management support defines a measurement variable that refers to the support of priorities by senior management or leadership and the extent of leadership involvement in the ERP system implementation [18]. The measurement items include resource allocation support, responsibilities for resolving strategic business misalignment and leadership involvement [27], [16], [18], [28]. This research proposed hypotheses:
H5a: Top-level executives support significantly affects perceived usefulness of ERP system usage.
H5b: Top-level executives support significantly affects the organisation in achieving the business benefit of ERP system.
[12] criticises a model developed by [9] that uses perceived usefulness as a success measurement instead of IS use due to the misinterpretation of the behavioural indicator. In this study, perceived usefulness defines an indicator level in which users believe that the usage of the ERP system has enhanced individual performance [12], [10]. Perceived usefulness is recognised as a proxy of other indicators, such as system quality, information quality and service quality, to achieve ERP success [13] and user satisfaction [30]. The IS success model is that frequent ERP system use and user satisfaction will act as strong intermediaries for gaining more benefits [11]. Accordingly, the hypotheses were drawn as follows:
H6a: Perceived usefulness of ERP system usage significantly affects business benefits. H6b: Perceived usefulness of ERP system usage significantly affects user satisfaction. H7: User satisfaction of ERP system usage significantly affects business benefits.
3. Results and Analysis 3.1. Data Collection
The candidates of this survey were initially selected from the listed state-owned enterprise (SOE), Fortune 100 biggest companies, and the others were recommended by ERP practitioners. The companies were then shortlisted according to those whose IT departments invested their corporate information system with ERP applications. The ERP implementation period was chosen to be at least two years in the post-implementation onward-and-upward phase. Among those organisations, internal connections were contacted. These hold positions that include that of staff, supervisor, functional manager, ERP project manager and top level management.
The second approach was performed by sharing the questionnaire link to the closed connections in social media such as Facebook, LinkedIn, email-based groups and mobile messaging-based groups. Furthermore, phone calls and emails were conducted to remind the respondents. A total of 158 responses were returned, with 80 completed, 60 partially-completed and 18 disqualified. After data verification, nine partial sets of data were included and three invalid completed data were removed, which resulted in 86 valid data responses used in this
research. Table 1 shows the demographic profiles of the participants and their companies. Despite its low responses, the sample was composed of various industry types that have implemented ERP systems over an average of nine years. Additionally, the ERP experience of respondents averaged 7.8 years, indicating that the information is sufficiently reasonable to represent ERP practice understanding. Also, a high percentage of the number of employees above 1000 shows that ERP are mostly implemented by large companies.
Table 1. Characteristics of the Respondents (N=86)
3.2. Result of Technological Context
According to the mean scores inspection reported in Table 2, all indicators in the system quality and information dimensions show values in the range of 3 to 4, suggesting neutrality to the agreement with the survey statements. In particular, SYQUAL1 (system reliability) and INQUAL3 (data/information security) have the highest mean score among other indicators, suggesting the ERP system is characterised by high-reliability hardware and infrastructure that has provided secure information as the biggest priority. However, ERP is perceived as less flexible for integrating with other systems, indicated by the lowest mean score of the indicator SYQUAL3. Moreover, the ERP system characteristics are preferable to users, including fast response system (SYQUAL2), accurate information (INQUAL1) and real-time data (INQUAL3). Concerning negative skewness, the score represents more of a distribution of the sample on the lower score than the mean value.
3.3. Result of Organisational Context
Upon observing the success level of the organisational context in Table 3, perceived usefulness indicators obtain relatively higher mean figures among the others, except for the PERUSE2 indicator that achieves the lowest degree by 3.512. Interestingly, the intensive use of an ERP system to support works has the highest mean score by 4.279 among other indicators, possessing the positive skew value of 1.716, which signifies the strong agreement degree of respondents in utilising ERP system. As the highest Min value, indicator PERUSE4 also confirmed that no respondent disagreed with adopting an ERP system as a best practice solution. Concerning user satisfaction, the mean score 3.68 explained the degree of personal satisfaction in using an ERP system.
Table 3. Descriptive Statistics of the Organisational Context
3.4. Result of Environmental Context
In Table 4 below, the mean scores 4.035 and 4.135 of EXTERN2 and EXTERN3 respectively contrast the average value of EXTERN1 by 3.209, indicating the government policy may have lesser effects on-system effectiveness than accelerated technology innovation and market competition. A highest mean point of EXTERN3 also exhibits users believe that market competition is the potential strongest challenge in achieving ERP system success. About the service quality dimension, system support expertise stands out as one of the critical criteria of system effectiveness. Mean values of 3.791, 3.686 and 3.826 illustrate the indicators of support experience, technical competence and support credibility respectively. Having a positive value of skewness describes the longer tail distribution to the higher values than the mean, although points under 2.0 are still normal.
Table 4. Descriptive Statistics of the Environmental Context
3.5. Reliability
The results in Table 5 show that the outer loadings are mostly above the cut-off value of 0.70, reflecting the high indicator reliability, except for indicators SYQUAL3, INQUAL3, EXTERN1, PERUSE2, PERUSE4 and BENEFI, which have values in the range 0.60–0.70; however, they are acceptable. Hair et al. (2011) suggest that indicator loadings and composite
reliability should be greater than 0.70 while the AVE should be higher than 0.50, although, in exploratory research, 0.60 for composite reliability is sufficient.
Table 5. Model Internal Consistency Reliability and Validity
3.4. Validity
Another aspect of the model evaluation is discriminant validity, which measures how well the construct discriminates from others [30]. In structural equation modelling based on partial least squares, there are two acceptable methods for analysing the relationship between constructs: The Fornell-Larcker measure and cross-loadings technique [11]. Subsequently, [32] proposed an alternative approach to a measurement mean using the heterotrait-monotrait (HTMT) ratio of correlation. [33] postulates that the square root of AVE, whose criterion should be greater than its correlation with other latent variables, may also be used to calculate the discriminant validity. Fornell-Larcker condition can be presented as the following equation:
√
where rij denotes the correlation coefficient between the constructs i and j. Table 6 shown the values of the Fornell-Larcker discriminant validity (AVE square root). Its block of indicators is higher than the correlation values (with other variables) below them. That is, discriminant validity has been established.
Cross-loadings as an alternative measure of discriminant validity proposes a condition where each indicator loading value should be higher than all of its cross-loadings [34]. As shown in Table 7, the values of each indicator loading are higher than other cross-loading values, except that the one value, SYQUAL3, is lower than the cross-loading value of SYQUAL-PERUSE5. However, [32] investigated the result of the Fornell-Larcker criterion and cross-loadings measurement, finding it to be poor due to the lack of ability to detect a discriminant validity problem.
Table 7. Discriminant Validity–cross Loadings
4. Conclusion
Developing the D&M model and incorporating a TOE framework, this research proposes an integrative ERP success measurement model and establishes an empirical work from a developing country, in this case, Indonesia. To rectify the missing gaps in a multidimensional success concept, this research reviewed eight predictors of ERP system success viewing in the technological context (system quality and information quality) and organisational context (perceived usefulness, user satisfaction, top management support and business benefits). Empirical works were conducted to support a combined theoretical and structural model utilising online survey that collected 86 valid respondents from various industries in Indonesia. The data was analysed using a PLS-SEM algorithm.
The findings demonstrate that system quality, information quality and service quality significantly impact on user satisfaction; whereas these factors are reported to influence perceived usefulness fairly. Notwithstanding the contradictory results of previous research, the latter reveals the phenomenon that ERP users in developing countries might overlook the capability and useful features of an ERP system. This research also recognises that external factors, interestingly, play critical roles in determining both system use and degree of user satisfaction, thus confirming that organisations need to pay attention to rapid technology changes that could be beneficial to the ERP system, although, it also found that government policy might be a weak indicator.
With regard to the organisation level, this research finds meaningful proxies of perceived usefulness and user satisfaction, leading most independent factors to achieve the final goal of the system, which is to anticipate the most business benefit. Moreover, the obvious correlation between senior management support and overall system benefits was identified as
the most critical success indicator that can drive the organisation, the business process and technology to achieve the company’s goal.
References
[1] Chung S, Synder C, ERP initiation-a historical perspective. AMCIS Proceedings 1999: 76.
[2] Shakkah MS, Alaqeel K, Alfageeh A, Budiarto R. An Investigation Study on Optimizing Enterprise Resource Planning (ERP) Implementation in Emerging Public University: Al Baha University Case Study. International Journal of Electrical and Computer Engineering (IJECE). 2016; 6(4): 1920-1928. [3] Subiyakto A, Ahlan AR. Implementation of Input-Process-Output Model for Measuring Information
System Project Success. TELKOMNIKA (Telecommunication Computing Electronics and Control) 2014; 12(7): 5503-5612.
[4] Subiyakto A, Ahlan AR, Kartiwi M, Sukmana HT. Measurement of Information System Project Success Based on Perceptions of the Internal Stakeholders. International Journal of Electrical and Computer Engineering (IJECE). 2015; 5(2): 271-279.
[5] Umble EJ, Haft RR, Umble MM. Enterprise resource planning: Implementation procedures and critical success factors. European Journal of Operational Research. 2003; 146 (2): 241-257.
[6] Amid A, Moalagh M, Ravasan AZ. Identification and classification of ERP critical failure factors in Iranian industries. Information Systems. 2012; 37 (3): 227-237.
[7] Hawari A, Heeks R. Explaining ERP failure in a developing country: a Jordanian case study. Journal of Enterprise Information Management. 2010; 23 (2): 135-160.
[8] Huang Z, Palvia, P. ERP implementation issues in advanced and developing countries. Business Process Management Journal. 2001; 7 (3): 276-284.
[9] DeLone WH, McLean ER. Information systems success: The quest for the dependent variable. Information systems research. 1992; 3 (1): 60-95.
[10] Lin H. An investigation into the effects of IS quality and top management support on ERP system usage. Total Quality Management. 2010; 21 (3): 335-349.
[11] Delone WH, McLean ER. The DeLone and McLean model of information systems success: a ten-year update. Journal of Management Information Systems. 2003; 19 (4): 9-30.
[12] Seddon PB. A respecification and extension of the DeLone and McLean model of IS success. Information Systems Research. 1997; 8 (3): 240-253.
[13] Amoako Gyampah K, Salam AF. An extension of the technology acceptance model in an ERP implementation environment. Information & Management. 2004; 41 (6): 731-745.
[14] Bradford M, Florin J. Examining the role of innovation diffusion factors on the implementation success of enterprise resource planning systems. International Journal of Accounting Information Systems. 2003; 4 (3): 205-225.
[15] Chien S, Tsaur S. Investigating the success of ERP systems: Case studies in three Taiwanese high-tech industries. Computers in Industry. 2007; 58 (8): 783-793.
[16] Ifinedo P. Impacts of business vision, top management support, and external expertise on ERP success. Business Process Management Journal. 2008; 14 (4): 551-568.
[17] Bernroider EW. IT governance for enterprise resource planning supported by the DeLone–McLean model of information systems success. Information & Management. 2008; 45 (5): 257-269.
[18] Lin H. An Investigation into the Effects of IS Quality and Top Management Support on ERP System Usage. Total Quality Management. 2010; 21 (3): 335-349.
[19] Markus ML, Tanis C. The enterprise systems experience-from adoption to success. Framing the domains of IT research: Glimpsing the future through the past. 2000; 173 207-173.
[20] Tornatzky LG, Fleischer M, Chakrabarti AK. Processes of technological innovation. Lexington Books. 1990.
[21] Ifinedo P. An investigation of the impacts of some external contextual factors on ERP systems success assessment: a case of firms in Baltic-Nordic region. International Journal of Internet and Enterprise Management. 2006; 4 (4): 355-378.
[22] Ramdani B, Kawalek P, Lorenzo O. Predicting SMEs' adoption of enterprise systems. Journal of Enterprise Information Management. 2009; 22(1/2):10-24.
[23] Pan M, Jang W. Determinants of the adoption of enterprise resource planning within the technology-organization-environment framework: Taiwan's communications industry. Journal of Computer Information Systems. 2008; 48 (3): 94-102
[24] Supramaniam M, Kuppusamy M. ERP System Adoption in Malaysia: A Comparative Analysis between SMEs and MNCs. European Conference on Information Management and EvaluationAcademic Conferences International Limited. 2010: 372.
[25] Lin H. Understanding the determinants of electronic supply chain management system adoption: Using the technology–organization–environment framework. Technological Forecasting and Social Change. 2014; 86 80-92.
[26] Leslie P, Richard S. The Role of the CIO and IT function in ERP. Communications of the ACM. 2006; 43 (4): 32-38.
[27] Bradford M, Florin J. Examining the Role of Innovation Diffusion Factors on the Implementation Success of Enterprise Resource Planning Systems. International Journal of Accounting Information Systems. 2003; 4 (3): 205-225.
[28] Zhu Y, Li Y, Wang W, et al. What leads to post-implementation success of ERP? An empirical study of the Chinese retail industry. International Journal of Information Management. 2010; 30(3): 265-276. [29] Fan JC, Fang K. ERP Implementation and Information Systems Success: a test of DeLone and
McLean's model. Technology Management for the Global Future-PICMET 2006 Conference IEEE. 2006: 1272.
[30] Hair JF, Ringle CM, Sarstedt M. PLS-SEM: Indeed a silver bullet. Journal of Marketing Theory and Practice. 2011; 19 (2): 139-152.
[31] Hair JF, Ringle CM, Sarstedt M. PLS-SEM: Indeed a silver bullet. Journal of Marketing Theory and Practice. 2011; 19 (2): 139-152.
[32] Henseler J, Ringle CM, Sarstedt M. A new criterion for assessing discriminant validity in variance-based structural equation modeling. Journal of the Academy of Marketing Science. 2015; 43 (1): 115-135.
[33] Fornell C, Larcker DF. Evaluating structural equation models with unobservable variables and measurement error. Journal of Marketing Research. 1981: 39-50.
[34] Chin WW. The partial least squares approach to structural equation modeling. Modern methods for business research. 1998; 295 (2): 295-336.