Empirical Equation to Estimate the Values of the Temperature
Minimum and Maximum from of the Average
Asraa Khtan
College of Sciences, University of Al-Mustansiriyah/ Baghdad E-mail of the corresponding author: : [email protected]
Abstract
In this paper an empirical equation designed to estimate the values of the temperature minimum and maximum of the average for the city of Baghdad, for the months of January and July Depending on the ratio of the mean of increase and decrease of the temperature minimum and maximum from average. The correlation coefficient between the Observed and calculated values fro these equations was computed to test the accuracy of these equations, which gave reasonably very good results.
Keywords: empirical equation, maximum and minimum temperature, Baghdad.
1. Introduction
Temperature is one of the basic elements of weather and climate. air temperature is measure of heat content of air (David P.et al, 1982).WMO defines air temperature as "the temperature exposed to the air in place sheltered from direct solar radiation" (WMO,2014).Air temperature affects other weather elements including air pressure, cloud formation, humidity and precipitation , also affects on plants, soil and air pollution. for this reason there are many studies concerned with ways calculate or predict the air temperature by using statistical methods, mathematical equation and physical model.( Zachary A.et al,2011) developed empirical models from a set of short-term, high spatial resolution temperature measurements that once developed, could be used in near real-time applications or climate projections,( Wen Z.et al,2011) designed empirical models for estimating daily maximum, minimum and mean air temperature with MODIS of land surface temperatures,( Jerry F.,et al,1993) used regression analysis to develop a computer model based on those empirical relationships to predict diurnal air temperature ,(SteveK.,2009 ) discusses the development of an empirical model for air temperature prediction to evaluate the impact of estate development by means of Geographical Information System (GIS),(Wanqiu and Arun,2010) used global forecast system for the prediction of monthly mean air temperature ,and (Andreas P. et al,2008) provided the prediction skill for weekly averaged forecasts of surface air temperature in dependence of lead time, region, and season.
Most of studies focused on average air temperature so the aim of this study is to estimate the values of maximum and minimum temperature from the mean.
2-Data
In this study we used daily temperature of January as a cold period and July as a hot period for Baghdad from (2005-2014) these data were obtained from the website Underground Weather. Sample mean was computed where the daily mean temperature (Tmean)is determined by averaging the 24 hourly readings . We used the
maximum air temperature (Tmax) where the temperature of the air is the hottest time of the day, be at noon.
Minimum air temperature (Tmin) is the coolest time of the day directly before sunrise(Dorian J. et al,2010). Some
statistical methods have been used to explain the change and variety in temperature .Range is the difference between the maximum and minimum temperature while variance measures how far a set of numbers is spread out. A variance of zero indicates that all the values are identical. Variance is always non-negative: a small variance indicates that the data points tend to be very close to the mean (expected value) and hence to each other, while a high variance indicates that the data points are very spread out around the mean and from each other(J.Chapman and Charles B. ,1993).
3- Methodology
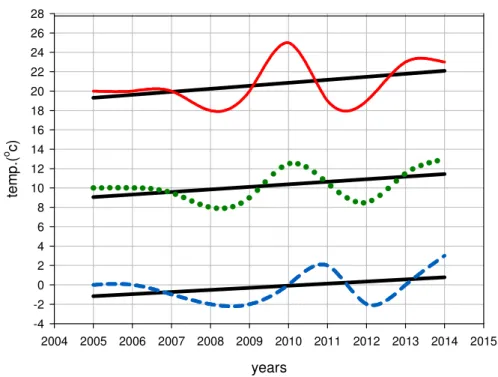
The time series of monthly temperatures (Tmax,Tmean and Tmin) drawn for January in Fig(1) it refers that the three
time series take the same form in the oscillation, although the general trend is on the rise with slope (2)this means that in January rise in temperature within the study period.the variance for Tmax (5) and Tmin(3) with range
of (7) and (5) respectively. there is a clear variation in both two time series (maximum and minimum) but the range (Tmax) is much higher than the range of (Tmin).
years 2004 2005 2006 2007 2008 2009 2010 2011 2012 2013 2014 2015 te m p .( o c ) -4 -2 0 2 4 6 8 10 12 14 16 18 20 22 24 26 28
Figure 1. Time series of temperatures (Tmax,Tmean and Tmin) of Baghdad
(January)
Figure (2) shows the time series of (Tmax, Tmin and Tmean) for July with simple oscillation and little variation
(Tmax) (3) much higher than the variation for (Tmin) (0.9). The range was a close relative where it was (5) for
(Tmax) and (3) for (Tmin). The general trend is very simple rise with slope (0.2).This means that the temperatures
of July are for ten years of study almost the same.
Figure (2): Time series of temperatures (Tmax,Tmean and Tmin) of Baghdad (July)
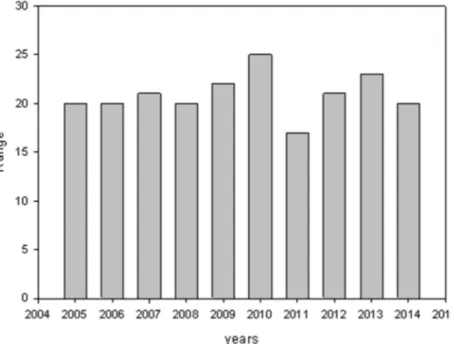
The monthly temperature range Was calculated for both months, where they were both so close (17-25) for January and (19-24) for July, as shown in Figures (3 and 4).
Figure 3: Monthly temperature range for January
Figure 4: Monthly temperature range for July
To design empirical equation to estimate the maximum temperatures ,we calculated the average rate of increase between (Tmax) and (Tmean) through the relationship
Tinc%=(Tmax – Tmean)/Tmean)*100% (1)
Figures (5,6) describes the rate of increase for January and July, respectively, for the period of study.
The rang of increase of January recorded (77-124%) with mean (104%) which is higher than of July, which was(26-32%) with mean (30%).
Tmean 8 9 10 11 12 13 Tm a x . 18 19 20 21 22 23 24 25 70 80 90 100 110 120 130
Figure(5): rate of increase for the months of January
Tmean 25.0 25.5 26.0 26.5 27.0 27.5 28.0 Tm a x 46 47 48 49 50 51 28 30 32 34
The empirical equation to estimate the maximum temperature of the city of Baghdad for January and July are respectively
Tmaxp=(1.04Tmean)+Tmean (3)
Tmaxp=(0.3Tmean)+Tmean (4)
To design empirical equation to estimate the minimum temperatures ,we calculated the average percentage decrease between (Tmin) and (Tmean) through the relationship
Tdec%=(Tmin – Tmean)/Tmean)*100% (5)
We found that the percentage of decrease is equal to the percentage of increase but with opposite Signal for both months
The general formula is designed to estimate the minimum temperature of mean which takes the general form Tmin p =Tdec% +Tmean (6)
The empirical equation to estimate the minimum temperature of the city of Baghdad for the month of January and July are respectively
Tminp=(-1.04Tmean)+Tmean (7)
Tminp=(-0.3Tmean)+Tmean (8)
To test the accuracy of empirical equations designed in the study we calculated values of the temperature maximum and minimum of the equations for both months. Later the calculated values compared with the observer values as table (1,2) shows. The results have been tested statistically using the coefficient of correlation (r) and found it scored nearly the highest in the maximum temperatures of Minimum for both months and estimated coefficient of variation (c.v), as table (3) shows.
Table (1): the calculated values and observer values of January
years Tmean Tmin Tminp Tmax Tmaxp
2005 10 0 -0.4 20 20.4 2006 10 0 -0.4 20 20.4 2007 9.5 -1 -0.4 20 19.4 2008 8 -2 -0.4 18 16.4 2009 9 -2 -0.4 20 18.4 2010 12.5 0 -0.5 25 25.5 2011 10.5 2 -0.4 19 21.4 2012 8.5 -2 -0.3 19 17.5 2013 11.5 0 -0.5 23 23.5 2014 13 3 -0.5 23 26.5
Table (2): the calculated values and observer values of July
years Tmean Tmin tminp Tmax tmaxp
2005 36 25 25.2 47 46.8 2006 36.5 27 25.55 46 47.45 2007 38.5 28 26.95 49 50.05 2008 37 26 25.9 48 48.1 2009 35.5 25 24.85 46 46.15 2010 39 27 27.3 51 50.7 2011 38 26 26.6 50 49.4 2012 38.5 27 26.95 50 50.05 2013 36.5 26 25.55 47 47.45 2014 37 27 25.9 47 48.1
Table (3): the coefficient of correlation and coefficient of variation .
rjan rjulay c.vjan c.vjulay
Tmax .89 .92 10.6% 3.5%
Tmin .56 .72 840% 3.6%
Conclusion
It can estimate (Tmax and Tmin) from (Tmean) by using average rate of increase and decrease between them
because empirical equations designed get very good results for estimate Tmax and good results for estimate Tmin
References
David P. Shelton, Gerald R. Bodman (1982). Air Properties Temperature and Relative Humidity. Historical Materials from University of Nebraska-Lincoln. pp 928.
(WMO).pat II,(2014). Guide to Meteorological Instruments and Methods of Observation
Zachary A. Holdena, John T. Abatzogloub, Charles H. Lucec, L. Scott Baggettd. (2011). Agricultural and Forest meteorology, (151), pp1066–1073.
Wen Zhang, Yao H., Yongqinag and Wenjuan S.(2011). Empirical models for estimating daily maximum, minimum and mean air temperatures with MODIS land surface temperatures. International Journal of Remote Sensing .Vol. 32, No. 24, 20 December 2011,pp 9415–9440.
Jiquan Chen a, Jerry F. Franklin a and Thomas A. Spies. (1993). An empirical model for predicting diurnalair-temperature gradients from edgeinto old-growth Douglas-fir forest .Ecological Modelling, X79Elsevier Science Publishers B.V., Amsterdam. 67, pp179-198
Kardinal Jusuf.(2009). Development of empirical models for an estate level air temperature prediction in Singapore Steve. The seventh International Conference on Urban Climate,29 June - 3 July 2009, Yokohama, Japan .
Mingyue Chen, Wanqiu Wang, Arun Kumar.(2010). The Roles of Atmospheric and Land Initial Conditions and Sea Surface Temperature. Journal of Climate Volume 23, Issue 3 (February 2010) pp 717-725.
Andreas P. Weigel, Daniel Baggenstos, Mark A. Liniger, Frédéric Vitart, Christof Appenzelle.(2008). Probabilistic Verification of Monthly Temperature Forecasts . Monthly Weather Review Volume 136, Issue 12 (December 2008) pp. 5162-5182.
Dorian J.Burentte and David W.Stahle.(2010). Daily Mean Temperature reconstructed for Kansas from Early Instrumental and Modern Observations.journal of climate,I(6),V(23),2010.pp 1308-1333.
J.Chapman, Charles B. Monroe.(1993).An Introduction to Statistical Problem Solving in Geography.MC Graw-Hill,305.