Modeling closed-loop supply chains in the electronics industry:
A retailer collection application
I-Hsuan Hong
a,⇑,1, Jun-Sheng Yeh
b aInstitute of Industrial Engineering, National Taiwan University, 1, Section 4, Roosevelt Road, Taipei 106, Taiwan b
Department of Industrial Engineering and Management, National Chiao Tung University, 1001 Ta Hsueh Road, Hsinchu 300, Taiwan
a r t i c l e
i n f o
Article history:
Received 17 August 2010
Received in revised form 15 December 2011 Accepted 12 January 2012
Keywords:
Closed-loop supply chain Third-party
Recycle Channel design
a b s t r a c t
This paper proposes aretailer collection model whereby the retailer collects end-of-life products and the manufacturer cooperates with a third-party firm to handle used products, and anon-retailer collectionmodel whereby a third-party firm is subcontracted by the man-ufacturer for collection work. While the return rate, manman-ufacturer’s profits, and channel members’ total profits of the retailer collection model are not always superior to those of the non-retailer collection model, we find that the retail collection model analytically outperforms when the third-party firm is a non-profit organization for recycling and disposal.
Ó2012 Elsevier Ltd. All rights reserved.
1. Introduction
Collection, recycling and disposal procedures for used and obsolete products are important components of corporate responsibility. In an industry which seemingly produces new electronics almost daily, the volume of scrap electronics, or e-scrap, has proliferated throughout the world. For example, there are an estimated 500 million obsolete or unused comput-ers in the United States alone, but only 10% are recycled (SVTC, 2009). Much e-scrap poses serious risks because of the haz-ardous substances it contains, such as lead, cadmium and mercury.
The environmental impacts of e-scrap have not gone unnoticed and governmental entities in both Europe and North America regulate disposal of electronic equipment containing toxic materials. In Europe, Waste Electrical and Electronic Equipment Directive (WEEE, 2003) and Restriction of Hazardous Substances Directive (RoHS, 2003) have been applicable for several years. In the United States, California specifies a mandatory electronic waste recycling fee of $8–$25 for certain electronic products shipped directly to the state (IWMB, 2003). In Maine all producers are responsible for electronic waste recycling (MRS, 2008). In addition, some governments also request that manufacturers selling new or replacement goods must collect the older products from customers and dispose of them appropriately. Many manufacturers even encourage customers to return brands other than their own for safe disposal or recycling. For example, in 2008 Hewlett–Packard (HP) collected 265 million pounds of used products; since 1987 the cumulative volume is more than 1435 million pounds (HP, 2008a). In 2008 Dell reported recovery for 135 million pounds of information technology equipment (Dell, 2008a). Now-adays, Dell’s manufacturing operations can recycle or reuse about 95% of their waste (Dell, 2008a).
Since e-scrap and other product recycling can enhance a company’s reputation and potentially attract more sales from environmentally conscious consumers, improving the efficiency of recycling programs has become a subject of interest in
1366-5545/$ - see front matterÓ2012 Elsevier Ltd. All rights reserved. doi:10.1016/j.tre.2012.01.006
⇑Corresponding author. Tel.: +886 2 3366 9507; fax: +886 2 2362 5856. E-mail address:[email protected](I.-H. Hong).
1
The corresponding author holds a joint appointment with the Department of Mechanical Engineering, National Taiwan University. Contents lists available atSciVerse ScienceDirect
Transportation Research Part E
j o u r n a l h o m e p a g e : w w w . e l s e v i e r . c o m / l o c a t e / t r ethe literature. Several studies discuss reverse logistics management for used products.Guide and Van Wassenhove (2009)
extensively review the rapidly evolving field of closed-loop supply chains covering 1996–2008.Ross and Evans (2003)
andJenkins et al. (2003)introduce the importance of choosing recycling strategies which provide positive effects on envi-ronment.Shi et al. (2011)determine the production quantities of brand-new products, the remanufactured quantities, and the acquisition prices of the used products simultaneously so as to maximize the manufacturer’s total expected profit.
Chen and Sheu (2009)conclude that governments should gradually raise regulation standards so that rational manufacturers will gradually improve product recyclability.Pochampally and Gupta (2003), Sarkis (2003), Hong et al. (2006), andVlachos et al. (2007)investigate strategic issues of reverse supply chain network design or capacity planning, including the selection of the most economical products to reprocess, identifying potential facilities from a set of candidate recovery facilities, and solving facility location and capacity problems to achieve the optimum mix of logistics and quantities of goods. In addition, several studies discuss the inventory management for green components (Chung and Wee, 2008, 2010), deteriorating green products (Wee et al., 2011), short life-cycle products (Chung and Wee, 2011), and used products (Chung et al., 2008).
The global electronic industry’s supply chains are gradually evolving from open-loop unidirectional flows of products – from supplier to end user – to more complex, closed-loop, linked forward and reverse arcs (seeFleischmann et al., 2000; Guide et al., 2003; Realff et al., 2004; Pishvaee et al., 2011). Some literature examines recycling or green practices in specific industries, i.e. paper (Pati et al., 2006, 2008), plastics (Arena et al., 2003; Siddique et al., 2008) and automobiles (Azevedo et al., 2011; Schultmann et al., 2006). For electronicsNagurney and Toyasaki (2005)andHong et al. (2008)analyze the deci-sion-making behaviors of recyclers, processors, and consumers associated with the demand markets for distinct products in a model of reverse supply chain management of e-scrap.
Subcontracting with a third-party firm such as a transportation service provider or a non-profit organization to operate recycling programs is common industry practice. For instance, GENCO, a third-party logistics company in North America, provides reverse logistics services that can decrease return processing cost-per-unit by 50% (GENCO, 2008). Other examples can be found in the personal computer industry. In Europe, Dell Corporation subcontracts to third-party firms for collecting used computer equipment and delivering it to Dell’s obsolete products processing center (Dell, 2008b). Hewlett Packard con-tracts with a waste removal and management firm to collect e-scrap (HP, 2008b). Acer Corporation consults with a logistics company to carry out product recycling programs for the entire European region (Acer, 2008). All used products are sent to Acer’s cooperating local third-party recyclers and disposed of properly.
It is important to note the existence of contract design issues between manufacturers and third-party firms.Giannoccaro and Pontrandolfo (2004)provide an exhaustive review of supply chain coordination by contract design.Taylor (2001) exam-ines channel coordination under end-of-life returns.Krumwiede and Sheu (2002)andMeade and Sarkis (2002)show the importance of partnering with third-party logistics providers in reverse logistics processes, andÖstlin et al. (2008)identify and discuss different types of closed-loop relationships for gathering worn/broken/used products for remanufacture.
The literature analytically proves a third-party collection model to be ineffective in a general closed-loop supply chain;
Savaskan et al. (2004)study the structural problems of a chain with product remanufacturing where three collection options (manufacturer, retailer, and third-party) are analyzed. The retailer collection option with the manufacturer as the refacturer is considered best for achieving performance of profits and return rates. Nevertheless, in reality electronics manu-facturers of consumer products typically are not remanumanu-facturers, a situation which hampers the design of closed-loop supply chains as proposed in the earlier literature. In this paper we propose aretailer collectionmodel whereby the retailer collects end-of-life products and the manufacturer cooperates with a third-party firm to handle used products. The proposed retailer collection model, therefore, is based upon the concept that retailers engage in collection and manufacturers cooper-ate with third-parties. For comparative purposes, we develop anon-retailer collectionmodel whereby the manufacturer sub-contracts a third-party firm for collection.
The remainder of this paper is organized as follows. Section2introduces a non-retailer collection model for comparative purposes and develops the closed-loop supply chain model with retailer collection. Section3compares the performance of the retailer collection model with the non-retailer collection model for return rate, manufacturer’s profits, and total profits of channel members, conducts a sensitivity analysis, and examines the behavior of a third-party firm as a non-profit organiza-tion. Section4presents our conclusions and suggests future research.
2. Analysis of recycling systems
This section presents two recycling models: non-retailer collection and retailer collection. As mentioned, a manufacturer subcontracts with one third-party firm in a geographical region to engage in the collection of returned and obsolete products. We develop the non-retailer collection model described below as a benchmark case for purposes of comparison.
2.1. Notation
Letcdenote the manufacturer’s unit cost for manufacturing products,wthe unit wholesale price, andpthe unit retail price. The consumer’s demand function for new products in the market is assumed asD(p) =/p, a function of the retail price with/being a positive parameter. Let
s
denote the fraction of current generation product that would be returned, i.e. 06s
61, wheres
can be interpreted as a reverse channel performance. This research assumes that the demand fornew products and the quantity of returned products are in a steady state which is unaffected by time. Therefore, the quantity of return products is (/p)
s
without considering the time factor. In addition, letIdenote the effort of collecting products in retail stores, and useI=CLs
2to transfer the returns to investment, whereCLis a positive scaling parameter. Similar forms have been used in effort response models in the literature (Coughlan, 1993; Savaskan et al., 2004). Letb, a positive param-eter, denote the unit profit of the entity that handles or sells the treated obsolete products in both the retailer and non-re-tailer collection models. For comparative purposes, we deliberately assume an identicalbfor the manufacturer in the non-retailer collection model and the third-party firm in the non-retailer collection model, which implies that the manufacturer or third-party firm acts as the remanufacturer. An identical level of earning profit flowing into a recycling system for handling obsolete products leads to the assumption thatb’s are at the same level in the two models. In addition, a retailer or third-party firm charges consumers returning used computer hardware a unit service fee,A, which is without sign restriction. A retailer or third-party firmchargesorpaysfor collecting recycled items ifAis positive or negative respectively. In cases when recycling operations are economically viable, the profits are positive, i.e.b+A> 0. Letw
denote the contract expense paid by the manufacturer to the third-party firm;w
is a function of the return rate,s
, wherew
=Fs
, withFbeing a total expense whenevers
is equal to one. In this paper, it is reasonable to assume thatFis a decision variable of the manufacturer because the manufacturer determines the contract.2.2. Non-retailer collection model
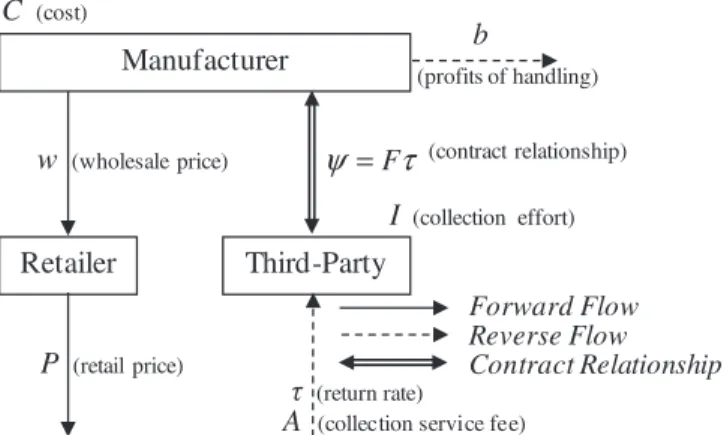
Generally speaking, a third-party firm that cooperates with the manufacturer is usually subcontracted by the manufac-turer for collection work. The conceptual model of the non-retailer collection is depicted inFig. 1. For notational simplicity, we refer to this model as the non-retailer collection model throughout the paper.
This research assumes that the third-party firm decides the product’s return rate,
s
, the retailer decides the retail price,p, in the market, and the manufacturer decides the wholesale price,w. The contract is provided by the manufacturer to the third-party firm, so the contract variable,F, is a decision variable of the manufacturer. Other notations inFig. 1are the same as described in Section2.1. LetPNi denote the profit function for memberiin the non-retailer collection model, where sub-scriptitakes value M, R, or 3P, which denotes the manufacturer, retailer, or third-party firm. The profit functions of the man-ufacturer, retailer, and third-party firm are
P
NM¼ ð/pÞðwcÞ þbs
ð/pÞ Fs
; ð1ÞP
NR¼ ð/pÞðpwÞ; ð2ÞP
N3P¼As
ð/pÞ þFs
CLs
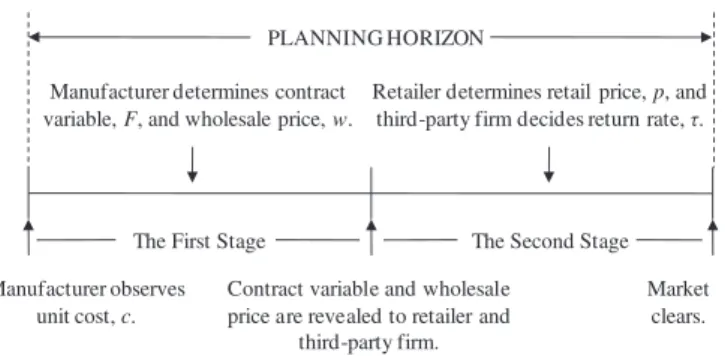
2: ð3ÞThe sequence of decision-making in the non-retailer collection model is depicted inFig. 2. After observing the unit manu-facturing cost, the manufacturer determines the wholesale price,w, and the contract variable,F. Then the retailer decides the retail price,p, and the third-party firm determines the return rate,
s
, simultaneously based on the wholesale price and the contract information revealed by the manufacturer.In practice, the manufacturer, the first mover in the decision timeline, has sufficient bargaining power to act as a Stackel-berg leader. This provides the justification for examining another performance measure, the manufacturer’s profit, since the manufacturer may opt to choose retailer collection or non-retailer collection depending on its profit. When making deci-sions, the manufacturer considers the retailer’s and the third-party firm’s best responses to its decisions. The retailer and the third-party firm making decisions after observing the manufacturer’s decision are the followers. We solve this two-stage sequential game by using backward induction moving from the second stage, retailer and third-party firm’s decisions, to
manufacturer’s decision problem in the first stage. Throughout this paper,stagerefers to the sequence of decision-making andstepto the computational ordering.
2.2.1. Step 1. The retailer’s decision in the second stage
The retailer maximizes its profits from selling new products as shown in(4).
Max p
P
N R¼ ð/pÞðpwÞ: ð4Þ Becaused2PNR dp2 ¼ 2<0;P NR is concave inp. Then(4)is maximized when first-order conditions hold. From the first-order conditions, the retailer sets the retail price as
p¼/þw
2 : ð5Þ
2.2.2. Step 2. The third-party firm’s decision in the second stage
The profits of the third-party firm are the revenue incurred from those recycling services and the contract minus the col-lection effort as shown in(6).
Max s
P
N 3P¼As
ð/p Þ þFs
C Ls
2: ð6ÞFrom the second-order conditions, we haved2PN3P
ds2 ¼ 2CL<0. ThenP3NPis concave in
s
wheneverCL> 0, so(6)is maximized when the first-order conditions hold. Using the first-order conditions to derive the best response to the return rate givess
¼Að/p Þ 2CL þ F 2CL : ð7ÞFor any value ofp, the third-party firm determines the return rate as above. In the second stage, the retailer or the third-party firm solves its problem simultaneously. Then we substitute(5), the optimal retail price, into(7)to obtain the optimal return rate as
s
¼Að/wÞ 4CL þ F 2CL : ð8ÞThe profit function of third-party firm,PN3P, is concave in
s
. In order to ensure that the optimal return rate,s
, is bounded
between zero and one, we impose the condition of@PN3P
@s js¼1<0 on
s
.Assumption 1follows from this condition.Assumption 1. The parameter,CL, defined in the collection effort is assumed to be sufficiently large such that
s
< 1, i.e. 16CL> (b+A)2+ (/+c)(b+A).2.2.3. Step 3. The manufacturer’s decision in the first stage
The manufacturer solves the problem to maximize its total profit, which is the sum of the revenue from selling new and recycled products minus the cost of the contract relationship with the third-party firm.
Max w;F
P
N M¼ ð/p ÞðwcÞ þbs
ð /pÞ Fs
: ð9ÞIn making the decision, the manufacturer considers the retailer’s and the third-party firm’s best responses. Substituting(5) and (8)into the manufacturer’s profit function, the manufacturer’s profit in the non-retailer collection model is
Max w;F
P
N M¼ ð/wÞðwcÞ 2 þ bð/wÞ 2 Að/wÞ 4CL þ F 2CL F Að/wÞ 4CL þ F 2CL : ð10ÞTo ensurePNMis concave inwandF, the Hessian Matrix of(10),
1þbA 4CL ðbAÞ 4CL ðbAÞ 4CL 1 CL " #
, must be negative semi-definite. Then it should satisfy the conditions1þbA
CL<0, 1
CL<0 and 16CL> (b+A)
2. Note thatC
L> 0, thenCL1<0 is trivially satisfied.
Accord-ing to Assumption 1, 16CL> (b+A)2+(/+c)(b+A), and the condition, (b+A)(/+c) > 0, one can easily verify that 16CL> (b+A)2, and it also implies1þbACL<0. Hence, the manufacturer’s profit function,P
N
M, is concave in wandF, so
(10)is maximized when the first-order conditions hold. The partial derivative ofPNMwith respect towandFis
d
P
N M dw ¼ /w 2 wc 2 ðbAÞF 4CL bAð/wÞ 4CL ; ð11Þ dP
NM dF ¼ ðbAÞð/wÞ 4CL F CL : ð12ÞFrom the first-order conditions, the manufacturer decides the wholesale pricewand the contract variableFas
w¼/2CLð/cÞ þFðbAÞ 4CLbA ; ð13Þ and F¼ðbAÞð/w Þ 4 : ð14Þ
Solving the two equations for two unknown variables, the final results ofwandFwhich simultaneously satisfy the first-order conditions are w¼ / 8CLð/cÞ 16CL ðbþAÞ2 ; ð15Þ F ¼2CLð/cÞðbAÞ 16CL ðbþAÞ2 : ð16Þ
Substituting the optimal wholesale pricewand the contact variableFin(10), the manufacturer’s profits are given by
P
N M ¼ 2CLð/cÞ 2 16CL ðbþAÞ2 : ð17ÞThe optimal unit retail price and return rate can be obtained by substitutingwandFinto(5) and (8).
This study also evaluates the total profits of the non-retailer collection model by summing the profits of the manufac-turer, the retailer, and the third-party firm. However, as mentioned, a third-party collection model has been proven ineffec-tive in the design of a closed-loop supply chain (Savaskan et al., 2004). In the next subsection, we integrate the concept that manufacturers may take advantage of the existing retail channel for collection in our proposed model.
2.3. Retailer collection model
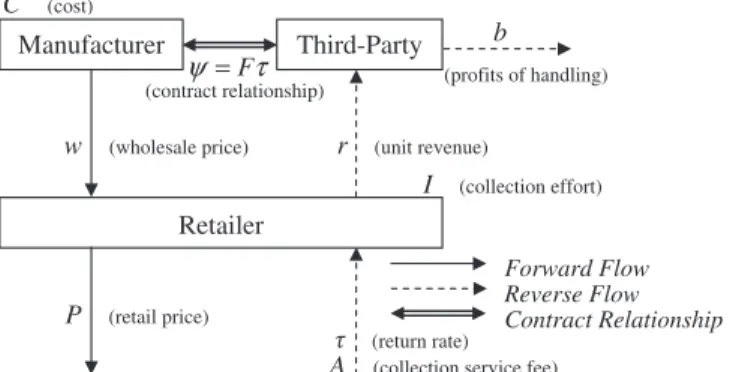
According toSavaskan et al. (2004), a closed-loop supply chain with a retailer engaging in collection produces the best return rate, manufacturer’s profits, and total profits of channel members but, as noted, an electronics consumer products manufacturer typically does not play a role in remanufacturing due to the industry’s outsourcing business model. This sec-tion presents a proposed model where the retailer collects used products while charging a service fee and the manufacturer cooperates with a third-party firm for further handling of the collected items. The proposed model provides a remedy for cases where retailers are incapable of properly handling obsolete e-scrap. For notational simplicity, this research refers to this model as the retailer collection model depicted inFig. 3.
Letrdenote the unit revenue for the retailer from selling a unit of the used products to the third-party firm. Assume that the retailer’s profits from collecting used products are positive so the condition,r+A> 0, holds. Again, the profit function for memberiis denoted byPi, where subscriptitakes valueM,R, or 3P, which denotes the manufacturer, the retailer, or the third-party firm. The profit functions are
P
M¼ ð/pÞðwcÞ Fs
; ð18ÞP
R¼ ð/pÞðpwÞ þs
ðrþAÞð/pÞ CLs
2; ð19ÞThe associated players’ sequence of decision-making in the retailer collection model is depicted inFig. 4. After observing the unit manufacturing cost, the manufacturer determines the wholesale price,w, and the contract variable,F. Then the retailer decides the retail price,p, and the third-party firm determines the return rate,
s
, simultaneously based on the wholesale price and the contract information revealed by the manufacturer.Acting as the first mover, the manufacturer considers the retailer’s and the third-party firm’s best responses when making decisions. The followers, the retailer and the third-party firm, make decisions after observing the manufacturer’s decision. This research applies backward induction to studying this sequential two-stage model moving from the retailer’s and the third-party firm’s decision problems in the second stage to the manufacturer’s decision problem in the first stage.
2.3.1. Step 1. The retailer’s decision in the second stage
The retailer maximizes its profit function,PR, which is the profit from selling new products and recycling units minus the collection effort as shown in(21).
Max
p;s
P
R¼ ð/pÞðpwÞ þs
ðrþAÞð/pÞ CLs
2:
ð21Þ
From the first-order conditions,pand
s
arep¼/þw
s
ðrþAÞ2 ;and ð22Þ
s
¼ð/pÞðrþAÞ2CL
: ð23Þ
Solving the two equations of(22) and (23)for two unknown variables, we obtain the optimal retail pricepand return rate
s
as p¼/ 2CLð/wÞ 4CL ðrþAÞ 2; ð24Þ
s
¼ð/wÞðrþAÞ 4CL ðrþAÞ2 : ð25ÞIntuitively, the return rate,
s
, must be less than one. To ensure this, we assume that the retailer’s profit function is down-ward-sloping ats
= 1, i.e.@PR@s js¼1<0 so that the optimal return rate is located within the area below one.Assumption 2 fol-lows from this condition.
Fig. 3.Electronics industry recycling: retailer collection model.
Assumption 2. ParameterCLdefined in the collection effort is assumed to be sufficiently large such that
s
< 1, i.e. which meansCL>ðrþAÞ2þðrþAÞð /wÞ
4 .
To ensure thatPRis concave inpand
s
, the Hessian Matrix ofPR,2 rA
rA 2CL
, must be negative semi-definite, i.e. 2CL< 0 andCL>ðrþAÞ
2
4 . Note thatCLis positive, so2CL< 0. FromAssumption 2,CL>ðrþAÞ
2
þðrþAÞð/wÞ
4 , and then it follows that
CL>ðrþAÞ
2
4 . Hence, the retailer’s profit function is concave inpand
s
, and then (21)is maximized when the first-order con-ditions hold.2.3.2. Step 2. The third-party firm’s decision in the second stage
The third-party’s profit function, shown in(26)includes the profits from those obsolete products plus the revenue from the contract.
P
3P¼s
ðbrÞð/pÞ þFs
: ð26ÞIn(26)all of these notations in the profit function are given parameters for the third-party firm. In other words, there is no decision variable in this step. Instead of maximizing its profits, the third-party firm must decide whether to accept the man-ufacturer’s contract. The third-party firm would accept the contract when its profits are nonnegative, i.e.P3PP0. Hence, there is a constraint, as shown in(27)about the contract variableFfor any value ofpto ensure that the third-party firm has a nonnegative profit
FPðbrÞð/pÞ: ð27Þ
In the second stage, the third-party firm and the retailer make decisions simultaneously. Substituting(24)into(27), the con-straint of the contract variable is
FP2CLð/wÞðbrÞ
4CL ðrþAÞ2
: ð28Þ
Constraint(28)shows that there exists a lower bound ofFwhich is the decision variable of the manufacturer. It implies that the contract must be incentivized enough for the third-party firm to accept it. From(28)the lower bound ofFis positive wheneverr>b, meaning that if the unit cost of the obsolete products is higher than the unit revenue, the manufacturer pays the third-party firm to help it assume responsibility for the recycling processes. On the contrary, if the third-party firm can receive positive profits from those used products, it has incentives to join this closed-loop supply chain collection program absent any payment from the manufacturer.
2.3.3. Step 3. The manufacturer’s decision in the first stage
The manufacturer decides the wholesale price,w, and the contract,F, to maximize its profits from selling the new prod-ucts minus the cost of contract as
Max
w;F
P
M¼ ð/pÞðwcÞ F
s
: ð29ÞWhen making the decision, the manufacturer considers the retailer’s and the third-party firm’s best responses. Substituting
(24) and (25)into this profit function, the manufacturer’s profit is
Max w;F
P
M¼ 2CLð/wÞðwcÞ 4CL ðrþAÞ2 Fð/wÞðrþAÞ 4CL ðrþAÞ2 : ð30ÞLemma 1. The profit of the manufacturer is maximized when F reaches the lower bound.
The proofs of this and the following propositions and observations are given inAppendix A. Lemma 1simplifies the man-ufacturer’s problem as a single-variable problem. Substituting the lower bound of the contact variable,F, into(30), the man-ufacturer’s profit can be further simplified as
Max w
P
M¼ 2CLð/wÞðwcÞ 4CL ðrþAÞ2 þ2CLð/wÞ 2 ðbrÞðrþAÞ ½4CL ðrþAÞ22 : ð31ÞFrom the first-order conditions, the optimal wholesale price is
w¼/ð/cÞ½4CL ðrþAÞ2
8CL2ðrþAÞðbþAÞ
: ð32Þ
The second-order condition,d2PM
dw2 <0, holds whenever 4CLP(r+A)2+ (r+A)(b-r). Substituting(32)into the constraint of
Assumption 2,CL>ðrþAÞ
2
þðrþAÞð/wÞ
c), are positive, the second-order condition,d2PM
dw2 <0, holds. Hence, the profit function of the manufacturer is concave inw so(31)is maximized when the first-order conditions hold. Finally, the manufacturer’s profit is given by
P
M¼
CLð/cÞ2
8CL2ðrþAÞðbþAÞ
: ð33Þ
The optimal return rate can be found by the substitution ofw, giving
s
¼ ðrþAÞð/cÞ 8CL2ðrþAÞðbþAÞ ¼ 8C ð/cÞ L ðrþAÞ2ðbþAÞ : ð34ÞFrom(33) and (34), the optimal return rate,
s
, and the profits of the manufacturer,PM, positively relate tor. This leads to the result that the manufacturer desires a high return rate.
Proposition 1.The manufacturer wants to provide the third-party firm with a contract that will induce the retailer to increase the return rate.
3. Comparison of the models
This section summarizes the optimal decision variables and profit functions determined by each channel member in the two closed-loop supply chain models for comparative purposes, and conducts a sensitivity analysis to investigate how the changes in parameters affect the return rate and manufacturer’s profit in the retailer collection and non-retailer collection models. We then study a case whereby a third-party firm in the retailer collection model is a non-profit organization that considers the fund balance between unit cost and unit revenue instead of the profit-maximization objective.
3.1. Performance comparison
A rational channel member would like to maximize its profits, but a channel structure designer, for example, the govern-ment, may focus on the return rate and total profits of a closed-loop supply chain. Based on the results summarized inTable 1, some interesting observations can be made about performance.
Observation 1. The optimal return rate in the retailer collection model,
s
, is greater than the optimal return rate in thenon-retailer collection model,
s
N, whenever the condition 32CL(r+A)16CL(b+A) + 2(r+A)(b+A)2> 0 holds.
Observation 2. The optimal profits of the manufacturer in the retailer collection model are greater than the profits in the non-retailer collection, i.e.PM>PNM, whenever the condition 4(r+A) > (b+A) holds.
3.2. Numerical investigation
This research undertakes numerical studies that examine the return rates and manufacturer’s profits by adjusting param-etersCL,A,r, andb. We first study how the collection effort parameter,CL, would affect the return rate and the manufacturer’s profits. In particular, unless explicitly mentioned, we give the parameters shown inTable 2, whereCNL denotes the collection effort parameter in the non-retailer collection model. We investigate the ratios of the return rate and the manufacturer’s profits in the retailer collection model to the performance measures in the non-retailer collection model. The value of
col-Table 1
Analytical results of the two models.
Non-retailer collection model Retailer collection model
Total profits 3CLð/cÞ2 16CLðbþAÞ2þ 2CLð/cÞ2ðbþAÞ2 ½16CLðbþAÞ22 3CLð/cÞ2 16CL4ðrþAÞðbþAÞþ 4CLð/cÞ2ðbrÞðrþAÞ ½16CL4ðrþAÞðbþAÞ2 Profits of manufacturer 2CLð/cÞ2 16CLðbþAÞ2 2CLð/cÞ2 16CL4ðrþAÞðbþAÞ Profits of retailer 16C2 Lð/cÞ2 ½16CLðbþAÞ22 4CLð/cÞ2½4C LðrþAÞ2 ½16CL4ðrþAÞðbþAÞ2 Profits of third-party firm CLð/cÞ2ðbþAÞ2 ½16CLðbþAÞ22 0 Retail price / 4CLð/cÞ 16CLðbþAÞ2 / 4CLð/cÞ 16CL4ðrþAÞðbþAÞ Wholesale price / 8CLð/cÞ 16CLðbþAÞ2 /2ð/cÞ½4CLðrþAÞ 2 16CL4ðrþAÞðbþAÞ Return rate ð/cÞðbþAÞ 16CLðbþAÞ2 2ð/cÞðrþAÞ 16CL4ðrþAÞðbþAÞ Contract variable 2CLð/cÞðbAÞ 16CLðbþAÞ2 4CLð/cÞðbrÞ 16CL4ðrþAÞðbþAÞ
lection effort parameter,CL, in the retailer collection model varies from 180 to 580, which is 0.9–2.9 times ofCNL, whileC N L remains the same in the non-retailer collection model. The results are given inFig. 5.
InFig. 5, a ratio greater than one indicates that the performance measure in the retailer collection model is higher than in the non-retailer collection model. The collection effort,I=CL
s
2, is the cost paid by the associated party that engages in col-lection. An increase inCLimplies that it is more costly to increase the return rate in the reverse channel. As the collection effort in the retailer collection model,CL, increases, both the return rate and the manufacturer’s profits in the retailer collec-tion model decrease. The retailer colleccollec-tion model shows that the manufacturer’s profits remain superior over the non-re-tailer collection model within the examined range ofCL=CNL.This section also numerically examines how the collection service fee,A, and the unit payment from the third-party firm to the retailer in the retailer collection model,r, jointly affect the performance measures. In particular, unless explicitly men-tioned, we give the parameters as shown inTable 3. We vary the collection service fee,A, from five to zero and the payment from the third-party firm to the retailer,r, from5 to 50.
Fig. 6demonstrates the regions ofAandrvalues for which the return rate and manufacturer’s profits differ between the models. The retailer collection model performs better than the non-retailer collection model asrandAboth increase prob-ably because in the retailer collection model the retailer has greater incentives to collect obsolete products with a higher service fee or a higher unit payment from the third-party firm. On the other hand, ifrandAare low, the retailer collection model may not produce the desired outcomes for return rate and manufacturer’s profits.
Table 2
Parameters in sensitivity analysis ofCL. CN L / c A b r 200 40 10 5 15 15 Model Collection Retailer -Non in Rate Return Model Collection Retailer in Rate Return Model Collection Retailer -Non in Profits s er' Manufactur Model Collection Retailer in Profits s er' Manufactur N L L C C
Fig. 5.Return rate and manufacturer’s profits as functions ofCL.
Table 3
Parameters in sensitivity analysis ofrandA.
CL / c b 500 40 10 15 -5 5 15 25 35 45 5 4 3 2 1 0A r Return Rate
Retailer Collection is higher
Non-Retailer Collection is higher -5 5 15 25 35 45 5 4 3 2 1 0A r Manufacturer's Profits
Retailer Collection is higher
Non-Retailer Collection is higher
This section numerically studies how the unit revenue,b, and cost,r, of handling returned products would jointly affect the performance measures in the models. Again, unless explicitly mentioned we give the parameters as shown inTable 4. We varybfrom 10 to 15 andrfrom5 to 50.
Fig. 7demonstrates the regions ofbandrvalues for which the return rate and manufacturer’s profits differ between the models. The retailer collection model outperforms the non-retailer collection model in most ofbandrinvestigated in this paper.
3.3. A special case: non-profit third-party
Some non-governmental organizations (NGOs) collect and dispose of used and obsolete products. For instance, in Swit-zerland in 2007, four non-profit organizations manage the financing, collection, transportation, and control systems for the electronics industry (Khetriwal et al., 2009). In addition, an empirical study (Kumar and Malegeant, 2006) indicates that a strategic alliance between a manufacturer and a non-profit organization in the collection process of a closed-loop supply chain is a beneficial strategy for the manufacturer. Typically, it is reasonable to assume that NGOs are non-profit organiza-tions and third-party firms may be acting as non-profit organizaorganiza-tions such as in the Swiss case. Hence, a third-party firm would not seek profit-maximization, but instead considers a fund balance between the revenue and cost incurred in recy-cling operations. Under this framework, optimal return rate, manufacturer’s profits, and total profits in the retailer collection model can be obtained by substitutingr=binto the results of the retailer collection model inTable 1, which gives
s
¼ 2ð/cÞðbþAÞ 16CL4ðbþAÞ2 ;P
M¼ 2CLð/cÞ 16CL4ðbþAÞ2 ;P
T¼ 3CLð/cÞ 2 16CL4ðbþAÞ2 :Proposition 2.When a third-party firm is acting as a non-profit organization,
(i)Thereturn rate in the retailer collection model is higher than that in the non-retailer collection model.
(ii) Theretailer collection model outperforms the non-retailer collection model with respect to the manufacturer’s profits. (iii) Theretailer collection model outperforms the non-retailer collection model with respect to the total profits of channel
members.
The implication ofProposition 2is that if a third-party firm is acting as a non-profit organization, the proposed retailer collection model outperforms the non-retailer collection model with respect to the return rate, manufacturer’s profits and total profits. This analytical result concurs with the empirical study of (Kumar and Malegeant, 2006) and provides a useful policy implication: society (or government) has greater incentives to encourage non-profit organizations to engage in recy-cling operations, which ultimately enhances the benefits of all channel members in a closed-loop supply chain.
Table 4
Parameters in sensitivity analysis ofrandb.
CL / c A 500 40 10 5 -5 5 15 25 35 45 10 11 12 13 14 15 b r Return Rate
Retailer Collection is higher
Non-Retailer Collection is higher
-5 5 15 25 35 45 10 11 12 13 14 15 b r Manufacturer's Profits
Retailer Collection is higher
Non-Retailer Collection is higher
4. Conclusions and future research
An efficient and effective channel design for closed-loop supply chains can reduce the costs of recycling operations and enhance the benefits of channel members, regulatory bodies, and the market. This paper describes the current recycling practice in the global electronics industry, where the manufacturer subcontracts to a third-party firm for collection of used products. However, the literature indicates that a third-party firm collection model may not be an efficient way to perform collection for a general industry. The manufacturer may take advantage of the existing retail channel to help collect e-scrap from customers. This research develops a retailer collection model where the retailer collects used products and the ufacturer contracts with a third-party firm to further handle the e-scrap. In the proposed retailer collection model, the man-ufacturer’s contract incents the retailer to increase the return rate of e-scrap.
By using the non-retailer collection model to establish benchmarks, we show that the retailer collection model’s perfor-mance is superior to the non-retailer collection model under some conditions. We also consider that the third-party firm in the retailer collection model is a non-profit organization where the unit cost is equal to the unit revenue. In this case, the retailer collection model is superior with respect to the return rate, the manufacturer’s profits, and the total profits of all channel members in a closed-loop supply chain.
The contributions of this paper to the literature are twofold: (i) the proposed retailer collection model captures the reality that electronics manufacturers of consumer products typically are not remanufacturers, a situation which hampers the de-sign of closed-loop supply chains proposed in the earlier literature, and (ii) if a third-party firm acts as a non-profit organi-zation, the proposed retailer collection model outperforms the non-retailer collection model for the return rate, manufacturer’s profits and total profits, an analytic result which concurs with earlier empirical studies.
Three extensions to our modeling framework are worth investigation. First, since we use a simple linear contract with used products’ return rate as our contractual relationship between the manufacturer and the third-party firm, other con-tracts, i.e. revenue sharing and incentive mechanism, might give additional insights. Second the case whereby competition may occur when both retailers and third-party firms in a recycling channel collect e-scrap merits study. Third, since in prac-tice a manufacturer will likely face multiple retailers and third-party firms, this issue also requires more study.
Acknowledgments
The authors thank the reviewers and the editor-in-chief for their helpful and valuable comments. This research is sup-ported in part by the National Science Council, Taiwan under Grants NSC97-2221-E-002-263-MY3 and NSC99-2221-E-002-151-MY3.
Appendix A
Proof of Lemma 1. LetFdenote the lower bound ofF. Assume that there exists aF’ =F+
e
wheree
> 0, such that the profits of the manufacturer are maximized, i.e.PM(F0) >PM(F), wherePM() is the manufacturer’s profits that is a function of the contract variable. Then we have an inequality,ð4/CwÞðrþAÞLðrþAÞ2
e
>0. Assumptions 2 and the condition, (/w) > 0, contradict thisinequality. Hence, the manufacturer’s profits are maximized while the contract variable,F, reaches its lower bound. h
Proof of Proposition 1. FromLemma 1, the optimal contract variable,F, which reaches its lower bound, CLð/cÞðrbÞ
4CLðrþAÞðbþAÞ, is a
function ofr. Moreover, the optimal return rate,
s
¼ ðrþAÞð/cÞ8CL2ðrþAÞðbþAÞ, is also a function ofr. The manufacturer could controlr
indirectly by offering the third-party firm an appropriate contract so that it can affect the retailer’s decision, the return rate,
s
. Furthermore, the profits of the manufacturer,PM, positively relate to the return rate,s
. To maximize its profits, the man-ufacturer would determine an appropriate contract to induce the retailer to increase the return rate,s
. hProof of Observation 1. The condition, 32CL(r+A)16CL(b+A) + 2(r+A)(b+A)2> 0, can be written asr>168CCLþðLðbbþþAAÞÞ2A.
Note that in the retailer collection model, the retailer’s profits from collecting obsolete products are
s
(r+A)(/p). In the non-retailer collection model, the third-party firm earnsAs
(/p) +Fs
from returned products. In the retailer collec-tion model, the retailer’s profits from colleccollec-tion work would be increased when the third-party firm provides more payment to the retailer for the returned products. Therefore, the retailer would determine the return rate which is higher than the return rate in the non-retailer collection model whenris large enough. More specifically,r> 8CLðbþAÞ16CLþðbþAÞ2A. h
Proof of Observation 2. FromTable 1, we observe that the manufacturer’s profits in the retailer collection model increase withr. The manufacturer’s profits in the retailer collection model would be greater than in the non-retailer collection model wheneverr>bþA
4 A. In the retailer collection model, when the retailer’s unit revenue from returned products,r, increases, it gives the retailer incentives to increase the quantity of recycled products. The quantity of recycled products,
s
(/p),positively relates to the return rate and the market demand for new products. The manufacturer’s profits also positively relate to the market demand. Then in the retailer collection model, the manufacturer can earn more profits with more recycled products asrincreases. Therefore, whenris large enough, i.e.r>bþA
4 A, the manufacturer’s profits in the retailer collection model would be higher than its profits in the non-retailer collection model. h
Proof of Proposition 2.(i) As r=b, the condition, 32CL(r+A)16CL(b+A) + 2(r+A)(b+A)2> 0, in Observation 1 can be rewritten as 16CL+ 2(b+A)2> 0. It is trivial to show that 16CL+ 2(b+A)2is greater than zero becauseCLand (b+A)2are both positive and it completes the proof.(ii) Because the condition in Observation 2, 4(r+A) > (b+A), holds wheneverris equal to
b, this trivially follows.(iii) We compute the difference in total profits difference between the models. The total profits in the retailer collection model are greater than the profits in the non-retailer collection model when the condition 112CL(b+A)2> 0 holds. From Assumption 2, 4CL(b+A)2> 0 wheneverr=b, so the condition, 112CL(b+A)2> 0, holds and it completes the proof. h
References
Acer, 2008. European Nations’ Recycling Channels. <http://global.Acer.com/about/sustainability34.htm> (accessed 10.06.09).
Arena, U., Mastellone, M.L., Perugini, F., 2003. Life cycle assessment of a plastic packaging recycling system. International Journal of Life Cycle Assessment 8 (2), 92–98.
Azevedo, S.G., Carvalho, H., Machado, V., 2011. The influence of green practices on supply chain performance: A case study approach. Transportation Research Part E 47, 850–871.
Chen, Y.J., Sheu, J.-B., 2009. Environmental-regulation pricing strategies for green supply chain management. Transportation Research Part E 45, 667–677. Chung, C.-J., Wee, H.-M., 2008. Green-component life-cycle value on design and reverse manufacturing in semi-closed supply chain. International Journal of
Production Economics 113, 528–545.
Chung, C.-J., Wee, H.-M., 2010. Green-product-design value and information-technology investment on replenishment model with remanufacturing. International Journal of Computer Integrated Manufacturing 23 (5), 466–485.
Chung, C.-J., Wee, H.-M., 2011. Short life-cycle deteriorating product remanufacturing in a green supply chain inventory control system. International Journal of Production Economics 129, 195–203.
Chung, S.-L., Wee, H.-M., Yang, P.-C., 2008. Optimal policy for a closed-loop supply chain inventory system with remanufacturing. Mathematical and Computer Modelling 48, 867–881.
Coughlan, A.T., 1993. Salesforce compensation: a review of MS/OR advances. In: Eliashberg, J., Lilien, G. (Eds.), Handbooks in Operations Research and Management Science, Marketing, vol. 5. North-Holland, Amsterdam, pp. 611–651.
Dell, 2008a. Dell Corporate Responsibility Report Fiscal Year 2008. <http://www.dell.com/downloads/global/corporate/environ/report08.pdf> (accessed 10.06.09).
Dell, 2008b. Dell-Recycling. <http://www1.euro.dell.com/content/topics/topic.aspx/emea/topics/services/recycle> (accessed 10.06.09).
Fleischmann, M., Krikke, H.R., Dekker, R., Flapper, S.D.P., 2000. A characterization of logistics networks for product recovery. Omega – International Journal of Management Science 28, 653–666.
GENCO, 2008. Electronics Industry Profile. <http://www.genco.com/Industry-Profiles/electronics.php> (accessed 10.06.09).
Giannoccaro, I., Pontrandolfo, P., 2004. Supply chain coordination by revenue sharing contracts. International Journal of Production Economics 89, 131–139. Guide, V.D.R., Van Wassenhove, L.N., 2009. The evolution of closed-loop supply chain research. Operations Research 57 (1), 10–18.
Guide, V.D.R., Harrison, T.P., Van Wassenhove, L.N., 2003. The challenge of closed-loop supply chains. Interfaces 33 (6), 3–6.
Hong, I.-H., Assavapokee, T., Ammons, J., Boelkins, C., Gilliam, K., Oudit, D., Realff, M., Vannicola, J.M., 2006. Planning the e-scrap reverse production system under uncertainty in the state of Georgia: a case study. IEEE Transactions on Electronics Packaging Manufacturing 29 (3), 150–162.
Hong, I.-H., Ammons, J.C., Realff, M.J., 2008. Decentralized decision-making and protocol design for recycled material flows. International Journal of Production Economics 116, 325–337.
Hewlett-Packard (HP), 2008a. Product Reuse and Recycling. <http://www.hp.com/hpinfo/globalcitizenship/gcreport/productreuse.html> (accessed 10.06.09).
Hewlett-Packard (HP), 2008b. HP Hardware Return & Recycling Program. <http://h41111.www4.hp.com/globalcitizenship/uk/en/environment/recycle/ hardware.html> (accessed 10.06.09).
Integrated Waste Management Board, California (IWMB), 2003. Electronic Waste Recycling Act of 2003. <http://www.ciwmb.ca.gov/electronics/act2003/> (accessed 10.06.09).
Jenkins, R.R., Martinez, S.A., Palmer, K., Podolsky, M.J., 2003. The determinants of household recycling: a material-specific analysis of recycling program features and unit pricing. Journal of Environmental Economics and Management 45, 294–318.
Khetriwal, D.S., Kraeuchi, P., Widmer, R., 2009. Producer responsibility for e-waste management: key issues for consideration – learning from the Swiss experience. Journal of Environmental Management 90, 153–165.
Krumwiede, D.W., Sheu, C., 2002. A model for reverse logistics entry by third-party providers. The International Journal of Management Science 30, 325– 333.
Kumar, S., Malegeant, P., 2006. Strategic alliance in a closed-loop supply chain, a case of manufacturer and eco-non-profit organization. Technovation 26, 1127–1135.
Meade, L., Sarkis, J., 2002. A conceptual model for selecting and evaluating third-party reverse logistics providers. Supply Chain Management 7 (5), 283–295. Maine Revised Statutes (MRS), 2008. Electronic Waste. <http://www.mainelegislature.org/legis/statutes/38/title38sec1610.html> (accessed 20.05.09). Nagurney, A., Toyasaki, F., 2005. Reverse supply chain management and electronic waste recycling-a multitiered network equilibrium framework for
e-cycling. Transportation Research Part E 41, 1–28.
Östlin, J., Sundin, E., Björkman, M., 2008. Importance of closed-loop supply chain relationships for product remanufacturing. International Journal of Production Economics 115, 336–348.
Pati, R.K., Vart, P., Kumar, P., 2006. Economics analysis of paper recycling vis-à-vis wood as raw material. International Journal of Production Economics 103, 489–508.
Pati, R.K., Vart, P., Kumar, P., 2008. A goal programming model for paper recycling system. The International Journal of Management Science 36, 405–417. Pishvaee, M.S., Rabbani, M., Torabi, S.A., 2011. A robust optimization approach to closed-loop supply chain network design under uncertainty. Applied
Mathematical Modelling 35, 637–649.
Pochampally, K.K., Gupta, S.M., 2003. A multi-phase mathematical programming approach to strategic planning of an efficient reverse supply chain network. In: Proceedings of the 2003 IEEE International Symposium on the Electronics and the Environment. Boston, MA, pp. 72–78.
Realff, M.J., Ammons, J.C., Newton, D.J., 2004. Robust reverse production system design for carpet recycling. IIE Transactions 36, 767–776. RoHS, 2003. RoHS Directive. <http://eur-lex.europa.eu/LexUriServ/LexUriServ.do?uri=OJ:L:2003:037:0019:0023:EN:PDF> (accessed 10.06.09).
Sarkis, J., 2003. A strategic decision framework for green supply chain management. Journal of Cleaner Production 11, 397–409.
Savaskan, R.C., Bhattacharya, S., Wassenhove, L.N.V., 2004. Closed-loop supply chain models with product remanufacturing. Management Science 50 (2), 239–252.
Schultmann, F., Zumkeller, M., Rentz, O., 2006. Modeling reverse logistic tasks within closed-loop supply chains: an example from the automotive industry. European Journal of Operational Research 171, 1033–1050.
Shi, J., Zhang, G., Sha, J., 2011. Optimal production planning for a multi-product closed loop system with uncertain demand and return. Computers & Operations Research 38, 641–650.
Siddique, R., Khatib, J., Kaur, I., 2008. Use of recycled plastic in concrete: a review. Waste Management 28, 1835–1852. Silicon Valley Toxics Coalition (SVTC), 2009. Our Work. <http://www.etoxics.org/svtc_work> (accessed 10.06.09).
Taylor, T.A., 2001. Channel coordination under price protection, midlife returns, and end-of-life returns in dynamic markets. Management Science 47 (9), 1220–1234.
Vlachos, D., Georgiadis, P., Iakovou, E., 2007. A system dynamics model for dynamic capacity planning of remanufacturing in closed-loop supply chains. Computers & Operations Research 34, 367–394.
Wee, H.-M., Lee, M.-C., Yu, J.C.P., Wang, C.E., 2011. Optimal replenishment policy for a deteriorating green product: life cycle costing analysis. International Journal of Production Economics 133, 603–611.