2013
Cognitive fingerprint authentication system
Kuan-Hsing Ho
Iowa State University
Follow this and additional works at:
https://lib.dr.iastate.edu/etd
Part of the
Computer Engineering Commons
This Thesis is brought to you for free and open access by the Iowa State University Capstones, Theses and Dissertations at Iowa State University Digital Repository. It has been accepted for inclusion in Graduate Theses and Dissertations by an authorized administrator of Iowa State University Digital Repository. For more information, please [email protected].
Recommended Citation
Ho, Kuan-Hsing, "Cognitive fingerprint authentication system" (2013).Graduate Theses and Dissertations. 16086.
A thesis submitted to the graduate faculty
in partial fulfillment of the requirements for the degree of MASTER OF SCIENCE
Major: Computer Engineering
Program of Study Committee: J. Morris Chang, Major Professor
Chris Chong-Nuen Chu Stephen B. Gilbert
Iowa State University Ames, Iowa
2013
TABLE OF CONTENTS LIST OF TABLES . . . iv LIST OF FIGURES . . . v ACKNOWLEDGEMENTS . . . vi ABSTRACT . . . vii CHAPTER 1. INTRODUCTION . . . 1
CHAPTER 2. RELATED WORK . . . 4
2.1 Overview . . . 4
2.2 Feature Metrics . . . 5
2.3 Error Rates . . . 6
CHAPTER 3. ACTIVE COGNITIVE BIOMETRIC AUTHENTICATION SYSTEM . . . 8
3.1 Feature Extraction . . . 8
3.1.1 N-graph Vector vs Cognitive Fingerprints . . . 8
3.1.2 Cognition Behavioral Biometric Trade-off . . . 10
3.1.3 Subword Searching Algorithm . . . 11
3.2 Data Normalization . . . 14
3.3 Pattern Recognition Technique: Support Vectors Machine . . . 15
3.3.1 Training Phase . . . 16
3.3.2 Testing Phase . . . 16
3.4 Evaluation Approach: K Fold Cross-validation . . . 17
4.3 Development Environment and Experiment Interface . . . 23
CHAPTER 5. EXPERIMENT RESULTS . . . 24
5.1 Feature Comparison . . . 24
5.1.1 Cognitive Fingerprint Representation Study . . . 24
5.1.2 26x26 Feature Vector vs Cognitive Fingerprint . . . 26
5.2 Method Comparison . . . 27
5.2.1 SVM Performance of Different Class . . . 27
5.2.2 Performance Comparison with Distance-Based Approaches . . . 28
5.3 Performance Comparison With/Without Subword Searching Algorithm . . . . 31
5.4 Large Scale Experiment and Reliability of SVM Models Test . . . 32
5.5 Discussion . . . 34
5.5.1 Choosing Number of Sample Size as Cognition Fingerprints . . . 34
5.5.2 Weight Optimization for Weighted SVM . . . 35
CHAPTER 6. CONCLUSIONS . . . 38
LIST OF TABLES
Table 4.1 Statistic Subjects Report . . . 22
Table 4.2 Development Environment . . . 23
Table 5.1 Cognitive Feature Representation Comparison Summary . . . 26
Table 5.2 26x26 Feature Vector vs Cognitive Fingerprint . . . 27
Table 5.3 SVM Performance Comparison in Different Class . . . 29
Table 5.4 Comparisons of Weighted SVM and Distance-based Techniques . . . . 31
Table 5.5 Models Size With and Without Subword Searching Algorithm Per User 32 Table 5.6 Reliability Experiment Result . . . 34
LIST OF FIGURES
Figure 2.1 Keystroke Feature Metrics . . . 6
Figure 2.2 Keystroke Feature Metrics . . . 7
Figure 3.1 Overall System Architecture . . . 9
Figure 3.2 Digraph: ”re” and ”in” . . . 10
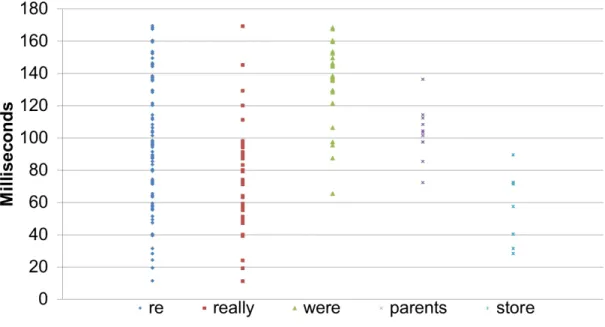
Figure 3.3 Digraph ”re” in Different Words . . . 11
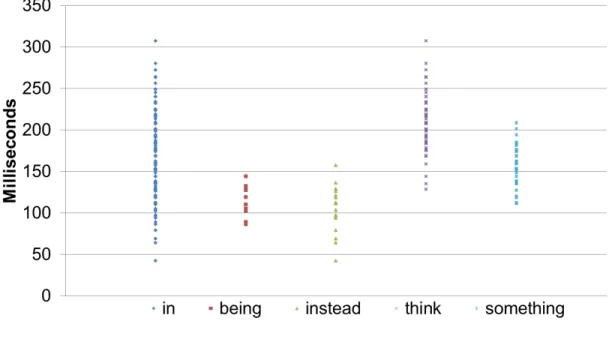
Figure 3.4 Digraphs ”in” in Different Words . . . 12
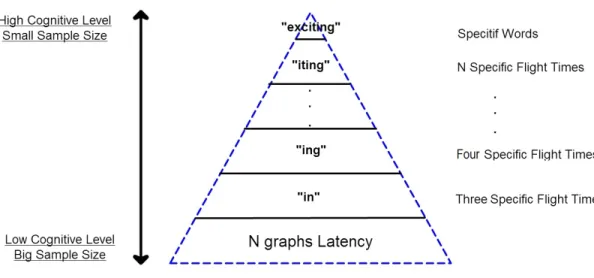
Figure 3.5 Cognitive Level Versus Sample Size . . . 13
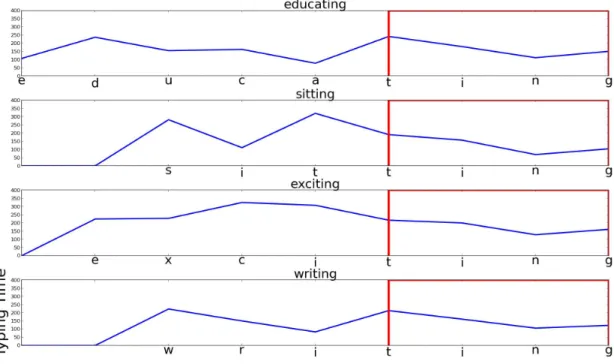
Figure 3.6 Different Words Share the Same Subword ”ting” Information. . . 14
Figure 3.7 Subword Searching Algorithm . . . 19
Figure 3.8 Two Class SVM Decision Boundary . . . 20
Figure 5.1 Feature Representation Example . . . 25
Figure 5.2 One class SVM . . . 28
Figure 5.3 Multi-class SVM . . . 28
Figure 5.4 Performance With/Without Subword Searching Algorithm . . . 32
Figure 5.5 Large Scale Experiment Design . . . 33
Figure 5.6 Reliability SVM Models Experiment Design . . . 34
Figure 5.7 DET For Choosing Number of Sample Size . . . 35
ACKNOWLEDGEMENTS
I would like to take the opportunity to express my gratitude toward those who helped me with various aspects of conducting research and the writing of this thesis during my graduate education. I am most appreciative of Dr. Change and all the members of our DARPA team. With their guidance, patience and support throughout this research, we could finally be able to improve our research into the next level. I would also like to thank to my family for the unconditional love and support in completing my graduate education.
The Internet is becoming an integral part of nearly every aspect of our lives, protecting the identity and personal privacy is crucial for any web organizations. Unfortunately, although tech-nologies such as cognitive-based user authentication systems toward the adoption of stronger and more secure authentication schemes have proven superiority over the traditional ones, traditional authentication systems such as username/password are still dominate in computer security systems since cognitive-based authentication systems require sophisticated equipments. On the other hand, traditional authentication systems couldn’t continuously monitor users after initial login. In this regard, we propose a novel cognitive keystroke authentication that could integrate in the general environment without additional equipment. The proposed system in-troduces a novel feature extraction algorithm as the cognitive fingerprint, so-called Subword. Our approach combine Subword Searching Algorithm with Weighted Support Vector Machine (WSVM) and Fusion Algorithm to discriminate between impostors and legitimate users with a high success rate. This scheme will continuously monitor the typing behavior of a user and will determine if the current user is still the genuine one or not in the background. Large scale experiment with 800 participants at Iowa State University gives evidence that our approach is feasible in practice, in terms of ease of use, improved security, and performance. The experi-mental results show that our system can achieve 1.4 percent Equal Error Rate (EER), which demonstrates the systems effectiveness as a new authentication mechanism. Our study define a new feature extraction approach in keystroke dynamics, and we hope our work will inspire researchers looking for another good feature for authentication in keystroke dynamics.
CHAPTER 1. INTRODUCTION
With organizations like Defense Advanced Research Projects Agency (DARPA) report-edly looking for new ways to improve their password security systems, new authentication ap-proaches are needed to provide a sufficient level of enhancement. Nowadays, although a number of devices and method exist, password is the most widely used authentication mechanism in the computer security domain. All knowledge-based authentication systems have a major problem in identifying unknown users because the system can only ensure that the attempted user who possesses the right information; however, intruders who get the right information can become a potential security threat for the information resources.
In our research, we introduce a novel authentication system of capturing the cognitive finger-prints as biometrics from keystroke dynamics. Cognitive processing time refers to the cognitive characteristics of the person, which is influenced by experiences, knowledge and other individ-ual factors. In keystroke dynamic, the cognitive processing time perform as a rhythm when you try to type a specific alphabet combination, which may represent as words or subwords. By capturing the cognitive processing time, extracted from keystroke dynamics, we can use it in the active authentication system. Since cognitive fingerprint is unique to each individual, as something a user is instead of something a user has, so unlike knowledge-based authentication mechanisms that passwords can be stolen or forgotten, cognitive fingerprints don’t have the earlier-mentioned concerns. In other words, cognitive fingerprints show the unique traits of a user, it is hard to mimic and will never be forgotten.
Biometric techniques have emerged as the proprietary choice for identity verification. Re-searching of various authentication techniques, such as fingerprints, face etc., have been devel-oped to verify the user at an entry point of an authentication system. They often require too high cost for users to enroll, the requirement for sophisticated and expensive equipment, lack
we have not grown from the limitations that traditional biometric methods have. Since the keystroke dynamics approach is purely software-based, it does not require the installation of additional hardware sensors and can be even used over the standard office environment with less expensive and be effective in large scale deployments.
Based on the increasing need for continual authentication measurement in security systems. Conventional authentication methods only identify a user during initial login. Moreover, as long as the session remains active, conventional methods have no mechanisms to verify that the user originally authenticated the user is still in control of the system. Thus, unauthorized individuals may improperly obtain important information. An authentication system requires to address this problem by developing novel ways of validating the identity of the user as long as session is active. We are motivated to pursue a goal of active authentication to reinforce the current authentication constraints. Our ultimate goal of the system should perform verification continuously during the session and is not limited only to login time. Move importantly, the technologies we developed will be able to work invisibly, so users don’t require to re-authenticate again, which is an ideal scenario for the real world.
In this paper, we present a cognitive-based active authentication system. This system continuously monitors and analyzes various keyboard behaviors performed by the users. We extract the features from keystroke dynamics that contain cognitive factors, resulting in cog-nitive fingerprints. This method is driven by our hypothesis that the cogcog-nitive processing time performs as biometrics have been largely ignored in the keystroke dynamics studies of the past three decades. We suggest that with the cognitive active authentication useful within com-puter security as an aid to intrusion detection and as an alternative or complementary way to authenticate users.
The paper is organized as follows: In Section 2, we present a survey of previous research using keystroke latency and define some basic concepts that will be used in this paper. Section 3 presents our methodology and approach, having components for data selection and extraction
methods, evaluation approach, classification and identification strategies. Specially, we propose a novelty authentication model: Subword Searching Algorithm with Weighted Support Machine Vector. In Section 4, we describe our experiment environment and procedure, and a statistic subject report will also be presented in this section. In section 5, we will apply the techniques from Section 3 to experimental data and present the results from a large scale experiment at Iowa State University. Finally, Section 6 will conclude the paper and present our goals for future research.
CHAPTER 2. RELATED WORK
2.1 Overview
M. Karnan , M. Akila, N. Krishnaraj (2010) provided a comprehensive survey on biometric authentication using keystroke dynamics. This survey paper classified research papers based on their features extraction methods, feature subset selection methods and classification methods. Most of the systems described in this survey were based on typing rhythm of short simple texts, which is dominated by the physical characteristics of users. However, in this research, we plan to capture those time intervals caused by cognitive fingerprints from general access to Cyber systems.
Most of studies based on fix text entry as research goal. Their experiment often requests users to type a specific line of text. LikePin Shen Teh, Shigang Yue, and Andrew B.J. Teoh
(2012), users are requested to type a predefine line of text ”the brown fox” for many consecutive times without typing error. In such a scenario, While it is clear that this method more closely mimics typical username/password systems that authenticate users at the entry because users will not be able to type their pre-determined text repeatedly in real environment; otherwise, users would be too disruptive. F. Monrose, M.K. Reiter, S. Wetzel (1999) examined the use of keystroke duration and latency between keystrokes, and combined them with the users password. The work is called Biopassword in the keystroke commercial market. However, there are some limitations regarding this work. First, different people could have different familiarity with a single password string, so the results of the experiment may not be able to display their normal typing behavior. Second, without any error correction, the experiment performed poorly.
Disorder (DoD) to cope with the time variation issues. It argued that while the keystroke typing durations usually vary between each sample, the order of the timing tends to be consistent. It suggested that the distance of the order between two keystroke patterns can be used to measure the similarity. Gunetti, D. and Picardi, C. (2005) extended the idea of Degree of Disorder to compare the typing patterns of n-graphs. In their scheme (called GP method), each user maintains multiple typing patterns. The query sample is compared against all patterns of each user. While it improved the accuracy of False Rejection Rate (FRR) and False Acceptance Rate (FAR) greatly, it is not scalable since the computational cost grows significantly with respect to the number of users. It is not practical in real world experiments. Instead of focusing on the distance measurement, we focus on more sophisticated and well-known machine learning algorithm, called Support Vectors Machine. SVM not only improves accuracy but also suitable for deployment in large scale systems.
We focus on the new features introduced by cognitive factors. We also propose to use Sub-word Searching Algorithm for feature selection to remove irrelevant features. Although accord-ing toHeather Crawford (2010) showing that fix text authentication systems are significantly easier to implement and provide much more acceptable error rates, our active authentication system, which is based on the concept of true dynamic text entry fromGunetti, D. and Picardi, C. (2005) that allow users to type any text they wish, still maintain high accuracy in real world environments.
2.2 Feature Metrics
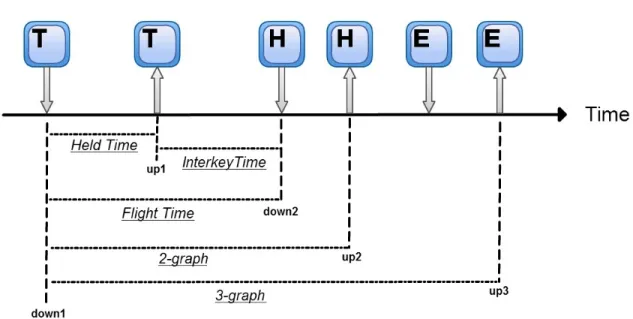
There are a number of measurements are generally used to characterize a users keystroke typing behaviors in keystroke analysis literatures like Heather Crawford (2010) and Pin Shen Teh, Shigang Yue, and Andrew B.J. Teoh (2012). These measurements can be extracted and define in terms as follow in Figure2.1:
Held Time: Held time is measured by the time between a key down to that key up in milliseconds.
Figure 2.1 Keystroke Feature Metrics
Interkey Time: Interkey time is measured by the time between first key up to the next key down in milliseconds.
Interkey time=down2−up1. (2.2)
Flight Time: Flight time is measured by the time between first key down to next key down in milliseconds.
F light T ime=down2−down1. (2.3)
N-graph: Latency is measured by the time between first key down to nth key up in milliseconds.
N −graph =upn−down1. (2.4)
2.3 Error Rates
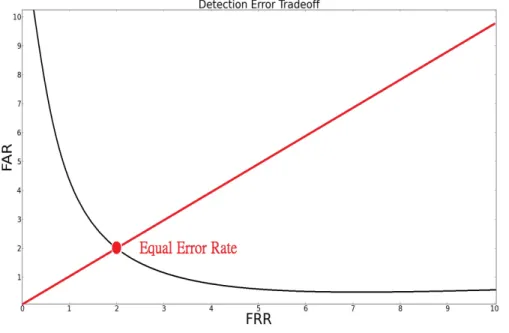
The most commonly used metrics to evaluate a security system performance are the false rejection rate (FRR) and the false acceptance rate (FAR). The false rejection rate (FRR) means the probability that the system rejects a legitimate user, and false acceptance rate (FAR) typically is stated as the ratio of the number of false acceptances divided by the number of identification attempts. FAR and FRR are variable and depend on the sensitivity of the protected resource. Typically, there are a trade-off between FAR and FRR. If a system with
high security scenario, which means the FAR is very low, the system would likely have high FRR since it has the potential for rejecting legitimate users. On the other hand, If a system with high security scenario would like to improve FRR, the system may potentially accept unauthorized users.
Figure 2.2 Keystroke Feature Metrics
Comparing system is also important between studies. Although FAR and FRR are good metrics for quality system performance, they are not suitable for comparison due to the re-lationship between FAR and FRR. As a result, another commonly used comparison metric is Equal Error Rate (EER). EER is defined as a performance matric that the false accept rate and false reject rate are equal. The lower the Equal Error Rate value, the higher the accuracy of the authentication system.
Detection Error Tradeoff (DET) is a graphical plot of error rates that plotting the tradeoff of the False Reject Rate and the False Accept Rate. This graph leads us to obtain EER from our system as seen in Figure 2.2. EER represents an overall system accuracy so that systems with a lower EER provide not only reduce the chance that accepting unauthorized users but also correctly recognize legitimate users.
CHAPTER 3. ACTIVE COGNITIVE BIOMETRIC AUTHENTICATION SYSTEM
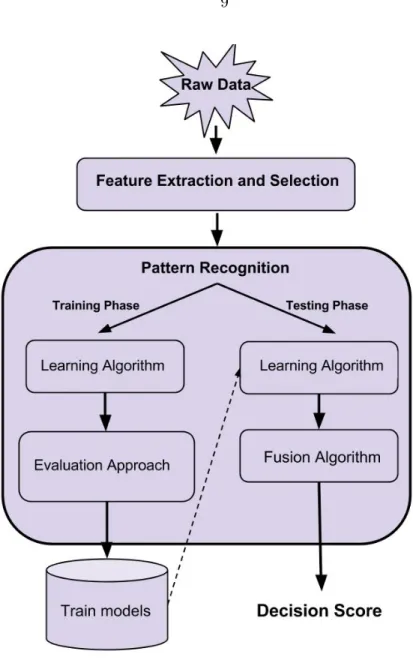
The Cognitive Biometric Authentication System consists of five components: feature ex-traction, data normalization, pattern recognition, evaluation approach and fusion algorithms. The overall system architecture can be found at in Figure 3.1
3.1 Feature Extraction
Searching for right cognitive fingerprints from raw data is essentially the most crucial com-ponent of this study. In most studies, researchers focus on improving existing classification approaches or try out different combination of features of fusion algorithms. However, with-out a good feature selection technique, no matter how sophisticated pattern recognition or the fusion algorithm is, systems won’t be able to provide accurate results.
3.1.1 N-graph Vector vs Cognitive Fingerprints
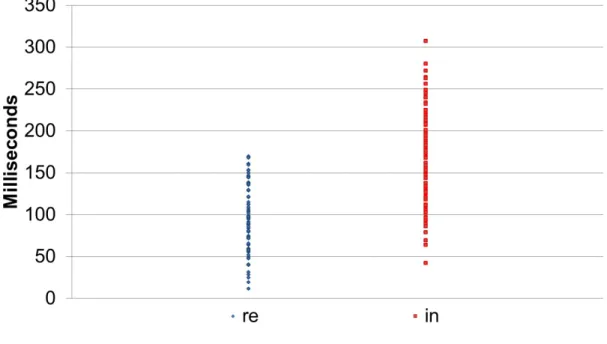
As mention in the chapter 2, the general conclusion from the keystroke dynamics is that fixed text entry works better than free text entry. The reason of free text related studies would have poor performance is that they often focus on N-graph, such as Held Times, Interkey Times, digraph and so on, instead of times in specific locations. N-graph is defined as the latencies of different digraphs are added together without regard to the actual key being typed, for example, words like ”and” and ”the” will be considered as 3-graphs latency. Also, generic N-graph can be defined a list of consecutive keystrokes as a substring that embedded in different words, for example, lists like ”re” and ”in” are digraph as seen in figure 3.2. However, this type of feature can not achieve better result because it mainly focuses on the time aspect so
Figure 3.1 Overall System Architecture
that the range of digraph may large and difficult to discriminate. In other words, We believe that what being type plays an important role in the keystroke dynamics, and Time features are greatly affected by which word being typed. For example, figure 3.3 and figure 3.4 show the distribution of ”re” and ”in” in the different words being typed. It suggests that what you typed greatly affect how you perform in the keystroke dynamics. What you type reflect a person’s unique behavioral traits, unintentional psychological factors. Therefore, with characteristic of uniqueness, representation and repeat, it qualifies as the best candidate to become cognition fingerprints.
Figure 3.2 Digraph: ”re” and ”in” s
3.1.2 Cognition Behavioral Biometric Trade-off
Our goal is to provide a system that monitors users’ behavior in their daily works. Although fixed text entry keystroke systems were better in identification tasks, it will be constrained in the real world authentication environment since the information usage that we collect based on predefined words would be low. Thus, cognition behavioral biometrics and information gathering can be mutually exclusive in the keystroke based authentication systems. As seen in Figure3.5, higher level of cognition fingerprints with better reliability would result in a limited information decision. For example, high cognitive level like a word ”exciting” that may contain an unique cognitive biometric, but the chance that users who type this word in the testing phase is relatively low. Conversely, with low level of cognition fingerprints like digraphs or trigraphs, the system may not be able to make an accurate decision. For example, ”in” exists in many words like to find, kind, information, etc. As the result, the testing sample size for ”in” is larger than ”exciting”, but ”in” may contain too much information to summarize as unique biometric.
Figure 3.3 Digraph ”re” in Different Words
3.1.3 Subword Searching Algorithm
Since the dilemma of cognition biometric level and information usage, we propose a new feature selection approach is called Subword Searching Algorithm. We introduce the concept using fixed strings approach within the free text implementation for the purpose of discrimina-tion. This feature extraction technique maintains user-representative features that are defined by users unique cognitive behaviors so that every user have their own unique cognition finger-prints.
The basic idea of Subword Searching algorithm is that instead of focusing on which words being typed or number of digraphs are used, we are more interested in subwords sharing of different words. We also use a collection of Flight times as the primate time measurement scale because it contains information about Held Time and Interkey Time. As we exam closer, we found that there were many subwords carry strong signals and can be used for building effective classifiers for authentication. But these subwords are not used mainly due to either not having enough samples of the words contain them or having other noisy data in the words contain them. For example, for a specific user, we have collected four words: ”educating”,
Figure 3.4 Digraphs ”in” in Different Words
”sitting”, ”exciting” and ”writing”, each with 4 samples. Among them, the common subword is ”ting” which has 16 samples. For the same user, these four classifiers might not have enough information to represent the user. However, if the cognition fingerprint of ”ting” might be very reliable (low noise) across 16 samples from these four words. As we can observe from the Figure3.6, subword ”ting” has low noise and potentially can build a classifier with high signal to noise ratio.
Furthermore, unstable digraphs may decrease the overall performance of certain words. We have found out that even though a word has many typing samples from one particular user, we still can’t guarantee that this word would provide good information for authentication. For example, a word ”think” was typed many times from a particular user. The overall rhythm of that word is consistent; however, a time between ”t” to ”h” and a time between ”h” to ”i” is particularly unstable. It turns out that classifier may reduce the confidence of that word or even unable to use it even if the times between ”ink” are still stable. As a result, the Subword Searching algorithm is designed to filter out unstable digraphs in words so that only sub stable words will be chosen to authenticate users.
du-Figure 3.5 Cognitive Level Versus Sample Size
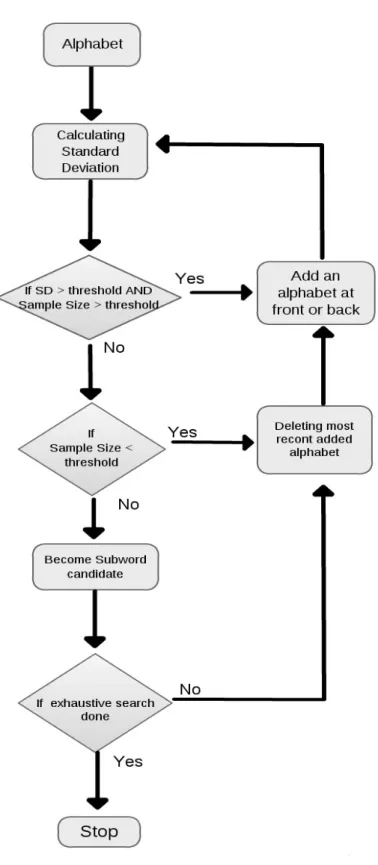
plicate appearance deleting, and it is quite effective for rapid global search of the large raw dataset. As shown in Figure3.7, the exhaustive search in Subword Searching algorithm starts searching an alphabet in alphabetical order. And every search phrase will iterate through any possible combination that potentially provide unique cognitive behaviors until the target al-phabet is stable and contains enough information. During each iteration, the target alal-phabet will merge a new alphabet, which means current cognition behavioral biometric level isn’t clear to represent users’ behavior, and try to exam the new subword combination quality our stable threshold at least certain population size. If not, the algorithm will check population size and decide whether new iteration is needed to start. The stability can be measured in many ways. In this study, we use a basic statistic approach: Standard Deviation (3.1) as our primary sta-bility metric. Standard Deviation shows the dispersion of a set of data from its mean. The higher value of Standard Deviation, the more spread of the data, and this is calculated as the square root of variance as follows:
Standard Deviation= v u u t 1 N−1 N X i=1 (xi−x)2. (3.1) Finally, the algorithm will converge all possible subwords as the cognition Biometric candi-dates and delete duplicate subwords in the candidate pool. These subword candicandi-dates will hopefully represent the optimal or near optimal biometric to our cognition fingerprints. In
Figure 3.6 Different Words Share the Same Subword ”ting” Information.
the next process, these candidates will undergo pattern recognition, evaluated by the Support Vector Machine learner, and evaluation approach to keep the high signal to noise ratio subword recognition fingerprints for our final cognitive fingerprints authentication system.
=
3.2 Data Normalization
Data normalization is the process of transferring the data into a range of scales. Normal-ization usually efficiently organizing real dataset into smaller and less redundant dataset. The objective is to eliminate redundant data and ensuring data dependencies make sense. Both of these are worthy goals not only reduce the amount of space a database consumes but also ensure that data is logically stored.
There are various data normalizations in statistics; however, we can’t directly use these data normalization techniques because of noisy dataset, where the noise may cause by users’ unexpected interrupt, typo and relatively long thinking. As a result, we first defined an overall noise value from the dataset, then we divided each value base on the overall noise value. In
this case, normalization data will map the original dataset into a meaningful range between 0 and 1.
3.3 Pattern Recognition Technique: Support Vectors Machine
SVM (Support Vectors Machine) introduced byC. Cortes, and V. Vapnik (1995) has been proved as a useful technique for pattern recognition, and thus has attracted much attention in authentication system. It is a originally two class problem that both positive and negative samples are involved, so this is practical in real-world authentication applications because authentication system is a two class (owner vs. Imposters) classification problem. SVM has been applied for numerous application areas with good performance. However, the existing standard two-class SVM are assuming that all positive and negative training samples have equal contributions to construct the hyperplane. It is infeasible for certain real world dataset because application areas such as gene profiling, medical diagnosis, credit card fraud and etc. Have highly skewed datasets which are hard to classify correctly. Take our authentication system Dataset for example, when we build a model for a user, we can include many other users’ data to represent negative samples, but the information from the target user is sometimes limited. As a result, the classification ability of standard SVM dealing with unbalanced dataset is very bad. Since the data set is highly unbalanced, where the imposter class is much larger than the legitimate class, we will impose extra weights on the legitimate class to prevent bias in favor of the imposter class. Consequently, in this paper, we employ Weight-C-SVM as our pattern recognition approach.
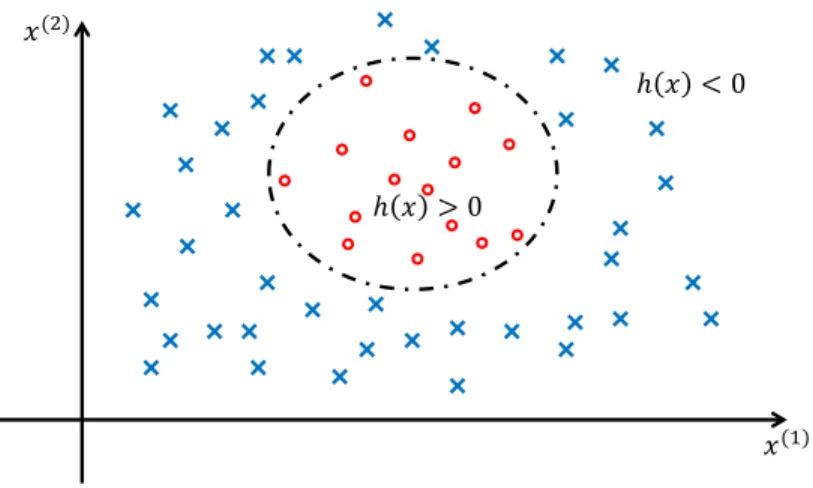
Generally, SVM has two phases: Training phase and Test phase. In Training phase, the idea of the SVM is to map the input data into the high dimension of feature space corresponding to the kernel, and then constructs a hyperplane as decision functionh(x) to separate the positive and negative classes with a maximum margin. In Testing phase, new incoming data points will be determined by evaluating which side of the hyperplane it falls on.
and Shu-xin Du (2005) solves the following primal problem: min w,b,ξ 1 2w Tw+C l X i=1 W ξi (3.2) yi(wTφ(xi) +b)≥1−ξi, ξi≥0, i= 1, . . . , l. Its dual formulation is
min α 1 2α TQα−eTα 0≤αi≤W C, i= 1, . . . , l, (3.3) yTα= 0,
Where e is the vector of all ones, C is a parameter chosen by the user that controls the tradeoff between the margin and the misclassification errors,W is to assign each data point a diferent weight according to its relative importance in the class, Q is an l by l positive semi definite matrix, Qij ≡ yiyjK(xi, xj), and K(xi, xj) ≡ φ(xi)Tφ(xj) is a kernel. In our study, we use the most popular kernel: the Gaussian radial basis function (RBF) kernel as defined in (3.4). Here training vectors xi are mapped into a higher dimensional space by the function φ.
k(xi,xj) = exp −kxi−xjk 2 2σ2 (3.4) 3.3.2 Testing Phase
The decision function h(x) (3.5) will be generated from Training phase as an SVM model to evaluate which class unknown points belong to. As illustrated in Fig 3.8, where h(x) > 0 indicates positive class andh(x)<0 indicate negative class.
h(x) =sign( l
X
i=1
3.4 Evaluation Approach: K Fold Cross-validation
In order to accurately analyze the performance of cognitive fingerprints in SVM training phase, the k fold cross-validation is probably the most popular approach for estimating the signal to noise ratio strength. Combing k fold cross-validation with SVM, we could estimate SVM models’ accuracy in real circumstances. In k fold cross-validation, Since we use two class SVM as novelty detector, a subword’s typing information, which contains the target user’s and other users’ data, will be divided equal ratio into k segments, then the k-1 segments are selected to build a temporary evaluation training model, and the remain one segment is retained as the validation data for testing the temporarily model. The cross-validation process k times with each k segment used exactly once. Because the hold-out samples werent involved in the selection of the model parameters, the performances on these samples are a more accurate estimate of the subword’s signal strength. The performance of the temporarily SVM models applied to the k fold cross-validation is recorded and then averaged.
From the results of these evaluations, we can estimate the probabilities of true acceptance
Plegi (3.6) and false acceptance Phack (3.7) of the classifier. For example, after the evaluation with datasets from legitimate users, there are N acceptances out of M samples,Plegiis N/M. The confidence of decision Wa (3.8) on acceptance is expressed as the average of the ratio of
PlegitoPhack. The confidence of decision on rejectionWr(3.9) is expressed as the average of the ratio of the probability of true rejection 1−Phack to the probability of false rejection 1−Plegi. Once all the subwords are evaluated, the system simply removes the cognition fingerprints with low positive confidence.
Plegi=
number of accepted legitimate samples
number of total legitimate samples . (3.6)
Phack =
number of accepted hacker samples
number of total hacker samples . (3.7)
Wa= 1 k K X i=1 (P i legi Phacki ) (3.8)
3.5 Fusion Algorithm: Logarithm Sum of Score
After finishing k fold cross-validation phase, only those that have strong signal to noise ratio cognition fingerprints, in term of Wr and Wa, and are selected and stored into the user profile. During the system testing phase, each subword biometric model makes decisions either reject or accept from incoming unknown samples. The total number of reject and accept will be accumulated in rejecting counterR and accept counterA, respectively. A classifier score of one subword biometric model is generated by multiplying the confidence of decision on acceptance
Wa to accept counterA plus the confidence of decision on acceptance Wr to accept counterR. A final decision confidence scoreWf inal (3.10) is based on the Logarithm sum of the score of all classifier scores. For active authenticating user’s purpose, if Wf inal greater than a predefined global threshold, our authentication system won’t interrupt the current user. Otherwise, the system will request further actions for security purpose.
Wf inal= N
X
i=1
(log(Wai)∗Ai+ log(Wri)∗Ri). W here N = N umber of Cognition F ingerprints.
𝑥(2)
𝑥(1)
ℎ 𝑥 > 0
ℎ 𝑥 < 0
CHAPTER 4. EXPERIMENT DESIGN
4.1 Experiment Goal
We developed a website to collect the keystroke dynamics of individuals. This website provided questions to simulate user general environments, like replying email, writing short essays and describing pictures. Participants are required to finish three 30 minute segments separated by an interval of 12 hours apart. In each segment, since experiments were designed to simulate a real world environment, participants can base on questions to type anything without constraints in any way, including allowing the user to choose what text they wish to enter as well as allowing errors, pauses, and other breaks in the flow of text entry. Also, users have the option to perform the experiment in any computers at any places. If users are interrupted during the experiment, our website will automatically save and allow users to come back at the current session. After completing of the data collection, the collected data were subjected to analysis in our proposed cognition authentication system. Our system is a Java based program that was developed to enable the integrating over the LIBSVM fromChang, C.C. and Chih-Jen Lin (2001).
The goal of this experiment is to see the performance of our approach for 30 minutes computer usage in the real environment. We choose segment 1 and 3 as our training data, and we used segment 2 to simulate computer usage. With each user, we build a SVM model, which contains all subwords cognition fingerprints from that user, then we used his/her segment 2 to discriminate. If our system recognizes he/she as a hacker, he/she will become system’s error in term of the false rejection rate (FRR). Finally, we used remaining 399 users’ segment 2 data as hackers to test our system. If our system won’t be able to recognize them, these users will be counted as the false acceptance rate (FAR). As a result, total 159600 hackers attempts and
The large scale experiment was conducted at Iowa State University in 2012. We invited 36,000 candidates, including students, faculties and staff, through email. There are 1,977 participants involved and finished two 30 minute segments, and 983 out 1977 participants finished the additional 33-minute segment, whereby 88 percent of them are undergraduate Students and graduate students while the remainder consists of faculties and Staffs. The detail statistic information would be shown is table 4.1.
Table 4.1 Statistic Subjects Report
Gender Percentage Male 56.12 Female 43.49 Unchoose 0.38 Age Percentage 18-21 58.96 22-30 28.4 31-40 6.46 41-50 2.6 51-60 2.54 60+ 0.76 Unchoose 0.23 Status Percentage Undergraduate Student 73.74 Graduate Student 15.16 Faculty 1.61 Staff 7.46 Race Percentage White 82.06 Asian 14.7
American Indian or Alaska Native 0.3 Black or African American 2.1 Native Hawaiian or other Pacific Islander 0.23
4.3 Development Environment and Experiment Interface
Development Environment refers to the collection of hardware and software tools that we used in this experiment. We used currently high-end hardware with 24 cores CPU and 48 G RAM as our major experiment server to host 1977 participants’ requests. On the software side, we installed a complete LAMP environment including Linux, Apache, Mysql and PHP to provide the service. More detail information can be found in table 4.2.
Table 4.2 Development Environment
Hardware Type
CPU Xeon(R) x5680
RAM DDR3 48G
Hard Disk SATA 2T
Software Version
OS Red Hat Enterprise Linux Server release 6.4
Kernel 2.6 PHP 5.33 Apache 2.2.15 MySQL 14.14 PhpMyAdmin 3.5.8.1 Java 1.7 LibSVM 3.17
Experiment interface can break down into three types including transcription, essay and sentence questions. Transcription questions pre-defined the context so that the participants could only type the information based on the context we provided. Essay are open questions that simulate the general computer usage like responding emails, asking for opinions and more. Instead of pre-defined the context like transcription or the questions without giving further constraints like essay, sentence questions required participants to type a short information from their knowledge. The goal of these questions is to mimic the real environment for 90 minutes computer usage and lead participants to contribute similar topics.
CHAPTER 5. EXPERIMENT RESULTS
A series of experiments are carried out to enhance the reliability of our authentication system in this section. Four major topics were analyzed and structured as follows: first, we investigate on cognitive feature and best cognitive fingerprint representation. Next, we evaluate several pattern recognition techniques, in specific, our goal is to make a comprehensive comparison of existing methods that used in keystroke authentication researches. Third, we experimentally demonstrate the benefit of the Subword Searching Algorithm. Finally, we re-exam our models to make sure our authentication system may also work in real world scenarios. Meanwhile, with the aid of more details, we decide to compare the performance with the different implementation parameters and approaches.
5.1 Feature Comparison
5.1.1 Cognitive Fingerprint Representation Study
Figure2.1introduce the typical timing information that general be extracted as the features in keystroke dynamics researches. The feature can be defined from one key behaviors like the held time and the interkey time to N consecutive key behaviors like N-graph. As we can see in the Figure 5.1, a word ’with’ can be represented in many ways. First, we can use the held times and interval times as basic metric and calculate separately in a vector. Secondly, we can compute the time information between two characters. In this case, a feature vector consists of five columns like ”space-w”,”w-i”,”i-t”,”t-h”, and ”h-space”. Moreover, we can apply the concept of digraph to 5-graph. As a result, the feature vector only has two columns which are ”space-h” and ”w-space”.
Figure 5.1 Feature Representation Example
experiment, we wish to answer the question as follows: For a given keystroke timing information, what is the best feature metric to discriminate among users. To do this, we first randomly choose 200 users as legitimate users, then we use segment 1 and segment 3 as a training dataset to build classifiers for legitimate users. Subword Searching Algorithm and evaluation also be used in this experiment to define cognitive fingerprints. For each user, we employ Weighted SVM with 199 randomly users as the negative class to build the classifier for he/she. In the testing phase, we employ the same 200 legitimate users’ segment 2 dataset to test the performance of the classifiers. We are thus able to analyze the false rejection rate (FRR) and the false acceptance rate (FAR) in this experiment by counting the number of rejections from legitimate attempts and the number of acceptations of additional user attempts. We apply the same experiment with different feature representations, digraph, trigraph and 4-graph. By doing this, we will be able to make a comparison of performance of each feature. Finally, we use a commonly use performance metric, Equal Error Rate (EER), to present to result in Table5.1. A complete experiment result can be seen in Table 5.1. The overall performance decrease when the N becomes larger in the N-graph. Also, it is clear that digraph is more discriminating than the other groups. According to the reslult of the experiment, digraph is more discriminat-ing than others. Moreover, employdiscriminat-ing all available timdiscriminat-ings in digraph is better than combindiscriminat-ing multiple timing information.
5.1.2 26x26 Feature Vector vs Cognitive Fingerprint
We intend to further investigate features from the different angles in this section. As mentioned in the chapter 3, N-graph can be defined a list of consecutive keystrokes as a substring that embedded in different words. For instance, a list likes ”in” is a digraph that is embedded in many contexts like ”being”, ”instead”, ”think” and etc. Although most of previous researches tend to use N-graph in the freetext environment, we find out that our cognition fingerprint may become a better feature metric because it reflects person’s behavioral traits with characteristic of uniqueness and repeat.
In order to verify our observation, we design an experiment to make a comparison of the feature we proposed and N-graph. To guide our choice of N-graph, our experiments in the previous section tell us to avoid N-graph that N is greater than 2 and instead to favor digraph. As before, we do the same procedure as previous section and employ Weighted SVM to build the classifiers for the random 200 legitimate users, but instead of focusing on timing information in a specific sequence, we involved all possible timing information without regard to the actual context being typed. To be more specific, we build a 26 x 26 feature vector for each user because there are 26 alphabets in English. We delete some features that seldom occur in English. Since some features may occur in multiple words, the sample size may vary in features, so we decided to make the features with equal sample size by removing some samples that have too many samples in one feature. Again, we build legitimate user model base on segment 1 and segment 3. In the testing phase, we also use segment 2 to analyze the FRR and FAR. Finally, we can summarize the results by using Equal Error Rate as present in Table5.2.
As we can see in the in Table 5.2, it is noticeable that there is a big performance gap between digraph and cognitive fingerprint. We can see that the 26x26 feature vector is not feasible by using Weighted SVM. The probable explanation may due to lacking of the cognitive connection between features in the samples. The classifiers tend to reject all user attempts no
matter the user is legitimate or not. On the other hand, the results of cognition fingerprint with digraph is very encouraging and discriminatory. The results also validate our observation in the chapter 3.
Table 5.2 26x26 Feature Vector vs Cognitive Fingerprint
26x26 Feature Vector Cognitive Fingerprint
Equal Error Rate (percent) 32 1.5
5.2 Method Comparison
5.2.1 SVM Performance of Different Class
Support Vector Machines has been widely used in many areas. The SVM algorithm as it is usually construed is essentially a two class algorithm. However, B.Schlkopf (2000) suggested a method of adapting the SVM methodology to the one-class classification problem (see in the Figure 5.2). Essentially, after transforming the feature matrix via a kernel, the standard two class SVM techniques are employed by focusing on only one class. On the other hand, multi-class SVM is another approach to adopting SVM to multi-classification problems with three or more classes (see in the Figure5.3). Generally, multi-class ranking SVM, one-against-all classification and pairwise classification are very popular methods for multi-class SVM. For extensive details, see B.Schlkopf (2000) andK. Crammer and Y. Singer (2000). In our research, we used the LIBSVMChang, C.C. and Chih-Jen Lin (2001). This is an integrated tool for support vector machines that can handle one-class SVM usesB.Schlkopf (2000) approach, standard two-class algorithm and multi-class SVM.
The experiment design as follows: suppose we are going to build a word model for a particu-lar user with these three different approaches, so we randomly choose a user to build a training dataset from a particular user, and we also collect few users’ data as negative examples of two-class and multi-class SVM. Then, we used a testing dataset which has 6 positive samples and 40 negative samples to exam the performance of these three SVM approaches. Finally, to have a more complete analysis, we did these experiment five times to ensure the quality of the results.
Figure 5.2 One class SVM
Figure 5.3 Multi-class SVM
By running the similar experiment five times using the three types of SVM algorithms, we are in a position to make a comparative study. This experiment has been conducted and their results are shown in the Table5.3. The Table indicates that two-class SVM reaches lowest both False Reject Rate and False accept Rate. Therefore, we choose two-class SVM as our ultimate machine learning solution.
5.2.2 Performance Comparison with Distance-Based Approaches
In this section, we would like to compare the performance of Weighted SVM and some currently well-known pattern recognition approaches in freetext keystroke researches. There are
Table 5.3 SVM Performance Comparison in Different Class
Experimental 1 Reject/Legitimate Attempts Accept/Hacker Attempts
Multi-class SVM 2/6 3/40 Two-class SVM 1/6 1/40 One-class SVM 5/6 0/40 Experimental 2 Multi-class SVM 0/6 4/40 Two-class SVM 0/6 4/40 One-class SVM 3/6 5/40 Experimental 3 Multi-class SVM 3/6 2/40 Two-class SVM 0/6 1/40 One-class SVM 4/6 0/40 Experimental 4 Multi-class SVM 2/6 5/40 Two-class SVM 2/6 3/40 One-class SVM 3/6 1/40 Experimental 5 Multi-class SVM 2/6 2/40 Two-class SVM 0/6 2/40 One-class SVM 4/6 0/40
three distance-based classification techniques are going to be discussed in this section: Absolute, Relative comparisons, Euclidean distance and Manhattan distance. In general, the distance-based classification will form a user profile by discarding outliers and recording the useful information in the training phase. The user profile is treated as a N-dimensional pattern vector, where each dimension represents a feature metric. Then, testing samples are manipulated in the same way as the training user profile into a testing profile to be tested to the training profile using different distance approaches. If the distance is less than a predefine threshold value or with the smallest value among other training profiles, the testing profile is classified as the legitimate user. Otherwise, the system will reject the testing profile.
Although the literature on keystroke analysis of true freetext is pretty limited, a very popular pattern recognition algorithm in freetext keystroke authentication is based on two measurements: absolute and relative comparisons, which first introduced by Bergadano, F., Gunetti, D. and Picardi, C. (2002) and later used by Gunetti, D. and Picardi, C. (2005)
into account the user keystroke timing order. For example, a legitimate user may use to consistently type a certain digraphs ”th” faster than another digraph ”wi”, regardless of his actual typing speed.
Secondly, we use other well-known distance-based technique : Euclidean distance. Euclidean distance is the ordinary distance between two profiles. The distance between two profiles in the two dimensional is given by the Pythagorean theorem. For the N dimensional pattern vector, we can also apply Euclidean distance to calculate the similarity between two profiles. The formal definition is given by5.1.
Euclidean(x, y) =p(x1−y1)2+ (x2−y2)2+...+ (xN −yN)2 (5.1) Third, Manhattan distance is a distance metric that measure the similarity between two profiles in a grid based on a strictly vertical path and horizontal path. The distance is the sum of the absolute values of the horizontal and the vertical distance. The formal definition is given by 5.2.
M anhattan(x, y) =|(x1−y1)|+|(x2−y2)|+...+|(xN −yN)| (5.2) A fair comparison should be designed by running an experiment with the same dataset in the same environment with different pattern recognition approaches. The experimental procedure in this section is the same as the experiments we conducted in section 5.1. In the training phase, as before, the 200 legitimate users we choose are the same as we used in section 5.1. We also employ the digraph and Subword Searching Algorithm to represent users’ features in their segment 1 and segment 3 dataset. However, we build legitimate users’ classifiers by running four pattern recognition methods, Weighted SVM, Absolute, Relative comparisons, Euclidean distance and Manhattan distance. Note that Weighted SVM is a 2-class approach so that it requires more data to be involved. In the testing phase, we employ the same 200 legitimate
users’ segment 2 dataset to test the performance of the classifiers. The threshold values are determined experimentally by the lowest Equal Error Rate in each experiment. Experimental results of three distance-based techniques and Weighted SVM can be seen in the Table 5.4.
Although Weighted SVM requires more time to train classifiers and need more data to act as the negative class, whereas distance-based techniques only take into account the target user’s data, from the Table 5.4 it is evident that Weighted SVM outperforms distance-based approaches. Hence, we believe that Weighted SVM is more suitable than distance-based tech-niques in our research. The conclusion of distance-based techtech-niques in this experiment is similar to the result fromKevin Killourhy and Roy Maxion (2009). The result suggests that Manhat-tan disManhat-tance is better than Euclidean disManhat-tance. However, we also discover that 2 class Weighted SVM is much better than others.
Table 5.4 Comparisons of Weighted SVM and Distance-based Techniques Weighted SVM A, R Comparison
Equal Error Rate (percent) 1.5 9.5
Euclidean Manhattan
Equal Error Rate (percent) 12.0 9.0
5.3 Performance Comparison With/Without Subword Searching
Algorithm
Being able to use information effectively and achieve higher performance, Subword Searching Algorithm plays an important role in our authentication system. In this experiment, we find out that using Subword Searching Algorithm as the feature selection approach to find the potential optimal biometric can benefit our system in two ways. First, it greatly increases the number of cognition classifiers for target users. A statistic summary as be seen in the table 5.5. Subword Searching Algorithm extracts ten times of cognition classifiers than words only approach so that we have a better understanding of authenticate users. Other important contributions is that the cognition classifiers find by Subword Searching Algorithm are more reliable than words because this approach maintains the important subwords information and exclude unstable parts. To make a better comparison, performance analysis can be best present
Table 5.5 Models Size With and Without Subword Searching Algorithm Per User Avg Number of Classifiers Per User
Words only 35
With Subword Searching Approach 380
Figure 5.4 Performance With/Without Subword Searching Algorithm
5.4 Large Scale Experiment and Reliability of SVM Models Test
As mentioned in the beginning of the previous chapter. Our simulation experiment design is based on 400 users segment 1 and 3 as training dataset. And each user models would be tested with remaining 399 users’ segment 2 data and his/her own segment 2 dataset. As a result,
total 159600 hackers attempts and 400 legitimate user attempts would be used to exam in our system. As we can see from Figure5.5, however, our training phase involves another 399 users’ segment 1 and 3 dataset as negative class for SVM to train users’ cognition fingerprints so that our SVM models may could only achieve very low False Accept Rate under these 399 hackers, but it is impossible to pre-collect all potential hackers typing information, so we need to make sure that our cognition fingerprint models can also work well no matter hackers information are involved in training phase or not.
Figure 5.5 Large Scale Experiment Design
As a result, a reliability experiment test should be conducted to make sure our approach is feasible in the real world. In this experiment, we used another 399 users’ 30 minutes dataset to simulate real world scenarios that hacker’s information are not known to our authentication system as shown in the Figure 5.6. Our optimal threshold was picked according to the Equal Error Rate from the Figure 5.4, then we used this threshold to test these new 399 users’ 30 minutes dataset. The Table 5.6 reports a performance comparison of hackers’ information involved and without involving the training phase. Although FAR increase 0.6 percent when hackers are not involved in the training phase, it overall suggests that the our cognition models
Figure 5.6 Reliability SVM Models Experiment Design
Table 5.6 Reliability Experiment Result
Hackers FAR (percent)
Involved in Training Phase 1.37
Without Involve in Training Phase 1.43
5.5 Discussion
With the aid of more detail explanation, we will study the efficiency of our method with respect to the number of available samples in this section. Next, we look into the nature of SVM and try to find the best parameters and approaches in many aspects.
5.5.1 Choosing Number of Sample Size as Cognition Fingerprints
A raising question is how to choose the appropriate sample size to define cognition fin-gerprints. Sample size is a parameter that used to trade-off between the number of cognition
fingerprints and reliability of the models. Since we only used one hour free text typing infor-mation as training dataset, each cognition fingerprint may not provide enough sample size for SVM to build a reliable model. On the other hand, we would like to have as many cognition fingerprints as possible because more cognition fingerprints can help our authentication system not only in accuracy aspect but also hopefully shorter the time we need to authenticate the incoming unknown users. We started sampling size from 4 and kept increasing this threshold value by 1. The results of our authentication system were very sensitive to the sample size. However, under proper choices it can give the best results. As illustrated in the Figure 5.7, increasing the number of sample size further caused large decreases in performance, and it also suggests that we can obtain the best result when we set the sample size at least five.
Figure 5.7 DET For Choosing Number of Sample Size
5.5.2 Weight Optimization for Weighted SVM
As described earlier in chapter 3, the classification ability of standard SVM dealing with unbalanced dataset is very bad. We use Weighted SVM to improve the performance of the standard SVM. Fortunately, LIBSVMChang, C.C. and Chih-Jen Lin (2001) also implements Weighted SVM version to deal with unbalanced dataset.
a user. On the other hand, if we use 50 users as negative class, SVM only take approximately 3.3 minutes per user. In this experiment, although we believe that using more information may help SVM to define the hyperplanes and boundaries, We are interested in finding an optimum point that not only provide the best performance but also requires less training time.
Table 5.7 Time Consumption of Training Number of Negative Users Involve Number Of Negative Users Involve Approx Time Per User (Minute)
50 3.3
100 15.55
200 31.01
300 50.33
400 64.9
In order to understand the relationship between performance and training time, we ran-domly choose and build 200 users model with 50, 100, 200, 300 and 400 users as the negative class. As seen in the Figure 5.8, we can’t obtain any conclusion according to the Figure 5.8
because the performance doesn’t maintain while decreasing the hacker size. In other words, in order to get the best performance from SVM, we still involve as much as negative class as possible in the training phase.
CHAPTER 6. CONCLUSIONS
Keystroke dynamics at the cognitive factors that help us to understand the properties of human characteristics and uniqueness. In this paper, we addressed on a fundamental keystroke dynamics authentication system that is suitable for real world environments without any par-ticular form of restricting or any specific hardware. Especially, we described an integrated approach that combines extraction algorithm, Subword Searching algorithm, Weighted SVM (WSVM) and the fusion algorithm to analyze the properties of human characteristics and uniqueness as cognition fingerprints invisibly. Our technique has been tested in a large scale experiment of 800 participants with high accuracy at discriminating among legitimate users and impostors.
In view of the increasing need of active authentication, we also need to investigate on more interesting experiments that evaluating in terms of how fast or how many keystrokes should be used from an imposter before the system recognize them. Also, our future work intends to broaden the scope of our study in other modalities such mouse, mobile device, web browsing behavior and so on. Such studies are also important since other cognition fingerprints will allow developing a multi-biometric authentication system. We plan to, hopefully, make our authentication system openly available in the future so that organizations like Defense Advanced Research Projects Agency (DARPA) can use it to improve the security of computer systems.
REFERENCES
M. Karnan , M. Akila, N. Krishnaraj, Biometric personal authentication using keystroke dy-namics: A review Applied Soft Computing, Volume 11, 1565–1573.
Joo Ferreira and Henrique Santos, Keystroke Dynamics for Continuous Access Control
Enforce-ment2012 International Conference on Cyber-Enabled Distributed Computing and Knowledge
Discover, 216–224.
F. Monrose, M.K. Reiter, S. Wetzel, Password hardening based on keystroke dynamics Proceed-ings of the 6th ACM Conference on Computer and Communications Security, Kent Ridge Digital Labs, Singapore, 73–82.
Bergadano, F., Gunetti, D. and Picardi, C., User authentication through keystroke dynamics.
ACM Transactions on Information and System Security, 367–397.
Gunetti, D. and Picardi, C., Keystroke analysis of free text.ACM Transactions on Information and System Security., 312–347.
Pin Shen Teh, Shigang Yue, and Andrew B.J. Teoh, ”Feature Fusion Approach on Keystroke Dynamics Efficiency Enhancement”international journal of cyber-security and digital foren-sics, 20–31.
Heather Crawford, Keystroke Dynamics: Characteristics and Oportunities Eighth Annual
In-ternational Conference on Privacy, Security and Trust, 1–1
C. Cortes, and V. Vapnik, ”Support vector network” Machine Learning, 273–297 Chang, C.C. and Chih-Jen Lin, 2001. LIBSVM: a library for support vector machines.
training class sizes” Machine Learning and Cybernetics, 4365–4369
L. Araujo, L. S. Jr., M. Lizarraga, L. L. Ling, and J. B. YabuUti, ”User Authentication Through Typing Biometrics Features”, IEEE Transactions on Signal Processing, 851–855
D. Umphress and G. Williams, ”dentity Verification Through Keyboard Characteristics”,
In-ternational Journal of Man-Machine Studies, 263–273
J. Leggett, G. Williams, M. Usnick, and M. Longnecker, ”Dynamic Identity Verification via Keystroke Characteristics”, International Journal of Man-Machine Studies, 859–870
A. A. E. Ahmed, I. Traore, and A. Almulhem, ”Digital Fingerprinting Based on Keystroke Dynamics”,Proceedings of the Second International Symposium on Human Aspects of
Infor-mation Security Assurance, 94–104
D. Hosseinzadeh and S. Krishnan, ”Gaussian Mixture Modeling of Keystroke Patterns for Bio-metric Applications”,eee Transactions on Systems Man and Cybernetics Part C-Applications
and Reviews , 816-826
K. S. Balagani, V. V. Phoha, A. Ray, and S. Phoha, ”On the discriminability of keystroke feature vectors used infixed text keystroke authentication”,Pattern Recogn.Lett, 1070-1080 Pin Shen Teh, Shigang Yue and Andrew B.J. Teoh, ”Feature Fusion Approach on Keystroke
Dy-namics Efficiency Enhancement”,International Journal of Cyber-Security and Digital
Foren-sics,The Socity of Digital Information and Wireless Communications, 20–31
Hocquet, S. and Ramel, J. and Cardot, H., ”Fusion of methods for keystroke dynamic authen-tication”, Automatic Identification Advanced Technologies, 224–229
N. Bartlow and B. Cukic, ”Evaluating the Reliability of Credential Hardening through Keystroke Dynamics”, 17th International Symposium on, 117-126
D. Tran, W. Ma, G. Chetty, and D. Sharma, Fuzzy and Markov models for keystroke biomet-rics authentication.Proceedings of the 7th WSEAS International Conference on Simulation, Modelling and Optimization, 89-94
B. Schlkopf, A. Smola, R. Williamson, and P. L. Bartlett. ”New support vector algorithms.”
Neural Computation, 1207-1245
K. Crammer and Y. Singer. ”On the Algorithmic Implementation of Multi-class SVMs”JMLR
Kevin Killourhy and Roy Maxion. ”Comparing Anomaly-Detection Algorithms for Keystroke Dynamics” Proceedings of the 39th Annual International Conference on Dependable Systems