Title
Modeling of traffic data characteristics by Dirichlet Process
Mixtures
Author(s)
Ngan, YT; Yung, NHC; Yeh, AGO
Citation
The 8th IEEE International Conference on Automation Science
and Engineering (CASE 2012), Seoul, Korea, 20-24 August 2012.
In Conference Proceedings, 2012, p. 224-229
Issued Date
2012
URL
http://hdl.handle.net/10722/189653
1
Four Entry Signals Four Exit Signals
(a) All signals are normal (b) All signals are normal
(c) Entry S is abnormal (d) Exit N is abnormal Fig. 1. Normal and abnormal traffic data.
Modeling of Traffic Data Characteristics by Dirichlet Process Mixtures
Abstract—This paper presents a statistical method for modeling large volume of traffic data by Dirichlet Process Mixtures (DPM). Traffic signals are in general defined by their spatial-temporal characteristics, of which some can be common or similar across a set of signals, while a minority of these signals may have characteristics inconsistent with the majority. These are termed outliers. Outlier detection aims to segment and eliminate them in order to improve signal quality. It is accepted that the problem of outlier detection is non-trivial. As traffic signals generally share a high degree of spatial-temporal similarities within the signal and between different types of traffic signals, traditional modeling approaches are ineffective in distinguishing these similarities and discerning their differences. In regard to modeling the traffic data characteristics by DPM, this paper conveys three contributions. First, a new generic statistical model for traffic data is proposed based on DPM. Second, this model achieves an outlier detection rate of 96.74% based on a database of 764,027 vehicles. Third, the proposed model is scalable to the entire road network.
Keywords: Outlier detection, traffic flow analysis, Dirichlet process mixtures
I. INTRODUCTION
Traffic data is the basic component in most traffic flow analysis (TFA) [1-3] of modern urban road networks. TFA relies on statistic of the road dynamics, which change continuously in highway [2] and urban roads [2] regardless. This statistic offers significant spatial-temporal traffic indicators such as volume and density, vehicles types, alerts of incidents, congestions and so on. Not only does it help in traffic forecasting [3], maintenance, operation and design [2], it is also beneficial to incident detection and management [4,5]. Traffic data typically in vast quantity from multiple detection sources are frequently contaminated by errors and noise during data capturing. Local variations in traffic patterns may also appear as spatial and/or temporal variations in these traffic indicators. Altogether, they form a group of outliers, as contrast to the inliers of normal traffic patterns.
It is common to assume that the captured data is normally distributed in order to fit them as a parametric problem. However, in realistic cases, they may not always exhibit such feature. Traffic signals generally share a high degree of spatial-temporal similarities in two situations (1)
within itself: Entry E of the traffic data in Fig. 1(a) appears repetitive; (2) between signals: Exit signals Fig. 1(b) are similar in shape. Furthermore, signals from different sessions may share similar patterns too, such as Entry N signal of the data in Fig. 1(a) and Fig. 1(c). On the contrary, abnormal signals such as Entry S shown in Fig.1(c) and Exit N shown in Fig. 1(d) are similar to other normal signals in majority sampled points, but slightly different in the rest. Such differences are hardly prominent and can easily be mistaken as normal signal variations. In order to deal with this, it would be more appropriate to treat it as a nonparametric problem instead.
A nonparametric problem is usually expressed as a set of probability distributions on a given sample space. Ferguson [6] stated that the primary difficulty to work with nonparametric problem is to find workable prior distributions in the parameter space. Two characteristics should be obvious in a suitable prior distribution: (1) the support of the prior distribution is large w.r.t. an appropriate topology on the probability distributions space (PDS) on all possible outcomes, and such topology can be achieved by defining the limit of a sequence of the PDS elements; and (2) given a sample of observations of the event, the posterior distribution is manageable analytically.
In this research, we identified the characteristics of these spatial-temporal signals to be aperiodic, finite length, casual and random. As mentioned above, in order to get Henry Y.T. Ngan, Member, IEEE,
Nelson H.C. Yung, Senior Member, IEEE Laboratory for Intelligent Transportation System Research,
Department of Electrical and Electronic Engineering, The University of Hong Kong, Hong Kong Email: [email protected], [email protected]
Anthony G.O. Yeh
Center of Urban Planning and Environmental Management, Department of Urban Planning and Design, The University of Hong Kong, Hong Kong
Email: [email protected]
8th IEEE International Conference on Automation Science and Engineering August 20-24, 2012, Seoul, Korea
2 rid of the high degree of spatial-temporal similarities of
traffic signals, we model the real-world traffic data as DPM. The generic DPM model is effective in representing the variations in traffic signals and segmenting outliers from the rest of the data by its unsupervised clustering property. To evaluate the proposed model, a set of traffic videos was taken of a four-arm junction located in one of the busiest districts in Hong Kong. This dataset was captured over 31 days, for which each day was divided into AM and PM sessions of the time intervals of 07:00-10:00 and 17:00-20:00, respectively. Hence, a total of 62 sessions were acquired. The junction is characterized by four motion patterns (MPs) in one cycle controlled by the traffic lights. The data associated with either an Entry or Exit per session is collectively called a signal, which represents the volume of traffic during a session. Fig. 1 illustrates examples of normal and abnormal Entry and Exit signals.
In general, outlier detection [7] can be interpreted as detecting a piece of data, or a subset of data that appears to be inconsistent with the remaining dataset. The aim of outlier detection is to segment and eliminate the inconsistent data for better signal quality. At present, existing methods [7] do not offer acceptable detection rate for them to be practically useful. The crux of outlier detection described in this paper could be considered as nonparametric modeling, of which the number of groups in the data of interest does not need to be known in advance. In the simplest sense, traffic data can be viewed as a major group of normal data plus other groups of anomalies. Dirichlet Process (DP) priors in this case exhibit the characteristics as described in the preceding paragraph and are well-suited to the non-parametric problem as they have traceable posteriors. It should be noted that the posterior distribution of a DP of a sample is also a DP. With these elegant properties of DP, we assume that if a traffic flow model based on the traffic data is generated from a DP, then the respected observations are samples of a mixture of these traffic flow models, and can be classed as DPM. DPM actually consists of countable infinite mixture models, in which its individual model can develop itself. The number of clusters in DPM can be iteratively determined. In short, DPM is one of the remarkable stochastic models used in recent unsupervised clustering applications [8-11]. In the proposed DPM approach, we firstly extract traffic signals (such as entry signals depicted in Fig. 1(a)) from the dataset. Second, the signals are standardized and their features described by a covariance signal descriptor. This signal descriptor is input as the conjugate priors to the DPM in a later stage. Third, a PCA is used to reduce the dimension of the signal vector of each signal. Fourth, the dimension-reduced signal vectors are then modeled by DPM. Fifth, outlier detection is accomplished by the collapsed Gibbs sampler.
The novelty of this paper is the modeling of complex spatial-temporal traffic data as DPM. There are three contributions of this paper. First, a new generic statistical model for traffic data is proposed based on DPM. Second, this model achieves an outlier detection rate of 96.74% based on a database of 764,027 vehicles. Third, the
proposed model is scalable to the entire road network. The organization of this paper is as follows: Section II outlines the related work. Section III presents details of the proposed modeling for outlier detection. Section IV describes the performance evaluation. Lastly, conclusion is drawn in Section V.
II. RELATED WORK
A. Dirichlet process mixtures
DPM is a popular nonparametric Bayesian model for machine learning and data mining, especially for density estimation and clustering. DPM is a mixture model that composes of a stochastic process called Dirichlet Process [6,12,13]. The DP, denoted as is a distribution over probability distributions, and is defined by two parameters, a scaling parameter, , and a base probability measure . The posterior estimation methods for DPM are well developed in [8-11,14] .
Many applications of DPM have been developed for detecting abnormal activities [9,14], scene categorization [8] and tracking maneuvering targets [11]. Among these published work, there is only one record [15] of DPM being applied to outlier detection that is in a motion segmentation problem. Six real datasets were tested, in which the best and worst total error rates from one dataset are 2.1% and 8.5%, respectively. This supports the view presented in this paper that DPM is promising for identifying outliers in large volume of traffic data. Moreover, according to literature survey, there is a lack of model-based outlier detection approach for traffic data. Hence, DPM is chosen due to its elegant mathematical representation of the stochastic data and its unsupervised clustering characteristic.
B. Outlier detection for traffic flow analysis
According to Hodge [7], outlier detection methods have been developed in areas such as fraud detection, intrusion, activity monitoring, fault diagnosis satellite image analysis, and among others for many years. More recently, a number of new methods have been developed for fabric defect detection [16,17] as well. However, research in outlier detection directly related to TFA is far and few in between [1,18-20].
In Hodge’s survey [7], outlier detection methods can be classified into 3 categories: unsupervised, supervised and semi-supervised clustering. Park et al. [20] presented a supervised method by applying statistical tests based on two variants of the Mahalanobis distance and empirical cutoff points for 2 datasets. Recently, Barria and Thajchayapong [1] conducted a similar statistical test based on the change of variance in the relative speed of vehicles to detect transient anomalies and incident precursors. Cheng et al. [19] explored spatial-temporal similarities to detect outliers that are regarded as hourly to weekly abnormal flow patterns. Chen et al. [18] compared three outlier algorithms (statistics-based, distance-based, and density based detection) that detect anomalies caused by detection devices or traffic incidents. They argued that the statistical based algorithm was computationally fastest. The density-based algorithm achieved the highest
3
Fig. 2. The proposed modeling for outlier detection.
Fig. 3. Idea map of a 4-arm junction with Entry and Exit traffic data indicated by the arrow in blue and green boxes, respectively.
precision rate, but it was prone to mislabeling some outliers as negatives.
With regard to the effectiveness of outlier detection [1,18,20] directly utilized the original domain of traffic data for outlier detection and only [19] has made an attempt to project the data into the wavelet-based domain for further analysis. Their experimental results show that detection accuracy can be 100% by controlling a cutoff value in [20], or 90% by the density-based approach in [18]. The cutoff value in [20] was manually determined. As the traffic data share many spatial-temporal similarities and the traditional approach of outlier detection cannot resolve signal similarities effectively, it leaves the question of whether a new representation of traffic data, such as a data transformation onto other domains for separating different groups of data, can help in outlier detection with high success rate.
III. MODELING BY DPM FOR OUTLIER DETECTION
The proposed method is depicted in Fig. 2. Purely for convenience without loss of generality, the traffic data collected are firstly interpreted as 8 signals (4 Entry signals and 4 Exit signals). As signals from various sessions have different lengths, we then standardize the signals across different sessions. Afterward, each standardized signal is input to a covariance feature descriptor which is the core part in the Wishart distribution prior in DPM. As this feature descriptor can be in high dimension which depends on the number of cycles, a PCA kernel is employed to reduce its dimension. The reduced signal vector is a subspace representation which is modeled by DPM. Lastly, the outliers are detected by the collapsed Gibbs sampler to classify each input signal.
i. Entry and Exit signals
In our research, the traffic data was obtained from a 4-arm junction with 24 lanes altogether. An idea map is depicted in Fig. 3 for illustration. In the said junction, an Entry signal of a particular arm is defined as the sum of entry volume of vehicles of all four traffic MPs per cycle. Entry signals are denoted as for arms E, S, W, and N, respectively. Similarly, an Exit signal is defined as the sum of exit volume of vehicles of all four MPs per cycle, and is given as for arms E, S, W, and N, respectively. In general, we could represent a set of signals as follows:
Definition 1. Let for be a feature vector of an Entry (or Exit) signal from sessions of observations. A session is composed of cycles and a signal is represented as
{ } , (1)
where is the number of vehicles observed at the cycle, is the number of cycles in the session.
Definition 2. The mean feature vector of an Entry (or Exit) signal of sessions is given by,
∑ . (2) In short, we have feature vectors as ,
, , , for Entry volume per arm per cycle as well as , ,
, , for Exit volume per arm per cycle. Arms , , and of the 4-arm junction are denoted by
, , and , respectively.
ii. Signal standardization
Definition 3. A standardization of the cardinality
| | for one particular signal by taking an argument
{| | } , (3) where is the number of cycles of in the session and
.
There are 62 sessions in our traffic data, hence . The average number of cycles per sessions is 88 and the minimum number of cycle is 80 (i.e. ) in our case. As such, a signal is now denoted by . The truncation of some data points at the end of a feature vector is necessary because the number of cycles varies which could lead to ambiguities in subsequent evaluation.
iii. Input as covariance signal descriptor
Covariance matrix of feature is a popular and effective representation in object detection, texture classification [21], and visual tracking [22]. In this research, we convert the feature vector into a covariance signal descriptor in order to fit the DPMM framework later.
Definition 4. Let , be the feature vector of a signal of sessions, where is the number of cycles. Then, the covariance signal descriptor from a signal in the data is defined by
[ ] ∑ , (4) where is the mean feature vector and is a
symmetric positive definite (SPD) matrix.
iv. Dimension reduction by PCA.
As the dimension of the covariance signal descriptor is chosen to be , it would lead to a very high
4 computational complexity as it is. Principal Component
Analysis (PCA) is chosen here because it performs dimension reduction efficiently [23]. Mathematically, PCA is an orthogonal linear transformation that maps the data to a new coordinate domain. In practice, keeping the first few principal components would be sufficient to represent the original data.
Definition 5. A signal after the PCA process is now expressed as
∑ , (5)
where , is the linear coefficient, is the PCA basis vector and is the dimension to be maintained after PCA. The coefficients can be regarded as
and . The
proposed method eventually clusters the signal into a low dimensionality representation as .
v. Dirichlet Process Mixtures
Definition 6. A DP is a stochastic process and is defined as a distribution over probability measure on an infinite parameter space . The DP has two parameters, a base probability measure, , and a positive scaling parameter . Detailed theory of DP can be found in [6]. A distribution is DP distributed if the relation
, (6) holds for any natural number and partitions
.
In terms of outlier detection, we aim to find the number of clusters in a given traffic data set based on the posterior distribution of from the observations and the prior model . The ideal case is that the distribution over each cluster can be determined automatically. In order to achieve this, the posterior distribution is determined by
| ∑ , (7)
where is the number of observations belonging to each corresponding partition , is the total number of observations and is the delta function at the sample point .
Definition 7. If the DP acts as a conjugate prior for the distribution over distributions, the conjugate priors for the model parameters is a Gaussian distribution prior and a Wishart distribution prior as given below,
⃑ | | , (8)
, (9) where is the abbreviation for
∑ , (10)
∑ (11) where , ∑ are the class distribution parameters, ⃑ ,
are mixture weights. In our case, we assign from the covariance signal descriptor.
Definition 8. Under a parametric family of | the DPM is then modeled for the dependency of to as
| | , | , , (12) where is the likelihood function with the parameters
.Besides, the posterior distribution is given as
⃑
| ∏ | ⃑ ⃑ | (13)
where | = ∏ ( ⃑⃑ | ) , ∏ ( ), denotes the class in which the signal belongs to, and is the hyper-parameters of the Inverse-Wishart prior, which will be investigated in Section IV. The marginal probability of the data in (13) cannot be directly computed. Hence, Gibbs sampling is used to determine a discrete representation of the posterior by the non-Gaussian density. As the number of clusters, , is required to be known, (13) is modified by the nonparametric approach by assuming it is an infinite Gaussian mixture model.
vi. Outlier detection by collapsed Gibbs sampler
In this section, we will show how the outlier detection is formulated and achieved by the collapsed Gibbs sampler.
Definition 9. The conditional distribution of a single class label is known as a Chinese restaurant process (CRP) which is expressed as:
| {
, (14)
where ∑ is the number of items in
class , is the number of non-empty groups in the clustering, .
Definition 10. In order to classify each signal to a class, the posterior density is computed by the collapsed Gibbs sampler, which offers a faster convergence, and can be expressed as
| ∫ |
∫ | . (15)
Definition 11. The class label updates are defined as
| ( | )
| , (16)
where means to neglect from the set . To determine whether for of the session is inside or outside a normal group after Gibbs sampling, two assumptions are made:
(1) as more than one group of clustering exits; (2) The normal group should be the majority, meaning
that it has the maximum number of elements.
5
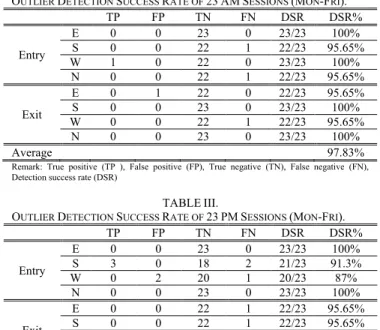
Session 2 Session 4 Session 6 Session 8
Session 14 Session 16 Session 18 Session 20
Session 22 Session 28 Session 30 Session 32
Session 34 Session 36 Session 42 Session 44
Session 46 Session 48 Session 50 Session 56
Session 58 Session 60 Session 62
Fig. 5. Signals of Exit N from 23 PM sessions. Anomalies are identified in Sessions 8, 28, and 50 (shown in red color). x-axis is Cycles and y-axis is number of vehicles.
TABLE I.
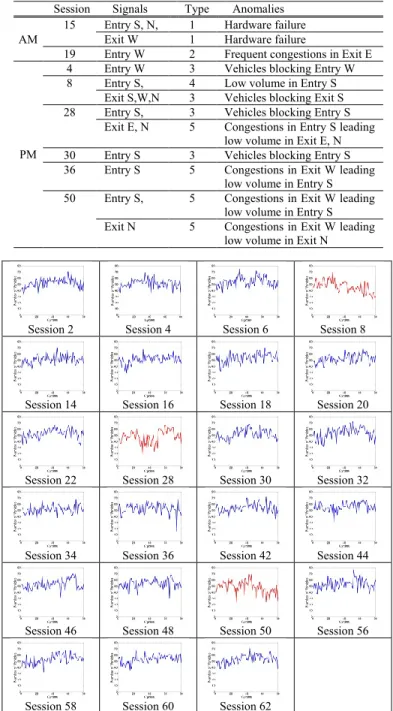
LIST OF ABNORMAL SESSIONS AND THEIR CORRESPONDING ANOMALIES. Session Signals Type Anomalies
AM
15 Entry S, N, 1 Hardware failure Exit W 1 Hardware failure
19 Entry W 2 Frequent congestions in Exit E
PM
4 Entry W 3 Vehicles blocking Entry W 8 Entry S, 4 Low volume in Entry S
Exit S,W,N 3 Vehicles blocking Exit S 28 Entry S, 3 Vehicles blocking Entry S
Exit E, N 5 Congestions in Entry S leading low volume in Exit E, N 30 Entry S 3 Vehicles blocking Entry S 36 Entry S 5 Congestions in Exit W leading
low volume in Entry S 50 Entry S, 5 Congestions in Exit W leading
low volume in Entry S Exit N 5 Congestions in Exit W leading
low volume in Exit N
Fig. 4. Clustering result of data points from the signal of Exit N. Blue circles represent the majority group and classified as inliers, whereas the red asterisk, cross and square represent the minority groups and classified as outliers. The x-axis and y-axis are coefficients and from PCA, respectively, where .
Theorem 12. Suppose there are classes of signals after the collapsed Gibbs sampling, in which contains some class labels . The normal group of signals is determined by | | where | | is the number of data points from signals in class . This major group of data points is called the inliers. Otherwise, all the remaining groups of signals are classified as abnormal and whose data points are called the outliers.
Proof. It can be deduced from Definitions 9, 10 and 11. Fig. 4 depicts an example the clustering result of the signal from Exit N. The blue circles represent the majority (normal) group and classified as inliers, whereas the red asterisk, cross and square represent the minority (abnormal) groups and classified as outliers.
IV. PERFORMANCE EVALUATION
The traffic video data was recorded and inspected by eleven inspectors and a detailed corpus was manufactured. The inspectors worked in shift and were divided into two teams. Vehicle counting was performed by all inspectors and quality control was carried out in order to keep the error rate less than 3%. After vehicle counting, a corpus was produced. In the corpus, traffic volume, vehicle types, incidents and congestions in all sessions were carefully recorded and remarked. The numbering of the AM and PM sessions are labeled by an alternate ascending order, i.e. Session 1 (AM), Session 2 (PM), …, Session 61 (AM) and Session 62 (PM). In brief, the total number of vehicles in all 62 sessions is 764,027, in which 312,333 vehicles were detected in the AM sessions possess and 451,694 vehicles were detected in the PM sessions possess.
A. General results
Out of the 62 sessions, the dataset consists of three groups: (1) 46 sessions from Monday to Friday, (2) 8 sessions from Saturday, and (3) 8 sessions from Sunday. As the majority of traffic data is from Monday to Friday, we choose this group for the evaluation. Table I tabulates the details of abnormal sessions and their corresponding anomalies. Fig. 5 depicts the samples of signals of Exit N from 23 PM sessions, in which anomalies are manually identified in Sessions 8, 28, and 50. Five types of
anomalies are listed: Type 1: Hardware failure; Type 2: Frequent congestions in an Entry/Exit; Type 3: Vehicles blocking an Entry/Exit; Type 4: Low volume in an Entry/Exit; Type 5: Congestions in an Exit/Entry leading to low volume in other Entry/Exit.
The success rate of outlier detection is measured by the following metrics: true positive (TP), false positive (FP), true negative (TN), false negative (FN), and detection success rate (DSR). The detection success rate is defined as
6
TABLE III.
OUTLIER DETECTION SUCCESS RATE OF 23 PM SESSIONS (MON-FRI).
TP FP TN FN DSR DSR% Entry E 0 0 23 0 23/23 100% S 3 0 18 2 21/23 91.3% W 0 2 20 1 20/23 87% N 0 0 23 0 23/23 100% Exit E 0 0 22 1 22/23 95.65% S 0 0 22 1 22/23 95.65% W 0 0 22 1 22/23 95.65% N 3 0 20 0 23/23 100% Average 95.65%
Remark: True positive (TP ), False positive (FP), True negative (TN), False negative (FN), Detection success rate (DSR)
TABLE II.
OUTLIER DETECTION SUCCESS RATE OF 23 AM SESSIONS (MON-FRI).
TP FP TN FN DSR DSR% Entry E 0 0 23 0 23/23 100% S 0 0 22 1 22/23 95.65% W 1 0 22 0 23/23 100% N 0 0 22 1 22/23 95.65% Exit E 0 1 22 0 22/23 95.65% S 0 0 23 0 23/23 100% W 0 0 22 1 22/23 95.65% N 0 0 23 0 23/23 100% Average 97.83%
Remark: True positive (TP ), False positive (FP), True negative (TN), False negative (FN), Detection success rate (DSR)
In the first evaluation, the hyper-parameters of the conjugate priors are set as follows. The mixture weights of the normal group and the abnormal group are chosen arbitrarily as , , respectively. The other are , [ ], , as the initial setting. The number of iterations for the collapsed Gibbs sampler is 300, for which any number greater than 100 is empirically found to be stable for Gibbs sampling. The dimension to maintain in PCA is 2. Tables II and III list the outlier detection success rates of 23 AM and PM sessions, respectively. The average DSR of 23 AM sessions (Mon-Fri) is 97.83% while the average DSR of 23 PM sessions is 95.65%. The overall average DSR of both the AM and PM sessions is 96.74%. As other traffic databases are not available for a performance comparison, our database with 764,027 vehicles is believed to be fair and justified for the evaluation.
V. CONCLUSION
From the performance evaluation in Section IV, the proposed DPM method offers a high detection success rate of 96.74% in the real-world traffic data. It is generic, unsupervised and fast for outlier detection. As we utilized the traffic data (i.e. volume signal) and demonstrated the modeling by DPM, we believe that other spatial-temporal traffic data, such as travel times, speeds and queue lengths, can equally be modeled by DPM under the same theoretical framework. The future work include several areas: First, the evaluation of the proposed method can be extended to the entire road network. As outliers can occur in any junctions, outlier detection for the entire network is equivalent to individual outlier detection in each junction under a simultaneous schedule. Second, it is suitable for offline detection and we would extend to the online
detection in future. Third, we could design other metrics for the outlier detection in order to improve the result. We believe this work will facilitate real time traffic data storage and anomalies detection in the long run.
ACKNOWLEDGMENT
This work was supported by a grant from the Research Grant Council of the Hong Kong Special Administrative Region, China, under Project HKU754109.
REFERENCES
[1] J.A. Barria and S. Thajchayapong, “Detection and Classification of Traffic Anomalies Using Microscopic Traffic Variables,” IEEE Trans. Intell. Transport. Sys., vol. 12, no. 3, pp. 695-704, 2011. [2] J. Hu, Y. Wang, Z. Zhang and D. Li, “Analysis on Traffic Flow Data
and Extraction of Nonlinear Characteristic Quantities,” IEEE 13th
Int’l Conf. Intell. Transport. Sys, pp. 712-717, 2010.
[3] G. Zhang, Z. Zhou and H. Zhou, “The High Frequency Traffic Flow Analysis,” IEEE 2nd ISCID, pp. 221-224, 2009.
[4] S. Tang, H. Gao, “Traffic-incident Detection-algorithm based on Non-parametric Regression,” IEEE. Trans. ITS, 6(1), 38-42, 2005. [5] M. Schober and J. Meier, “An Innovation-based Approach to Timely and Robust Automatic Highway Incident Detection,” Proc. 11th
Int’l IEEE Conf. Intell. Transport. Sys, pp. 340-345, 2008. [7] V.J. Hodge, “A Survey of Outlier Detection Methodologies”,
Artificial Intelligence Review, vol. 22, no. 2, pp. 85-126, 2004. [6] T. Ferguson, “A Bayesian Analysis of Some Nonparametric
Problems,” The Annals of Statistics, vol.1, no.2, pp. 209-230, 1973. [8] D.M. Blei and M.I. Jordan, “Variational Inference for Dirichlet
Process Mixtures,” Bayesian Analysis,vol.1,no.1,pp.121-144, 2006. [9] M. Shimosaka, T. Ishino, H. Noguchi, T. Sato and T. Mori,
“Detecting Human Activity Profiles with Dirichlet Enhanced Inhomogeneous Poisson Processes,” ICPR, pp. 4384-4387, 2010. [10] M. Davy and J-Y. Tourneret, “Generative Supervised Classification
Using Dirichlet Process Priors,” IEEE Trans. Pattern Analysis & Machine Intelligence, vol. 32, no. 10, pp. 1781-1794, 2010. [11] X. Li, W. Hu, Z. Zhang, X. Zhang and G. Luo, “Trajectory-based
Video Retrieval Using Dirichlet Process Mixture Models,” Proc. BMVC, 2008.
[12] F. Wood, M.J. Black, “A Nonparametric Bayesian Alternative to Spike Sorting,” J.Neuroscience Methods, 173(1), pp. 1-12, 2008. [13] K. Kurihara, M. Welling and Y.W. Teh, “Collapsed Variational
Dirichlet Process Mixture Models,” IJCAI, pp. 2796-2801, 2007 [14] X-X. Zhang, H. Liu, Y. Gao and D. H. Hu, “Detecting Abnormal
Events via Hierarchical Dirichlet Processes,” PAKDD 2009, LNAI 5476, pp. 278-289, 2009.
[15] Y-D. Jian and C-S. Chen, “Two-View Motion Segmentation with Model Selection and Outlier Removal by RANSAC-Enhanced Dirichlet Process Mixture Models,” Int. J. Comput. Vis., vol. 88, pp. 489-501, 2010.
[16] H.Y.T. Ngan and G.K.H. Pang, “Regularity Analysis for Patterned Texture Inspection,” IEEE Trans. Automation Science & Engineering, vol. 6, no. 1, pp. 131-144, 2009.
[17] H.Y.T. Ngan, G.K.H. Pang and N.H.C. Yung, “Performance Evaluation for Motif-based Patterned Texture Defect Detection,” IEEE Trans. Autom. Sci. Eng., vol. 7, no.1, pp. 58-72, 2010. [18] S. Chen, W. Wang and H. van Zuylen, “A Comparison of Outlier
Detection Algorithms for ITS data,” Expert Systems with Applications, vol. 37, pp. 1169-1178, 2010.
[19] Y. Cheng, Y. Zhang, J. Hu, L. Li, “Mining for Similarities in Urban Traffic Flow Using Wavelets,” Proc. IEEE ITSC,pp.119-124, 2007. [20] E.S. Park, S. Turner and C.H. Spiegelman, “Empirical Approaches
to Outlier Detection in Intelligent Transportation Systems Data,” Transportation Research Record, 03-2990, pp. 21-30, 2003. [21] O. Tuzel, F. Porikli and P. Meer, “Region Covariance: A Fast
Descriptor for Detection and Classification,” ECCV, pp. 3417-3418, TR2005-11, 2006.
[22] F. Porikli, O. Tuzel and P. Meter, “Covariance Tracking Using Model Update Based on Lie Algebra,” CVPR, pp.728-735, 2006. [23] T. Tanaka, “Generalized Subspace Rules for On-line PCA and their
Application in Signal and Image Compression,” Proc. IEEE ICIP, pp. 1895-1898, 2004.