COMPARATIVE ADVANTAGE IN CHEAP ENERGY Seeraj Mohamed
Table of Contents
1 Introduction... 1
2 The importance of coal for the SA energy sector and energy consumers ... 2
3 Issues related to coal dependence... 6
3.1 Environmental and health... 7
3.2 Fiscal ... 9 3.3 Influence on investment ...10 4 Policy ...12 5 Conclusion...14 6 References...15
List of figures
Figure 1: Direct coal use by sector in 1993 (percentages)………...… 4Figure 2: Coal conversion in 1993 percentages)………...… 4
Figure 3: Total electricity production and electricity produced from coal (1981-95)………. 5
Figure 4: Electricity costs as a percentage of value added for manufacturing and selected energy intensive sectors……… 5
Figure 5: Capital to labour ratio for manufacturing and selected energy-intensive sectors………. 6
Figure 6: Exports as a percentage of production for manufacturing and selected energy intensive sectors (1972-93)………. 9
1 INTRODUCTION
South Africa is one of the most energy intensive countries in the world.1 This
energy-intensity is due to reliance on coal for producing electricity and liquid fuels and because of the structure of the economy. Cheap energy, especially low cost electricity, has been an emphasis of government and business throughout the industrialisation of South Africa. The reliance on coal ties in with the concept of a minerals-energy complex (MEC), as a system of accumulation, which has influenced the structure of the South African economy. The dependence on cheap energy is still present. Important sections of government and business continue to emphasise the need for cheap energy. For example, Eskom has committed itself to reduce the real price of electricity.
Cheap energy is considered to be a comparative advantage for South African industry. However, there are a number of costs to society related to the production and
consumption of cheap energy. This paper will consider some of the significant costs associated with having an economy dependent on coal and cheap electricity:
• Environmental and health;
• The costs of maintaining a low electricity price; and
• Effects on investment choices
The benefits of having low cost energy are disproportionately enjoyed by a small group of energy-intensive sectors. These are sectors involved in processing-types of
production, especially first stage beneficiation of raw materials. A large proportion of the energy-intensive sectors’ products is exported. The linkages between these sectors and the rest of manufacturing in South Africa are weak and the benefits are not significantly enjoyed by down-stream manufacturing sectors. On the other hand all of South African society bear the costs associated with dependence on coal for energy and the impact it has on the structure of the economy.
This paper does not directly argue for increased prices or reduced coal power generation. It says that there are inevitably going to be trade-offs but they have to be understood and quantified. Policy-makers need to understand the costs and the benefits
to society related to the exploitation of cheap coal for energy. This paper aims to
contribute to the discussion and to make a case for resources to be made available for research on this subject.
2 THE IMPORTANCE OF COAL FOR THE SA ENERGY SECTOR
AND ENERGY CONSUMERS
I concentrate on energy use in the manufacturing sector and use the iron and steel basic industries (SIC 371) and the non-ferrous metal basic industries (SIC 372) as examples of energy intensive manufacturing sectors.2 I focus on coal and coal derived sources of
energy because it forms the bulk of energy consumed in South Africa. I ignore the transportation sector and crude oil. Crude oil’s product, petroleum products, is used essentially in transport with a small percentage used in industry for heating and some mechanical applications. A significant proportion of petroleum products is derived from coal through the Sasol group’s synfuel process.
Most of South Africa’s primary energy consumption is from coal. Between 1981 and 1993 coal as a percentage of total primary energy consumption ranged from 72% to 78% averaging 76% over that 13-year period. Over the same 13-year period an
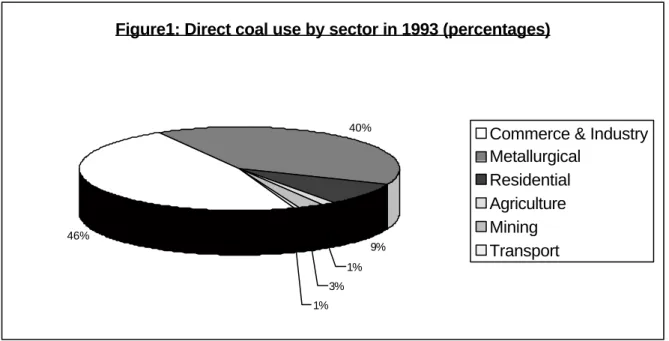
average of 82% of this domestically consumed coal was converted and 18% was used directly in industry, households and the transportation sector. Of the energy used directly by end-users an average of 48% over the same 13-year period was consumed by commerce and industry, 37% in the metallurgical sector and 3% in transport (see figure 1 below).
1
See for example: the World Bank’s World Development Report 1991 and Dutkiewicz and De Villiers 1993.
2
The iron and steel basic industries (SIC 371) and the non-ferrous metal basic industries (SIC 372) are two important sectors who benefit from South Africa’s comparative advantage in cheap energy. These 2 sectors have accounted for about 10% of total manufacturing production and about 30% of manufactured exports since the id-1980s. They are also single subsectors sectors according to the SIC classification and hence easier to work with at a more aggregated level. Many of the other energy-intensive sectors like chemicals and food have subsectors with different degrees of energy intensity.
Source: Department of Mineral and Energy Affairs (1995)
Eskom power generation and Sasol are the major converters of coal (see figure 2 below). Of the coal converted over the 13-year period 1981-93 an average of 69% was used in power generation and an average of 31% was used by Sasol. A small amount was converted into town gas but this is negligible. Sasol uses coal for
producing non-energy products such as chemicals and chemical gas. Over the 12-year period 1981-1992 an average of 9% of coal used by Sasol was for non-energy
products, and an average of 89% was used for producing energy products, the rest was energy losses in the conversion process.
Source: Department of Mineral and Energy Affairs (1995)
Figure1: Direct coal use by sector in 1993 (percentages)
46% 40% 9% 3% 1% 1%
Commerce & Industry Metallurgical
Residential Agriculture Mining Transport
Figure 2: Coal conversion in 1993 (percentages)
electricity 65% town gas 0% sasol 35% electricity sasol town gas
Source: Department of Mineral and Energy Affairs (1995)
Eskom produces about 92% of electricity using coal (see figure 3 above). This figure was as high as 98% before nuclear generation was introduced in 1986. From 1981 to 1995, the amount of electricity used in industry dropped from 33% of total electricity sold
to 28%. The amount of electricity used in mining dropped faster from Source: Eskom (1995b) and Industrial Development Corporation (1995)
Figure:3 Total electricity production and electrcity produced from coal (1981-95) 0 20000 40000 60000 80000 100000 120000 140000 160000 180000 1981 1982 1983 1984 1985 1986 1987 1988 1989 1990 1991 1992 1993 1994 1995 GWh Year from coal total F i g u r e 4 : E l e c t r i c i t y c o s t s a s a p e r c e n t a g e o f v a l u e a d d e d f o r m a n u f a c t u r i n g a n d s e l e c t e d e n e r g y i n t e n s i v e s e c t o r s 0% 5% 1 0 % 1 5 % 2 0 % 2 5 % 3 0 % 1983 1984 1985 1986 1987 1988 1989 1990 1991 1992 1993 Y e a r Electrcity costs as a
percentage of value added
T o t m a n B a s i c I & S non-ferr
29% to 20%. While the amount sold to redistributors increased from 32% to 43%. The production of basic iron and steel, basic precious and non-ferrous metals and other non metallic products accounted for 52% of electricity consumed in industry,
this percentage climbed to 60% by 1990 and then reduced to 58% by 1995. Mineral processing industries account for a major portion of electricity consumed and directly consumed coal.
Electricity is a very important input for energy intensive industries. From the graph above (see figure 4) it is clear that electricity forms an important part of the value–added to energy intensive products and substantially less so for the manufacturing industry taken as a whole.
Source: Industrial Development Corporation (1995)
In the graph above it can be seen that the capital to labour ratio for the iron and steel and non-ferrous metals sectors are significantly higher than for the manufacturing sector as a whole. The reason for this is that these sectors are processing sectors that require large physical inputs but little labour or human capital inputs.
The technology and know-how are embedded within the physical capital (machinery and equipment). In other sectors of manufacturing not based on process-type technologies
F i g u r e 5 : C a p i t a l t o l a b o u t r a t i o f o r m a n u f a c t u r i n g a n d s e l e c t e d e n e r g y - i n t e n s i v e s e c t o r s 4 0 , 0 0 0 9 0 , 0 0 0 1 4 0 , 0 0 0 1 9 0 , 0 0 0 2 4 0 , 0 0 0 2 9 0 , 0 0 0 3 4 0 , 0 0 0 1972 1974 1976 1978 1980 1982 1984 1986 1988 1990 1992 Y e a r
Capital-labour ratio (R1000 per worker)
t o t a l m a n Non-ferrous I r o n & S t e e l
less of the technology and know-how is embedded in the physical capital and more with the labour or human capital input. A fundamental difference for the structure of the economy is whether investment goes into developing capital intensive projects or projects requiring a larger proportion of labour and human and human capital.
3 ISSUES RELATED TO COAL DEPENDENCE
Coal has not received the recognition it deserves in literature dealing with the process of industrialisation in South Africa. The growth of the mining industry, the development of the railways and large state owned industries, like Iscor, grew in tandem with a cheap electricity emphasis by government that was possible because of the exploitation of cheap coal reserves. However, there are studies that have included energy as an important element in their analysis. Christie (1984) argues that there is a direct
relationship between capital’s need to control labour and the decisions taken about the development of electricity supply industry (ESI) within the industrialisation process. His book shows the link between the development of the ESI and investment patterns in industry. Rustomjee (1994) identifies the Minerals-Energy Complex (MEC), described as a system of accumulation, as a central element for interpreting the trajectory of industrialisation of the South African economy after World War I. He argues:
The South African economy’s current strength lies in what is termed a Minerals-Energy Complex, which includes mining, energy and a number of associated sub-sectors of manufacturing. These sectors have constituted and continue to constitute the core site of accumulation in the South African economy. (p.13)
Cheap power has been a significant element of the approach of government and business to industrial development, since the installation of generation capacity by the mining industry in Kimberley and later in Johannesburg. This cheap electricity has attracted significant investment in energy intensive, processing sectors of manufacturing like minerals processing, pulp and paper, and chemicals. Today, it continues to be an important factor for many in business and government when thinking about investment. Conventional wisdom abounds about South Africa’s cheap energy comparative
high wages, low skills, distance from markets, etc., cheap electricity is probably the only
comparative advantage that South Africa has”.
It will be shown below that there are a number of costs borne by South African society as a whole related to the use of coal for energy. Those benefiting from the use of coal most do not bear their fair share of the costs. Most of these costs are not easily quantifiable and quantification is not attempted in this paper. It should be the subject of research, in an attempt to clarify whether the current approach to coal mining and conversion and electricity consumption within the South African government’s energy policy and industrial strategy is correct.
3.1 Environmental and health
Generating electricity from coal causes more pollution than other forms of power generation (see Van Horen, 1997, for a more complete and quantified examination of this issue). The effects on the environment and health should be measured starting at the coal mine through to the consumption of electricity. South Africa has a high death and injury rate in the coal mining industry relative to other countries. Coal mining leads to air and water pollution. Using coal to generate electricity causes air and water pollution. Air pollution leads to respiratory and other illnesses, in some cases the effects are fatal. There are also acidification and visibility effects. At a global level there is an impact on global warming through the release of greenhouse gases.
The costs to society are not completely included in the electricity tariff. Van Horen (1997) estimates the level of environmental externalities as a percentage of Eskom’s average tariffs in 1994, for potentially serious environmental impacts for which sufficient information exists, to estimate their economic value. He says that the value of
environmental externality costs related to coal generation, excluding the fiscal subsidy to the nuclear industry, have a low estimate of about 18% a middle estimate of about 67% and a high estimate of about 105% of Eskom’s average tariff.
Source: Industrial Development Corporation (1995)
The externality costs that can be calculated based on available information are clearly significant. The benefits to society from having a cheap coal powered electricity industry are skewed towards the large industrial users. Fine and Rustomjee (1997) demonstrate that the linkages in South Africa between the MEC sectors and the rest of the economy are weak. In other words, downstream manufacturers do not have adequate access to the benefits of cheap energy by way of utilising the inputs of the energy intensive sectors. A large share of the products of the energy intensive sectors is exported and importing countries enjoy the benefits but not costs associated with cheap energy inputs (see figure 6 above). However, those sectors of South African society that are not large-scale users of electricity are exposed to a disproportionately large proportion of the external costs of producing electricity from coal. This uneven burden of costs may be thought of as either a tax on society or cross-subsidy from the rest of society to large-scale electricity users.
Figure 6: Exports as a percentage of production for manufacturing and selected energy intensive sectors (1972-93)
0 5 10 15 20 25 30 35 40 45 50 1972 1973 1974 1975 1976 1977 1978 1979 1980 1981 1982 1983 1984 1985 1986 1987 1988 1989 1990 1991 1992 1993 Year
Exports as a percentage of production
Total manufacturin g
Iron and steel
Non-ferrous metals
3.2 Fiscal
One of the reasons Eskom is able to keep electricity prices low is because they earn a lower real rate of return on their assets than private sector investors do.3 Eskom is a totally publicly owned utility and the lower rate of return may be thought of as a reduction in the overall revenue of the state.4 The lower earnings to Eskom are an additional cost related to cheap electricity that is not borne evenly by society and that benefit the large-scale electricity consumers to the detriment of the rest of society.
According to the “Chairman’s” report in the 1995 Eskom Annual Report, “Eskom is committed to being the world’s lowest-cost electricity producer”. Eskom committed itself to reduce the real price of electricity by 20% between 1992 and 1996 and then in 1994, undertook to reduce the real price of electricity by 15% by the year 2000 (p.9, Eskom, 1995 Annual Report). According to their 1995 Annual Report, Eskom has had a 10% -11% rate of return on their assets. This return is based on the historic costs of their assets but they also report a 3-4% rate of return on revalued asset. The 10-11% rate of return would be at the low end demanded by private investors in generation plants. The 3%-4% real rate of return on revalued assets is much lower than the 10% rate of return the World Bank has suggested public utilities make on investment in power projects and way below what private sector producers are prepared to invest in. Eskom’s rate of return is also lower than the international interest rates, which is seen as a negative factor for many developing countries attempting to finance electricity projects in international markets.5
The South African government has been accepting a lower rate of return on their power assets because they have seen electricity as important for industrial development.
3
I am indebted to Mark Davis of the Energy and Development Research Centre for pointing out that Eskom’s rate of return on revalued assets is as low as 3-4% which, is much lower than the returns investors in independent power producers are prepared to accept. Many international utilities do use historical costs when calculating their rate of return. However, the cost of replacement of assets is seen as a better way to calculate rates of return because it helps to ensure that the electrcity tariff is based on long run marginal costing principles.
4
Eskom has not paid taxes so their lower revenues may not have directly deprived the fiscus of revenue but its revenue would form a part of the state’s assets.
5
For more detail on rates of return in power projects see Schramm (1991) (Gunter Schramm, is an energy adviser in the World Bank’s Industry and Energy Department.) and Eberhardt et al (1993).
However, this sort of “subsidy” has benefited the large users much more than small users. It is said, within conventional international economics, that a subsidy to one sector is a tax to another sector. The applicability of this assertion needs to be explored with regard to cheap electricity in South Africa.
3.3 Influence on investment
Eskom, as a state owned utility, has played an important role as a borrower in the local and international financial markets. In the 1970s, despite the energy crisis Eskom overestimated, through poor forecasting methods, that the demand for electricity would increase substantially. No doubt, the emphasis on cheap energy influenced plans to increase capacity substantially. The current generation over-capacity is a result of this poor planning. During this period the state was borrowing heavily abroad for energy projects such as Koeberg and Sasol. Public sector borrowing related to the MEC may have crowded out investments in other sectors, especially those by private-sector investors. Horwitz (1994, p26) says that between 1973 to 1976 public sector borrowing accounted for 96.7% of the total influx of foreign borrowing. Public sector foreign
borrowing led to the balance of payments deficit exceeding 5% in 1976 and foreign banks grew reluctant to lend to South Africans. Notwithstanding, Eskom continued raising money in foreign markets to go ahead with building Koeberg and other power stations. By 1990, due to its programme to increase capacity Eskom, had a foreign debt of R7.4 billion, about 45% of total public sector foreign debt and 16% of South Africa’s total foreign debt (Horwitz, 1994, p30). In short, the emphasis to provide cheap electricity played an important role in crowding out other investments and also
contributed to the poor performance of the South African economy in the 1980s. The scheme to provide abundant cheap electricity has had costs that were borne by the entire economy.
The role of the state in supporting the energy sector and cheap energy corresponds with the story Rustomjee (1993) develops around the importance of the MEC as a system of accumulation in affecting industrial policy and directing investment towards energy-intensive, resource based activities. Rustomjee (1993) argues that there were three
instruments of post-war industrial policy: the creation of state corporations and joint ventures with private capital; extensive use of tariffs and industrial decentralisation. He says that the conduct of these policies “has been mediated by the role of the MEC as a system of accumulation”. He argues that the MEC led to policies which supported its sectors but impeded policies that may have led to diversification away from
dependence on South Africa’s resource base (p. 211). The emphasis on cheap energy, specifically electricity, is another of the policy instrument that have been used by the MEC to support its sectors.
The graph above (figure 6) shows that the iron and steel and non-ferrous metals sectors of manufacturing export a much larger proportion of their outputs than the manufacturing sector as a whole. Cheap energy plays an important role in this. These commodity-based industries like iron and steel and non-ferrous metals that are dependent on cheap energy are more prone to be affected by rollercoaster movements in commodity prices. Downstream manufacturing sectors, that are less dependent on cheap electricity inputs, have products that are less prone to price fluctuations in the world market. In other words, the choice of policies, including and supported by a policy to have cheap and abundant electricity has perpetuated the vulnerability of the South African economy to the instability of international commodity markets.
An area that requires further research is the effect on human resource development and technology choice that policies, including cheap energy policy, have had in directing investment towards resource-based, capital-intensive projects away from potentially more labour intensive or skills intensive sectors. This would include research on whether the availability of cheap energy has affected investment by downstream manufacturing industries away from relatively energy-efficient machinery and equipment, and possibly more labour-intensive types of investment. Scerri (1990) finds:
Net exports of South African manufacturing industries are positively related to physical capital and negatively related to human capital…. South African manufacturing enjoys a comparative advantage with respect to goods embodying physical capital and labour and exhibits a comparative disadvantage with respect to embodying human capital. (p346)
The graph above (figure 6) comparing exports by the manufacturing sector as a whole and the iron and steel and non-ferrous metals sectors illustrates Scerri’s findings. The capital-intensive, energy and resource-dependent sectors utilise more physical capital. The down-stream manufacturing sectors utilise a larger proportion of human capital. The crowding out of investment in the past and the continued central role of the MEC may be excluding investment from areas where human capital and know-how can be developed. The development of know-how is important for increased total factor productivity in an economy. 6
4 POLICY
The message by government regarding cheap coal and electricity remains unclear, probably because policy-makers are unsure about the related costs and benefits. Policy is based on scant evidence and, therefore, is not clearly articulated and fudged. The Draft Energy White Paper released by Department of Mineral and Energy (DME) in June 1998 provides an example of ambiguous policy. It says, “whilst cheap energy is a comparative advantage for South Africa’s major foreign exchange earners, there are concerns that the production and use of energy has harmful environmental and health impacts, the costs of which are not included in the price of energy”. DME also
recognises that exports may be affected because of changing international
environmental standards” (p. 20). The phrasing (“there are concerns”) of this sentence shows how unclear DME is about the health and environmental impacts. They cannot make a strong enough argument about the costs and benefits of cheap energy. This is exacerbated by pressure from organised sections of energy-intensive industries to maintain low energy prices. Therefore, they mention the effects that changing
international environmental standards will have on trade. The DME resorts to arguing that something may have to be done in the future because there is a threat from outside rather than acknowledging that this is a South African problem and offering leadership in addressing it. The solution offered by the DME, without explaining how, is to promote energy efficiency. They also say that they will work with other departments to try and reduce environmental impacts.
6
Energy efficiency does have a role to play but offering it as a solution misses the point. South Africa is an energy intensive country because conditions have favoured the development of significant energy intensive sectors in manufacturing and mining. The energy intensive sectors usually compete internationally with firms that also have low energy prices. As a result, these sectors are usually more efficient users of energy than sectors where energy inputs form a smaller proportion of costs. For example, Alusaf’s Bayside aluminium smelter requires a great deal of electricity, probably about as much as the city of Durban. The process used to produce aluminium is amongst the most efficient in the world. Generally, aluminium producers use similar technologies and their relative competitiveness is based on the price of their electricity input. In other words, South Africa would continue to remain dependent on cheap energy even if it had a very efficient energy efficient manufacturing sector.
Another weakness with offering the promotion of energy efficiency as a solution by the DME is that the costs to the South African society resulting from dependence on cheap energy by energy-intensive sectors of the economy are not limited to environmental and health impacts or the threat of international environmental standards affecting trade. The costs are related to the type of productive sector that has developed and the continuing incentives for investing in energy/capital intensive sectors. The cheap electricity
produced by a state owned enterprise provides uneven benefits to the energy intensive sector.
The draft energy white paper has a section called “vision for the electricity sector” that proposes a series of measures for the restructuring of the ESI. It says that the outcome of the restructuring should be an ESI that “is capable of being the engine for growth, development and prosperity for South Africa”. While this may be just be rhetoric meant for a section on “the vision”, the implications of a vision that sees the electricity sector as the engine for growth and development of the economy should be thought through more carefully.
5 CONCLUSION
South Africa has a comparative advantage in cheap energy. However, there are costs to society and potential effects of the structure of the economy that may result because of this comparative advantage. The comparative advantage is a result of things like external costs to the environment not included in the cost of electricity tariffs and
subsidies to electricity consumers because Eskom has a low rate of return on its assets.
Van Horen (1997) argues that the short-term demand is not responsive to changes in the energy price because it is difficult to switch to different fuels or change production processes. In the long run demand may be more elastic to price changes and the types of investments made, technologies chosen and factors of production favoured are likely to be affected by energy prices.
The benefits from the energy-intensive sectors are significant, especially when considering exports. It is necessary to calculate the costs and other effects on the economy that result from policy to support these industries through provision of cheap energy. Once adequate information on the costs and benefits is available policy-makers will be able to take decisions and embark on actions that optimise the benefits for the whole of South African society. In parallel to this, measures to improve the linkages between the MEC sectors and the rest of the economy should be embarked upon.
6 REFERENCES
Christie, R (1984), Electricity, Industry and Class in South Africa, Macmillan Press Ltd, London.
Department of Mineral and Energy (1998), Draft Energy White Paper, DME, Pretoria.
Department of Mineral and Energy Affairs (1995), South African Energy Statistics 1950 -1993: Number 2, Department of Mineral and Energy Affairs, Pretoria.
De Villiers, M.G. and R.K. Dutkiewicz (1994), A Strategic Plan for Improved Industrial Energy Effectiveness in South Africa, Report by the Energy Research Institute (University of Cape twon) for the Department of Mineral and Energy Affairs, Report Number GEN:169,
Eberhardt, A., B Mountain, M. Pickering, and C. van Horen (1993), Electrification financing anf tariffs: International Literature Review, produced for the Working Group on Finance and tariffs of the National Electrification Forum. (papers produced for the National Electrification Forum are available from the National Electricity Regulator, Sandton).
Eskom (1995), Annual Report 1995, Eskom, Megawatt Park, Sandton.
Eskom (1995b), Statistical Yearbook 1995, Eskom, Megawatt Park, Sandton.
Fine, B and Z Rustomjee (1997), South Africa’s Political Economy: From Minerals-Energy Complex to Industrialisation, Wits University Press: Johannesburg.
Horwitz, R.B., (1994), “Pubic Sector Policy and the Electricity Industry”, a paper produced for the South African Energy Policy Research and Training Project at the Energy for Development research Centre, University of cape Town.
Industrial Development Corporation (1995), Sectoral Data Series: Manufacturing, Industrial Development Corporation of South Africa, Sandton.
Rustonmjee, Z.Z., The Political Economy of South African Industrialisation – the Role of the Minerals-Energy Complex, PhD Thesis, School for Oriental and African Studies, University of London.
Scerri, M. (1990), R&D and the international competitiveness of the South African manufacturing sector, in The South African Journal of Economics, Vol. 58, no. 3, pages 341-356.
Schramm, G. (1991), Issues and Problems in the Power Sectors of Developing Countries, a background paper prepared for the Stockholm Initiative on energy, Environment and Sustainable Development (SEED).
Van Horen, C (1997), Cheap Energy - at Which Cost?: Externalities in South Africa’s Electricity in L. Bethlehem and M. Goldblatt (eds), The Bottom Line: Industry and Environment in South Africa, International Development Research Centre (Canada) and University of Cape Town Press, Cape Town.
World Bank (1992), World Development Report 1992: Development and the Environment, Oxford Press, New York, NY.