Diabetic Retinopathy Detection & Segmentation Using Color Image Processing Kaushick Parui1, B. K. Tripathy2
1Department of Physics, School of Advanced Sciences, VIT University. 2SITE, VIT University, Vellore, Tamil Nadu, 632014, India.
1[email protected], 2[email protected] Abstract
Diabetic Retinopathy has become a serious issue in the recent past being one of the primary causes for the loss of vision in diabetic patient. The primary motive of this project is to develop an automated technique for the detection of diabetic retinopathy using fundus images. This project involves the processing of the fundus images especially for the detection of diabetic retinopathy which is confirmed by the presence of microaneurysms, exudates, etc. Here, a novel approach has been adopted to perform image segmentation of all these visible stages in case of diabetic retinopathy and not only determine the stage of diabetic retinopathy but also give some more insights related to the disease. This project is completely done by utilizing the tools of Color Image Processing Viz. Segmentation technique, CLAHE technique, morphological operations, etc. Later, a comparative test was performed to test the correctness of the algorithm using various Diabetic Retinopathy Fundus Images & Normal Fundus Images. The algorithm seems to be at par with other approaches used in the modern world today to solve the problem of Diabetic Retinopathy and enables speedy diagnosis by doctors.
Indexing terms/Keywords: Diabetic Retinopathy, Morphological Operations, Color Image Processing, Segmentation, CLAHE.
Introduction
Diabetes is the chronic disease which affects the metabolism in the body leading to high blood sugar level. Apparently, Diabetic Retinopathy (DR) is the effect of diabetes, particularly on the retina which eventually leads to blindness. Diagnosis of Diabetic Retinopathy are extremely important as this disorder causes permanent blindness and is one of the predominant causes of blindness in today’s world. Here, in Diabetic Retinopathy the high glucose level or hyperglycemia causes damage to the tiny blood vessels inside the retina. This tiny blood vessels will leak blood and fluid on the retina, forming features such as microaneurysms, haemorrhages, hard exudates, cotton wool spots, or venous loops [1]. Diabetic Retinopathy affects the people suffering from diabetes for a long time, which predominantly leads to the need for an automated algorithm that can detect this disorder and endure early treatment to avoid deteriorating consequences. Currently, examination methods involve the detection and grading of retinopathy including ophthalmoscopy (indirect and direct), photography (fundus images) and fluorescein angiography. These methods of detection and assessment of diabetic retinopathy is manual, expensive and requires trained ophthalmologists. The proposed metho d in this paper will provide a better alternative for the detection that will ensure a reduction in the global economic cost of diabetes diagnosis. Diabetic Retinopathy can be broadly classified as non-proliferative diabetic retinopathy (NPDR) and proliferative diabetic retinopathy (PDR) as shown in Figure 1. There are four DR stages:
Stage 1 – Background diabetic retinopathy (also termed mild or moderate non-proliferative retinopathy). At least one microaneurysm with or without the presence of retinal haemorrhages, hard exudates, cotton wool spots or venous loops will be present.
Stage 2 – Moderate non-proliferative retinopathy. Numerous microaneurysms and retinal haemorrhages will be present. Cotton wool spots and a limited amount of venous beading can also be seen. Some blood vessels are starting to become blocked.
Stage 3 – Severe non-proliferative retinopathy. Many features such as haemorrhages and microaneurysms are present in the retina. Other features are also present except less growth of new blood vessels; many more blood vessels are now blocked, and these areas of the retina start to send signals to the body to grow new blood vessels for nourishment.
Stage 4 – Proliferative retinopathy. PDR is the advanced stage where the fluids sent by the retina for nourishment trigger the growth of new blood vessels. The main blood vessels become stiff, and blockage of blood flow occurs. Small pockets of blood begin to form around the boundary of the main blood vessels. These fragile blood vessels have thin walls, and when the walls burst, blood spatters form. Exudates (proteins and other lipids) and blood from the leakage forms around the retina and in some cases, leakage may form on the fovea, resulting in sudden severe vision loss and blindness.
Figure 1: Stages of DR fundus images
There are many morphological changes that occur in the human eye for a person suffering from DR. Since the project is heavily dependent on these features, some of them related to the project is mentioned below:
Blood-vessels- In normal retina, the main function of the blood vessels is to send nutrients such as oxygen and blood to the eye as shown in Figure 2. In the case of DR, the simulation to the growth of new fragile blood vessels is due to the blockage and thickening of the main blood vessels. When the main blood vessels are blocked, new vessels are triggered to grow in an attempt to send oxygen and nourishment to the eye. However, these new blood vessels are very fragile and abnormal. They are prone to rupture and leak fluids (proteins and lipids) and blood into the eye. This may not hinder the patient’s sight if the leakage does not occur on the fovea or macula. However, if the blood spatters happen to be on the fovea or macula, sudden loss of vision in that eye occurs as the spatters block all light entering into the eye.
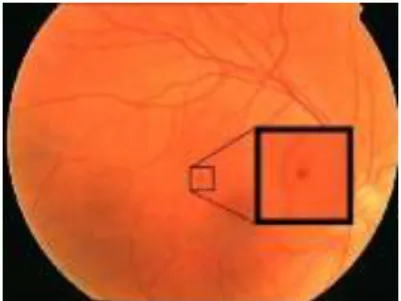
Microaneurysms- Microaneurysms are small saclike out pouching in the small vessels and capillaries as shown in Figure 3. They are an early feature of DR, and it appears as small red dots due to the ballooning of capillaries. They represent a small weakness in the retinal capillary wall that leaks blood and serum [2]. They appear as tiny red dots in fundus photographs.
Figure 3: Microaneurysms in DR
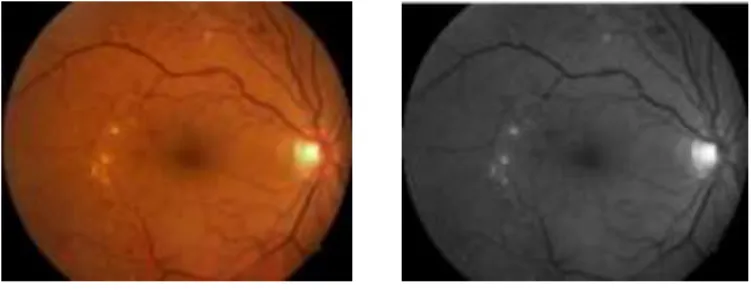
Exudates- Exudates often described as hard exudates, these are deposits of extravasated plasma proteins, especially lipoproteins, as shown in Figure 4. They leak into retinal tissue with serum, and are left behind as oedema fluid is absorbed. Eventually exudates are cleared from the retina by macrophages. They appear as yellow-white dots within the retina. The yellow deposits may be seen as either individual spots or clusters, usually near optic disc.
Figure 4: Exudates in DR
By knowing the features of DR and the morphological changes that take place during the onset of the disorder an attempt was made to design an algorithm that can automatically detect the different features present in the fundus image accurately.
Materials and Methods
Image Acquisition- Fundus photography is the usage of fundus camera to photograph the regions of the vitreous, retina, choroid, and optic nerve. Fundus photographs are only considered medically necessary where the results may influence the management of the patient. In general, fundus photography is performed to evaluate abnormalities in the fundus, follow the progress of a disease, plan the treatment for a disease, and assess the therapeutic effect of recent surgery. In this project, the images for imaging processing were ta ken from fundus camera. The images were displayed in a 2-dimensional matrix whose elements are the pixel values. Images are stored in JPEG file format. (Source of Fundus Image Database: Isfahan MISP Datasets)
Image-Processing- In this stage, image is enhanced by using basic filters such that the finer details are visible. It is important to note that in this project the RGB color space is used in which one of either R, G or B channels are used for processing depending upon the application. The various techniques employed here are as follows:
Contrast Limited Adaptive Histogram Equalization (CLAHE)- CLAHE processing is typically necessary due to the non-uniformity obtained in the fundus images. The non-uniform brightness & variations are corrected by using this technique of image processing.
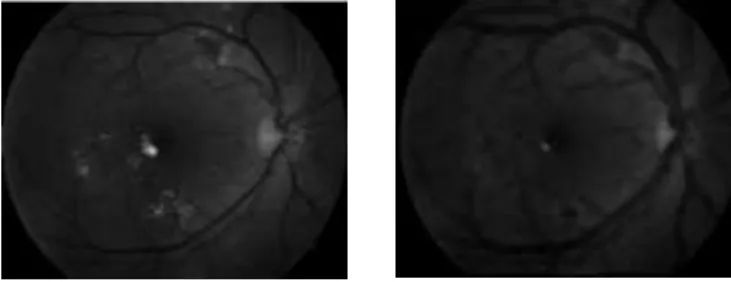
A histogram is a graph which indicates the number of times each gray level occurs in an image. For example, in bright images, the gray levels will be clustered at the upper end of the graph. As for images that are darker, the gray levels will then be at the lower end of the graph. For a gray level that is evenly spread out in the histogram, the image is well contrasted. CLAHE operates on small regions in the image, called tiles. Each tile's contrast is enhanced so that the histogram of the output region approximately matches a specified histogram. Figure 4(a) shows the fundus image before CLAHE, and its histogram shows more dark level regions than bright level regions. Figure 4(b) shows the fundus image after CLAHE, and its histogram shows an evenly distributed brightness.
Figure 4(a): Original Image (left) & its histogram (right)
Figure 4(b): CLAHE Image (left) & its histogram (right)
Morphological Operations- Morphological image processing enables us to analyze the shapes of the images & its contents. This is typically done by using a set of operators that transform images according to size, shape, connectivity, etc. Morphological operations apply a structuring element to an input image, creating an output image of the same size. In a morphological operation, the value of each pixel in the output image is based on a comparison of the corresponding pixel in the input image with its neighbors. By choosing the size and shape of the neighborhood, a morphological operation can be created that is sensitive to specific shapes in the input image. There are many types of morphological operations used in this project, such as dilation, erosion, opening, and closing.
Dilation & Erosion: Dilation and erosion are basic morphological processing operations. They are defined in terms of more elementary set operations but are employed as the basic elements of many algorithms. Both dilation and erosion are produced by the interaction of structuring element with a set of pixels of interest in the image. Dilation adds pixels to the boundaries of objects in an image, while erosion removes pixels on object boundaries. The number of pixels added or removed from the objects in an image depends on the size and shape of the structuring element used to process the image. Figure 5(a) shows an original fundus image before dilation and also the same image after dilation with disk shaped SE of radius 8. Optic disc becomes more prominent, and exudates can also be seen near macula. Similarly, Figure 5(b) shows an original fundus image before dilation and also the same image after erosion with disk shaped SE of radius 8. Blood vessels become more prominent in this case.
Figure 5(a): Original Image (left) & Image after dilation with a disk-shaped SE (right)
Figure 5(b): Original Image (left) & Image after erosion with a disk-shaped SE (right)
Opening & Closing: Dilation and erosion are often used in combination to implement image processing operations. Erosion followed by dilation is called an open operation. Opening of an image smoothens the contour of an object breaks narrow bridges and eliminates thin protrusions [3]. Dilation followed by erosion is called a close operation. Closing of an image smoothens section of contours, fuses narrow breaks and long thin gulfs, eliminates small holes in contours and fills gaps in contours. Figure 6 shows the difference between the opening operation and closing operation of fundus images.
Figure 6: Opening Image (left) & Closing Image (right) with a disk-shaped SE
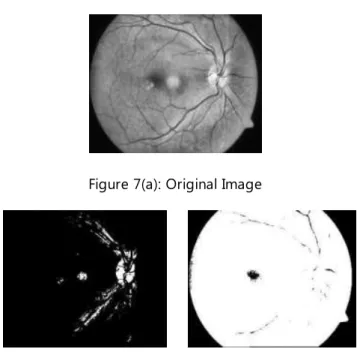
Thresholding- Thresholding transforms a color or a grayscale image into a binary image. In the case of the fundus image, by removing all gray level information, the blood vessels are reduced to binary pixels. It is necessary to distinguish blood vessels foreground from the background information. Thresholding can also be used to bring out hidden detail. It is very useful in the image region which is obscured by similar gray levels. Therefore, choosing an appropriate threshold value is important because a low value may decrease the size of some of the objects or reduce the number, and a high value may include extra background information [4,5]. Figure 7(a) shows original fundus image before thresholding with CLAHE. Figure 7(b) shows the same image with too high threshold value resulting in too much background information. Also, Figure 7(b) shows the same image with too low threshold value resulting in missing foreground information.
Figure 7(a): Original Image
Figure 7(b): Image with too high (left) & too low (right) threshold value
Edge Detection- In an image, an edge is a curve that follows a path of rapid change in image intensity. Edges are often associated with the boundaries of objects in a scene. Edge detection refers to the process of identifying and locating sharp discontinuities in an image [2,3]. It is possible to use edges to measure the size of objects in an image, isolate particular objects from their background, and to recognize or classify objects. There are several edge detection techniques each having its own significance, typically here in this project we have used Canny method of edge detection. Figure 8 shows the action of Canny operator on a fundus image.
Figure 8: Original Image (left) & Canny Image (right)
Median Filtering- Median filtering is a nonlinear operation often used in image processing to reduce "salt and pepper" noise. A median filter is more effective than convolution when the goal is to simultaneously reduce noise and preserve edges. Figure 9 shows the difference before and after applying median filtering. The “salt and pepper” noise in the original image have been clearly reduced after applying the median filtering [8].
Results and Discussion
With the utilization of the above-mentioned image processing techniques, an attempt is made to extract the different features observed in the DR eye. The extraction is done as follows:
Blood Vessels- The flowchart of the algorithm used for segmenting the blood vessels is shown schematically below in Figure 10.
Figure 10: Flow-chart for Blood vessel detection
Here, in this project 24-bit, 720 X 576 pixels fundus images were used. Color images can be viewed in different color spaces, namely RGB, HSI, CMYK, Lab, etc. Here, the RGB color space is used for applying image processing techniques.
The original fundus image was subjected to the algorithm mentioned above, and the following results were obtained:
Figure 11: Original Fundus Image (left) & Green channel Image (right)
Figure 11 particularly shows the original fundus image which was fed into the algorithm & the extraction of the green channel of the image for further processing.
Figure 12: Inverted Green Image (left) & Canny Edge Detected Image (right)
Figure 12 shows the inverted green channel image which is predominantly done to make the detection more efficient & then the edge is detected by Canny’s method.
Figure 13: CLAHE Image (left) & Opening Image (right)
Figure 13 shows the CLAHE image used for non-uniform correction & opening image after morphological processing using structuring element of disk-shaped having radius of 8.
Figure 14: Image after subtraction (left) & Image after thresholding (right)
Figure 14 represents the image which is subtracted from CLAHE Image to improve the contrast & also the binary image obtained after thresholding with a value of 0.092.
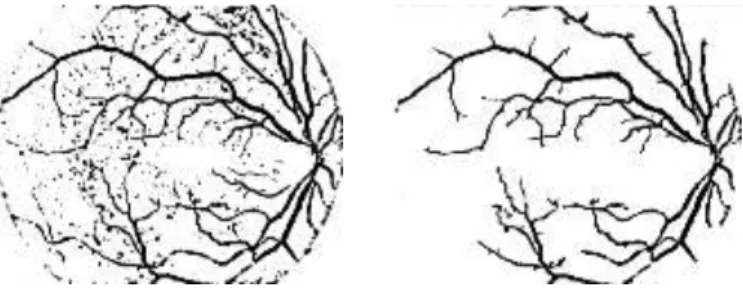
Figure 15: Image after median filtering (left) & Final Segmented Blood-Vessel Image (right)
In figure 15, it is quite evident that initially, median filtering was done in order to get rid of the “Salt & Pepper Noise” & then finally the blood vessel was segmented by subtraction of the boundary and further processing it by filling the holes that are not co-existing together in the image.
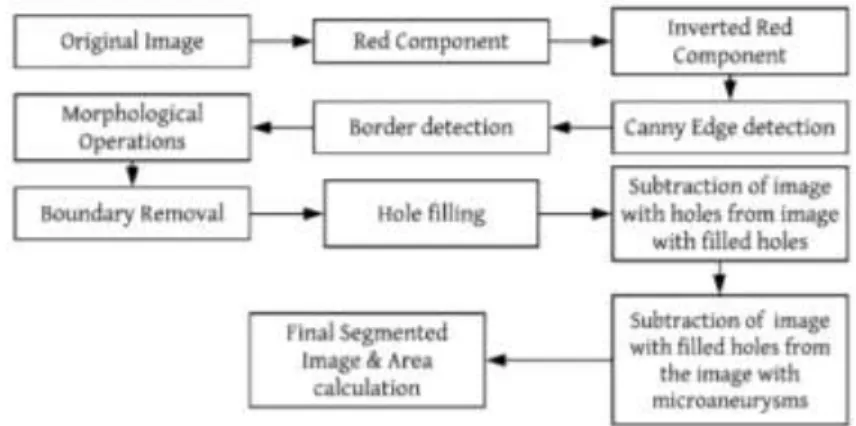
Microaneurysms- The flowchart of the algorithm used for segmenting the microaneurysms is shown schematically below in Figure 16.
Figure 16: Flow-chart for Microaneurysms detection
Microaneurysms are tiny red dots on the fundus image of the retina [6,7]. Hence, here the red channel of the RGB image is utilized in order to perform segmentation of microaneurysms. Then, the algorithm depicted above is initiated, whose results are as follows:
Figure 17: Original Fundus Image (left) & Red channel Image (right)
Figure 17 particularly shows the original fundus image, which was fed into the algorithm & the extraction of the red channel of the image for further processing.
Figure 18: Inverted Red Image (left) & Canny Edge Detected Image (right)
Figure 18 shows the inverted red channel image which is predominantly done to make the detection of microaneurysms more efficient & then the edge is detected by Canny’s method.
Figure 19: Image with boundary (left) & Image obtained after subtraction of boundary from Canny Image (right)
Figure 19 shows that the boundary is detected by filling up the holes and a disk-shaped structuring element (SE) of radius 8 is created with opening operation. The edge detected image is then subtracted from the image with boundary to obtain image without boundary represented above.
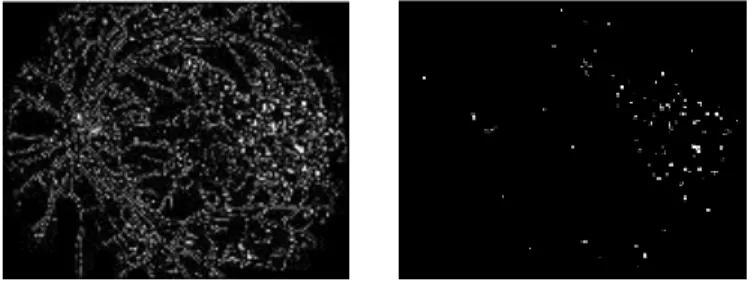
Figure 20: Image after hole-filling (left) & Image after subtraction (right)
Figure 20 shows the hole filling stage which results in the presence of microaneurysms & noise. The image is then subtracted from the previous image to isolate the microaneurysms & the unwanted noise during the process.
Figure 21: Blood-vessel detection (left) & Blood vessel after Canny edge detection (right)
The blood vessel detection follows the same process as mentioned in this paper previously. Then, the Canny edge detection is applied, resulting in the image of Figure 21.
Figure 22: Image after subtraction (left) & Image after hole filling (right)
Figure 21(right) image is subtracted from the image obtained after subtraction of the boundary. Eventually, the hole-filling is done as required giving us the image above in Figure 22.
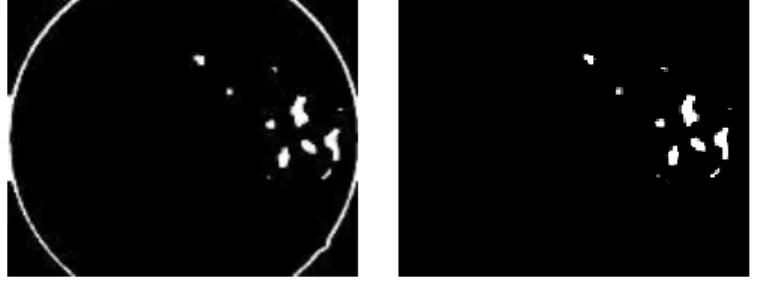
Figure 23: Segmented Microaneurysms Image
Figure 22 is subtracted from the image which contains both the microaneurysms & the unwanted noise to obtain the final segmented image containing the corrected count of microaneurysms present.
The area calculation suggested that the total pixels covered by the microaneurysms in Figure 23 is 582 pixels. This area calculation can tell doctors regarding the severity of the disorder.
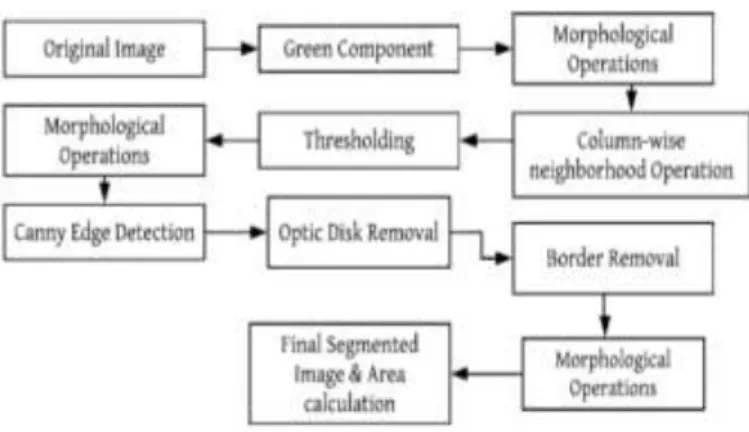
Exudates- The flowchart of the algorithm used for segmenting the microaneurysms is shown schematically below in Figure 24.
Figure 24: Flow-chart for Exudates detection
Exudates are yellowish spots seen in fundus images. They are predominantly easily visible to human eye as compared to microaneurysms. The process is started by feeding the original fundus image in the algorithm mentioned above & then the following results were obtained:
Figure 25: Original Fundus Image (left) & Green channel Image (right)
Figure 25 particularly shows the original fundus image, which was fed into the algorithm & the extraction of the green channel of the image for further processing.
Figure 26: Closing Image (left) & Column-wise neighborhood Operation Image (right)
Figure 26 shows the Closing Image, which is obtained after using an octagon shapes SE of radius 9. It is important to note that from the above images it is quite evident that the Optic disk & the exudates have particularly the same Intensity values. Column wise neighborhood operation is performed to rearrange the image into columns first. This operation is utilized to give us a more distinct look of the image with removal of unwanted noise, etc.
Figure 27: Thresholding Image (left) & Closing Image (right)
Figure 27 exclusively shows the thresholding operation that has been performed by using the value 0.6 & then morphological closing operation is applied to fill holes in the exudates if present.
Figure 28: Canny Image (left) & Optic mask Image (right)
The optic disk generally consists of the max intensity values. As an attempt to remove it, Canny’s method is used which detects the edges. Then an Optic disk mask was generated using the region of interest concept & eventually it is removed in the further steps.
Figure 29 shows the image obtained after removal of the optic disk & then the boundary is successively removed for further obtaining the Exudates.
Figure 30: Segmented Exudates Image
The exudates are finally segmented after performing a morphological operation of erosion, which is shown in Figure 30.
The area calculation suggested that the total pixels covered by the exudates in Figure 30 are 1434 pixels. This area calculation can tell doctors regarding the severity of the disorder.
Conclusions
In this project, diabetic retinopathy detection and various feature segmentation were successfully performed. It was seen that by using different color channels & morphological operations various features related to the disorder could be segmented & analyzed for medical studies. This method is quite successful for different sets of fundus images, which were verified & give decent results. Also, it has been evident that this method allows the detection of DR at an early stage. However, new concept and different techniques can be used to improve the effectiveness of this algorithm. Also, it is important to note that the area calculation enables the doctor to predict the severity of the disorder and ensures speedy diagnosis.
Conflicts of Interest
Authors would like to declare that there is no conflict of Interest. Funding Statement
Not Applicable Acknowledgments
The authors would like to thank Vellore Institute of Technology for providing this opportunity to perform research in Medical Image processing and also by giving free MATLAB software.
References
1. B´alint Antal, et al, “An Ensemble-Based System for Microaneurysm Detection and Diabetic Retinopathy Grading,” IEEE transactions on biomedical engineering, Vol. 59, June 2012.
2. Gonzalez, R.C., Woods, R.E. “Digital Image processing.” Pearson Education, New Delhi (2002)
3. Parisut Jitpakdee, et al, “A Survey on Hemorrhage Detection in Diabetic Retinopathy Retinal Images ,” IEEE 2012, 978-1-4673-2025-2
4. Patwari, M.B., Manza, R.R., Saswade, M., Deshpande, N. “A Critical Review of Expert Systems for Detection and Diagnosis of Diabetic Retinopathy.” Ciit International Journal of Fuzzy Systems (February 2012)
5. Sujith Kumar, S.B., et al. “Automatic Detection of Diabetic Retinopathy in Non- dilated RGB Retinal Fundus Images.” International Journal of Computer Applications 47(19), 888– 975 (2012).
6. Singh, N., et al.: Automated Early Detection of Diabetic Retinopathy Using Image Analysis Techniques. International Journal of Computer Applications 8(2), 975–8887 (2010)
7. Vijayachitra, S., et al. “Analysis of Diabetic Retinopathy Images Using Blood Vessel Extraction.” International Journal of Advanced Engineering Research and Studies EISSN2249–8974 IJAERS/Vol. I/ Issue II/January-March, 2012/89-91 Research Article (2012)
8. Yogesh M. Rajput, Ramesh R. Manza, Manjiri B. Patwari, Neha Deshpande, “Retinal Blood Vessels Extraction Using 2D Median Filter”, Third National Conference on Advances in Computing (NCAC2013), 5th to 6th March 2013, School of Computer Sciences, North Maharashtra University, Jalgaon-425001 (MS) India. Funding Statement