Collision cascade effects near an edge dislocation dipole
in alpha-Fe: induced dislocation mobility and enhanced
defect clustering
S. Heredia-Avalosa,∗, C. D. Dentonb, J. C. Moreno-Mar´ına, E. Martinezc, M. J.
Caturlab
aDept. de F´ısica, Enginyeria de Sistemes i Teoria del Senyal, Universitat d’Alacant,
Apartat 99, E-03690 Alacant, Spain
bDept. de F´ısica Aplicada, Universitat d’Alacant, Apartat 99, E-03690 Alacant, Spain cTheoretical Division, T-1, Los Alamos National Laboratory Los Alamos, 87545, NM, USA
Abstract
Collision cascades near a 1/2h111i{110} edge dipole in alpha-iron have been studied using molecular dynamics simulations for a recoil energy of 20 keV and
two temperatures, 20 K and 300 K. These simulations show that the collision
cascade induces the migration of the dislocations through glide along its slip
plane. The motion of the dislocations starts at the peak of the collision cascade and expands a time scale much longer than the cascade duration, until restoring
the equilibrium distance of the dipole, regardless of the damage produced by the
cascade. At the initial stages, kinks are formed at the dislocation that enhance
glide. When defects reach the dislocations, jogs are produced. We show that
the initial dislocation motion is triggered by the shock wave of the collision
cascade. The cascade morphology is also strongly influenced by the presence
of the dislocations, having an elongated form at the peak of the displacement,
which demonstrates the strong interaction of the dislocations with the cascade
even at the early stages. Finally, we show that larger vacancy clusters are
formed in the presence of dislocations compared to isolated cascades and that these clusters are larger for 300 K compared to 20 K.
Keywords: molecular dynamics, metals, dislocations, collision cascades,
∗Corresponding author
Email address: [email protected](S. Heredia-Avalos)
radiation damage
1. Introduction
The mechanical behavior of metals is governed by the characteristics and
mobility of their dislocations. In the presence of defects produced by irradiation,
this behavior can be altered modifying the plastic response of the material.
Effects such as hardening or loss of plasticity are common in metals exposed to 5
irradiation [1, 2]. The development of radiation resistant materials for fusion
applications can benefit from a fundamental understanding of dislocation-defect
interactions [3].
Molecular dynamics with empirical potentials has been an important tool
to provide atomic level information about these phenomena. Most of the calcu-10
lations performed consider the interaction of a single dislocation with a defect
under an applied stress [4, 5, 6]. The interaction of collision cascades with
pre-existing dislocations has been studied only recently [7, 8, 9, 10, 11], with most
of the calculations performed in f.c.c. crystals [7, 8, 11] and, to a lesser extent,
in b.c.c. metals [9, 10]. These simulations have shown how damage produced by 15
the cascade can induce significant changes in the dislocation structure leading to
dislocation climb or cross-slip [11] and, in some cases, glide [9]. Calculations in
b.c.c. iron next to a single 1/2h111i{110}edge dislocation have been performed at low recoil energies (5 keV) [10] showing a dependence of the cascade damage
on the distance between the dislocation and the initial recoil, with enhanced 20
vacancy clustering at certain distances and reduced defect production for both
vacancies and self-interstitials at closer distances from the dislocation.
In this work, we have studied the effect of collision cascades produced by 20
keV recoils on a 1/2h111i{110} edge dipole and two different temperatures, 20 K and 300 K. After the two dislocations reach their equilibrium distance, an ini-25
tial energetic recoil is started in the center between the two dislocations. These
calculations show that the collision cascade induces glide of the two dislocations,
not studied in detail. The importance of interstitials on dislocation climb has
also been addressed recently through dislocation dynamics [12]. Here, we mea-30
sured the displacement produced by the two dislocations and study the effect of the defects produced by the cascade on this motion. Even more interesting
is the strong influence of the dislocations on the morphology of the collision
cascade, even at the very early stages. Finally, we have analyzed the damage
produced by the collision cascade in terms of vacancies and self-interstitials and 35
compare the results with those in a pristine lattice, without the presence of the
dislocations.
2. Methodology
We have used in our simulations a b.c.c. Fe crystal constituted by 1.7 million
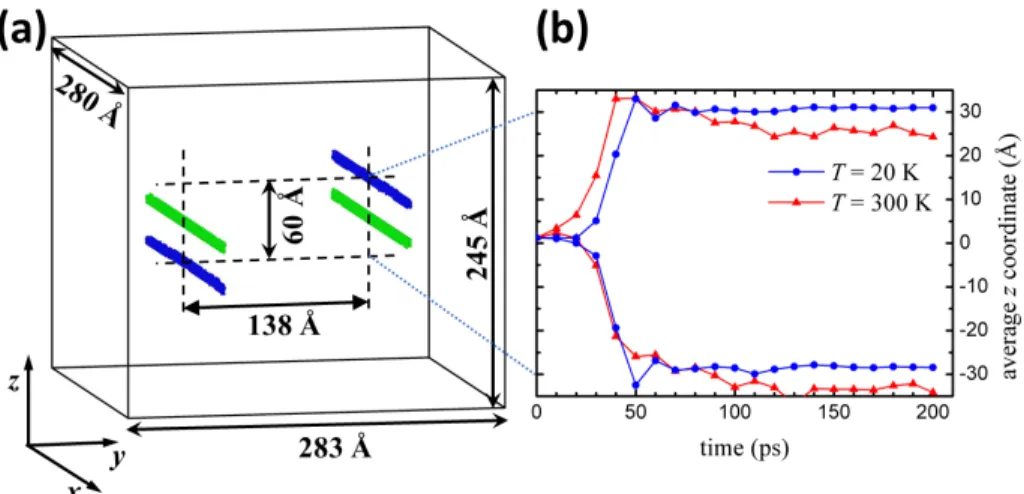
atoms with two perfect edge dislocations, as shown in figure 1(a). Thex,yand 40
z axes correspond to the [2¯1¯1], [01¯1] and [111] directions respectively. The
dislocation lines are in thexdirection which corresponds to the [2¯1¯1] direction
of the b.c.c. crystal and the y axis is perpendicular to the glide plane of the
dislocation. Our cell has dimensions of approximately 283 ˚A×280 ˚A×245 ˚A in thex,y, andz directions respectively. The simulations are performed using 45
the Large-scale Atomic/Molecular Massively Parallel Simulator (LAMMPS) [13,
14], with the Fe potential developed by Acklandet al. [15]. A Langevin [16] heat
bath is located at the borders of the simulation cell, except in the two planes
perpendicular to the dislocation lines. Periodic boundary conditions are used
throughout the 3 directions. First of all, we have let the system evolve for 200 50
ps at a constant temperature (300 K or 20 K) and both dislocations move in the
z direction until reaching a new equilibrium position as shown in Figure 1(a).
Figure 1(b) shows the position of the dislocations as a function of time during
the thermalization up to 200 ps. The dislocations reach an equilibrium position
after≈50 ps. While for 20 K the two dislocations do not change their location, 55
at least within this time scale, at 300 K a slight motion could be observed.
Figure 1: (colour online) (a) Simulation configuration used in this work. The initial posi-tion of the atoms belonging to the dislocaposi-tions can be observed in green (light colour) while their equilibrium position after a thermalization at 20 K during 100 ps is plotted in blue (dark colour). (b) Averagezcoordinate of the two dislocations as a function of time during thermalization at 20 K and 300 K.
is started by giving 20 keV of energy to a central atom in slightly different
directions close to the−zdirection, that is, perpendicular to the dislocation line and away from it. Note that the distance between the initial recoil and either of 60
the two dislocations along theydirection is ≈70 ˚A. We let the collision evolve for up to 60 ps and analyze how the collision cascade affects the position of the
dislocations and how the dislocations affect the creation of point defects of the cascade.
In order to analyze our results, we have used the open visualization tool 65
OVITO [17], which also provides analysis software for atomistic simulation data.
The movement of the dislocations was followed using a Common Neighbour
Analysis (CNA) [18], whereas the positions of point defects created by the
cas-cade were obtained using a Wigner-Seitz cell method, comparing the damaged
cell with the cell before the cascade. The Dislocation Extraction Analysis (DXA) 70
[19], implemented in OVITO, is used to identify the changes in the dislocations
3. Results and Discussion
3.1. Cascade induced dislocation glide
The first noticeable effect observed in these calculations is that the two dis-75
locations in the dipole are displaced from their equilibrium position when the
collision cascade is initiated. In order to study the motion of both dislocations
after the 20 keV collision cascade in the crystal thermalized at T = 20 K (or
300 K), we have identified the atoms close to the dislocation core with CNA
[17, 18], choosing only those atoms that do not have a b.c.c. environment. This 80
allows us to discard the atoms of the cell that do not belong to the dislocations.
The motion of the dislocations is mostly in thez direction, remaining fixed the
y coordinate of both dislocations, except when there is climb induced by the
collision cascade, as explained below. Therefore, we can quantify the position of the dislocations by averaging thez coordinate of the atoms around the dis-85
location core. The initial configuration of the dislocations before the cascade is
shown in figure 1(a), identified using the method just described. Green atoms
correspond to the position of the dislocations before relaxation and blue are
the positions after they reach equilibrium. From the average position of the
dislocation we obtain that one of the dislocations is initially located atz≈30 90
˚
A and the second one atz≈ −30 ˚A after equilibrium.
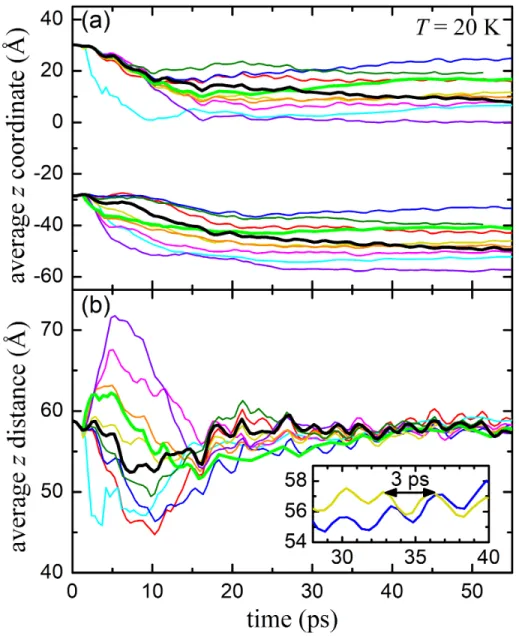
In figure 2(a) we show the average z coordinate of both dislocations as a
function of time for 10 different cascades at a temperature of 20 K. They
cor-respond to slightly different variations of the velocity direction of the primary knock-on atom (PKA) in order to obtain significant statistical fluctuations of 95
the collision cascade, but always close to the−z direction. We observe that in all cases both dislocations move in thez direction. However, the averagez
dis-tance between dislocations can be increased or reduced after the starting of the
collision cascade, as shown in figure 2(b). Eventually they reach an equilibrium
distance which is approximately the same as the initial one. Note that, even 100
though the equilibrium distance is constant, there is a slight drift of the two
Figure 2: (colour online) Evolution of (a) the averagez coordinate of each dislocation and (b) the z distance between dislocations, after a 20 keV cascade close to the center of the simulation box and on the−xdirection in a bcc Fe with two edge dislocations atT = 20 K.
calculations at constant temperature before the cascade for the same time scale
(see figure 1(b)).
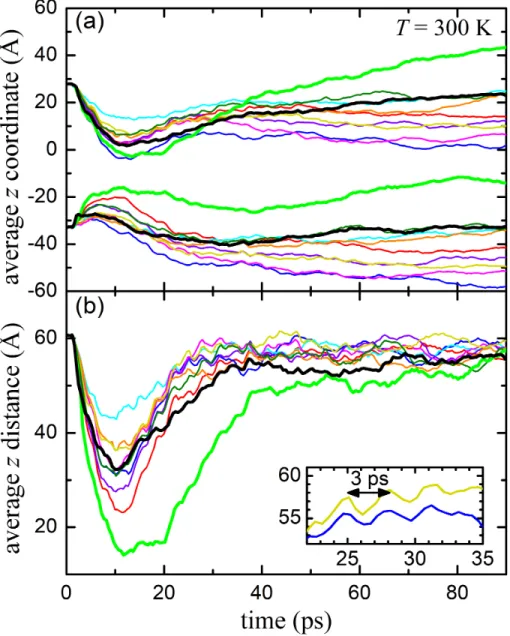
Analogously, in figure 3(a) we observe the motion of the dislocations after a 105
20 keV cascade for a temperature of 300 K. Unlike forT = 20 K, now in all cases
both dislocations tend to move closer together after the collision, and after 10 ps
they tend to separate to reach again an equilibrium distance, similar to the initial
one. This is better observed in figure 3(b). The distance between dislocations
is initially reduced, but after 10 ps it increases again, reaching an equilibrium 110
distance similar to the initial one. Again oscillations in the distance between
dislocations with a period of 3 ps can be observed. Also, at this temperature,
the drift of the two dislocations after reaching the equilibrium distance is more
clear than at 20 K.
It is interesting to note the oscillations in the distance between dislocations, 115
that appear with a period of around 3 ps (see insets in figures 2(b) and 3(b)).
Since the size of the simulation box is 245 ˚A along thez direction, the speed
of this wave is≈8176 m/s, which is above the speed of sound in iron. There-fore, this oscillation could be related to the shock wave induced by the collision
cascade that does not get fully damped by the applied thermostat. Supersonic 120
shock waves from collision cascades have been identified in calculations of 100
keV up to 200 keV recoils in Fe [20]. Note that the oscillations are the same
for the two temperatures studied. These oscillations show the influence of slight
stress changes on the dislocations, changes that do not affect the defects
pro-duced by the collision cascade. 125
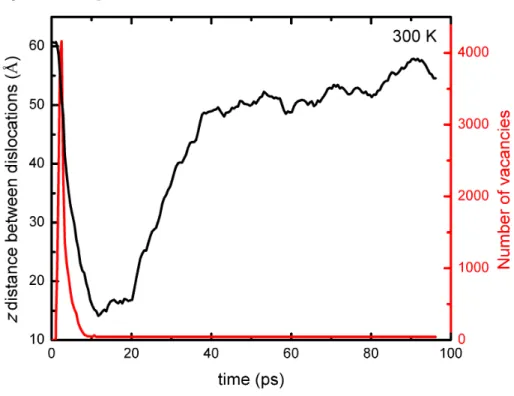
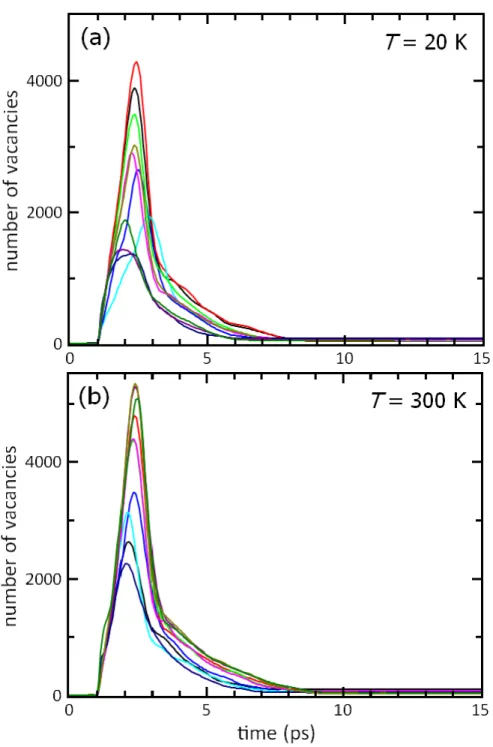
Finally, we show in figure 4 thezdistance between dislocations (black line)
and the number of vacancies (red line) as a function of time. It is important to
point out that the maximum number of displacements in the collision cascade
occurs between 2 to 3 ps after the initial PKA and decreases very rapidly. At 10
ps the total number of defects remains constant, meaning both the ballistic and 130
thermal spike phases of the collision cascade are over (see figure in Supplemental
Material). Therefore, the motion of the dislocations occurs induced by the
Figure 3: (colour online) (a) Evolution of the averagezcoordinate of each dislocation and (b) evolution of thezdistance between dislocations; after starting a 20 keV cascade close to the −xdirection in a bcc Fe with two edge dislocations atT= 300 K.
than the total time of the collision cascade. In fact, the dislocations start moving
right after the peak of the collision cascade. 135
Figure 4: (colour online) z distance between dislocations (black line) and the number of vacancies (red line) as a function of time during, and after, the 20 keV collision cascade at T= 300 K.
Decoupling the contribution to dislocation mobility of the shock wave and
temperature gradient produced by the cascade from the production of defects
at the dislocations from these simulations is not straightforward. In order to get a better understanding, we have performed simulations where a Gaussian
temperature distribution is initiated in the center of the simulation cell, in 140
between the two dislocations. Here no defects are produced. Figure 5 shows
the evolution of this temperature profile in time. Atoms identified as defects
with the common neighbor analysis in OVITO are represented, with colours
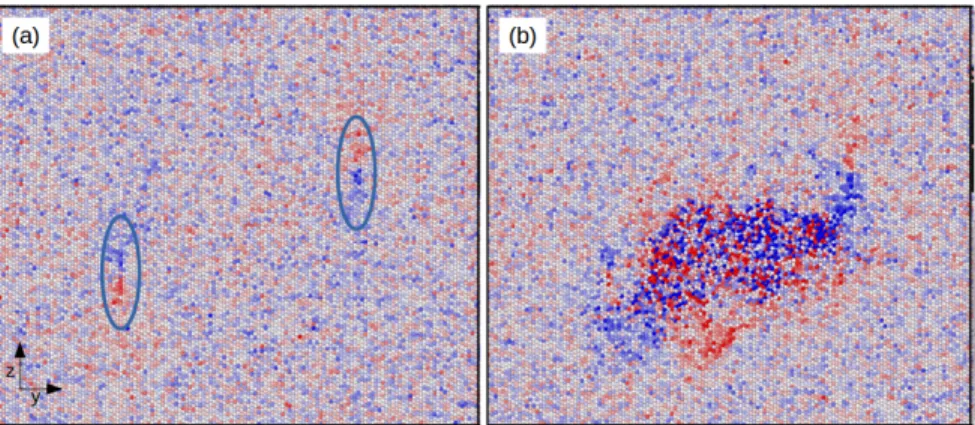
corresponding to theσzzcomponent of the atomic level stress. This figure shows
how bending of the dislocation along thez direction, that is, the formation of 145
of defects to the dislocations. It is important to note that this is different
from having a fixed higher temperature in the whole cell, where we saw no
motion of the dislocations in the same time scale. Therefore, the motion of these dislocations is driven by the stress created by the temperature gradient. More 150
details about the bending of the dislocations along the z direction is included
in the Supplementary material.
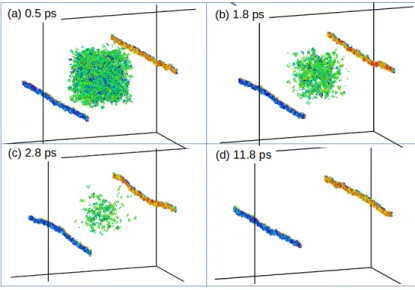
Figure 5: Evolution of a thermal spike started in the middle of the simulation cell. Colours correspond toσzzcomponent of the atomic level stress, with blue representing negative values
and red positive ones. Note the bending of the dislocation.
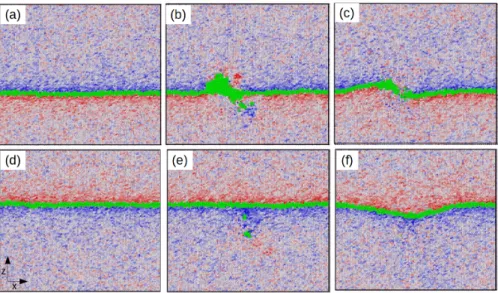
The same bending of the dislocations is observed in the case of collision
cascades, as can be seen in figures 7 and 8 below, although sometimes not so clear when defects arrive to the dislocations. Figure 6 shows a cut through the 155
dislocation core, along the glide plane, with the location of the two dislocations
in green spheres as identified by the common neighbor analysis and the colors of
the rest of the atoms showing the shear atomic level stressσyz component with
red positive values and blue negative ones. Top and bottom figures correspond
to the two dislocations of the dipole for different times during the collision 160
the z direction is clearly observed and the central panels (b and e) correspond
to the moment when the dislocations start to bend. A change in the shear stress
σyz distribution close to the dislocations can be observed at this time. In the 165
case of the dislocation on the top figures, defects arrive to the dislocation but
not in the dislocation at the bottom. The resulting damage produced in the
cascade for this case can be seen in figure 8, on the left panels.
Figure 6: (colour online) Cut through the dislocation core along the glide plane, for different times during the collision cascade and for the two dislocations (top and bottom). Green spheres showing the location of the dislocation line. Colours are the shearσyz component of
the atomic level stress.
3.2. Cascade evolution near the dislocations
In order to understand the mechanisms and processes occurring during the 170
collision cascade next to the dipole we present in figures 7 and 8 the evolution
of different cases at 20 K and 300 K, respectively. In both figures we show how
The case shown on left side of figure 7 corresponds to the black thick lines
in figures 2(a) and 2(b), while the one depicted on the right corresponds to the 175
green thick lines of the same figures. The red dots in figure 7 represent vacancies and the blue dots are self-interstitials as obtained with the Wigner-Seitz
analy-sis provided by OVITO. The green dots are the atoms whose surrounding is not
b.c.c., as provided by the CNA of OVITO. In the cascade on the left hand of
figure 7, we can observe that the collision cascade is far from both dislocations 180
and the final resulting damage is also away from the dislocations. As a result,
the final damage looks very similar to that in bulk, without the presence of
dis-locations, with a core rich in vacancies and self-interstitials in the surroundings.
We can also see in figure 2 (black lines) that the effect of the collision cascade
on the motion of the dislocations is not as pronounced as in the other cases. 185
There is first a displacement of both dislocations, getting slightly closer to each other, and then quickly recovering an equilibrium position very similar to the
initial configuration.
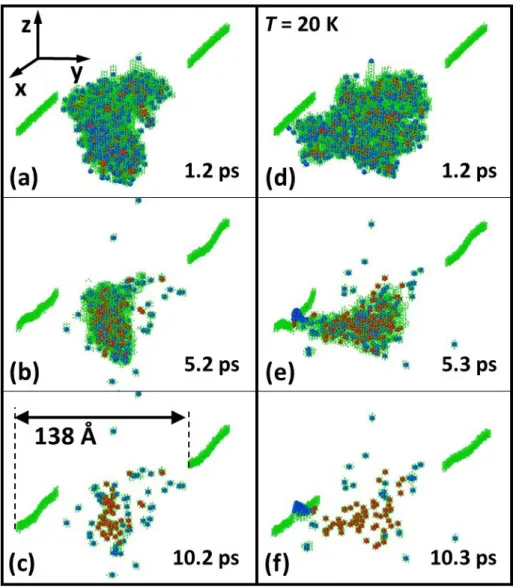
The case on the right hand of figure 7 is quite different. Firstly, note that
the collision cascade has quite a different shape from the case on the left, it is 190
less spherical due to the interaction with one of the dislocations. As a result a
cluster of self-interstitials is formed at the dislocation, while higher number of
vacancies are produced in the bulk (66 in this case vs. 52 in the case described
above and shown on the left side of figure 7). As a result, the movement of
the dislocations is also different from that observed in the case on the left. As 195
shown in figure 2, first the dislocations move slightly away from each other, then, they approach until they reach again almost the initial equilibrium distance. In
this case, one of the dislocations is pinned by the defects and stops gliding
while it is the second dislocation the one that glides reaching the equilibrium
distance. Movies of the whole collision cascade are provided as supplemental 200
material (movies 1 and 2). When analyzing the dislocations using the DXA tool
in OVITO, we observe that the interstitial cluster identified by the Wigner-Seitz
Figure 7: (colour online) Details of the simulation for two selected histories at T = 20 K for different times after starting the cascade. The history shown on the left (right) hand is represented by black (green) thick lines in figures 2(a) and 2(b). Blue dots represent interstitials, red dots represent vacancies, and green dots show the atoms whose surrounding is different to a b.c.c.; those include the dislocation atoms.
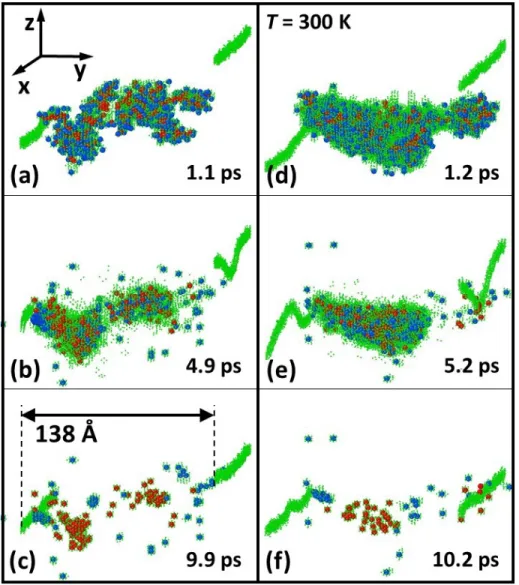
Figure 8: (colour online) Details of the simulation for two selected histories atT= 300 K for different times after starting the cascade. The history shown on the left (right) is represented by black (green) thick lines in figures 3(a) and 3(b). Blue dots represent interstitials, red dots represent vacancies and green dots show the atoms whose surrounding is different to a b.c.c.; those include the dislocation atoms.
Figure 9: (colour online) Configuration of dislocations after a 20 keV collision cascade at 20 K from two different perspectives, one a projection along thezaxis (a), corresponding to the case shown in figure 7(f).
Figure 8 shows the same evolution of the cascades for two cases atT = 300 K. 205
It is clear from these figures, the influence of the dislocations on the shape of the
collision cascade: the cascades are elongated, perpendicular to the dislocation lines. This is more clearly observed when representing the shear component of
the atomic level stress in a cut through the center of the collision cascade, as
shown in figure 10. 210
On the left hand of figure 8, we can see that the cascade breaks into two
subcascades, giving rise to the formation of two clusters of vacancies as well as
a cluster of interstitials next to the left dislocation. This cascade corresponds
to the black thick lines in figure 3. Here the two dislocations get close to each
other and then separate to reach equilibrium. Like in the case of figure 9, 215
the dislocation on the left climbs due to the arrival of self-interstitials, which
results in the formation of the vacancy cluster. This dislocation, in fact, moves only slightly as shown in figure 3(a) because the collision cascade surrounds the
dislocation, as can be seen in figure 8(b), while it is the dislocation on the right
the one that moves to reach the equilibrium distance. 220
The case on the right hand of figure 8 shows the creation of a single cluster
of vacancies and a cluster of interstitials, that in this case it is not attached
to the dislocation. In this particular case the distance between dislocations is
very reduced reaching a z distance of approximately 15 ˚A, almost parallel to
each other, as shown also in the green thick lines of figures 3(a) and 3(b), as 225
well as figure 8(f). In this case, the dislocations also move back to recover the
equilibrium distance, although now the time to reach that equilibrium is longer than in the other cases where the dislocations did not approach each other so
much (see figure 3(b)). The whole evolution of these cascades are provided as
supplemental material in movies 3 and 4. 230
3.3. Analysis of resulting damage: vacancies and self-interstitials
We have performed a statistical analysis of the defects produced in the
Figure 10: (colour online) Cut through the center of the simulation box, color representing the shear stressσyz component of the atomic level stress, with red positive values and blue
negative ones for the initial distribution (a) and the distribution at the peak of the collision cascade (b). The circles indicate the location of the dislocation cores.
is low (10 cases), some conclusions can be extracted from this analysis. From 235
the Wigner-Seitz analysis, we have calculated the size of the different clusters of
vacancies and self-interstitials created at the end of the collision cascade. Fol-lowing the criteria of Bj¨orkas et al. [21], for the case of vacancies, the cut-off
distance is second nearest neighbors while for self-interstitials is third nearest
neighbors to consider two defects as belonging to the same cluster. From this 240
analysis we obtained the percentage of vacancies/self-interstitials in clusters
and the largest vacancy/self-interstitial cluster produced. All these values are
included in table 1).
When looking at the total number of Frenkel-pairs produced (third column
in table 1) no significant differences can be inferred from these results, except 245
for, perhaps a slightly lower number of defects at 300 K compared to 20 K,
independently of the presence or not of the dislocations. When analyzing the percentage of defects in clusters, at first glance it would seem that the
the case of self-interstitials there is a slight increase. It is, however, interesting 250
to analyze the size of the largest cluster obtained in the different cases. Here
we can see that both for the case of vacancies and self-interstitials, the largest clusters are obtained in the presence of the dislocations. For example, while
the largest vacancy cluster formed at 20 K has 13 vacancies, in the presence of
the dislocations it reaches 20 defects, and this tendency increases with temper-255
ature. The reason for what it would seem as a discrepancy between these two
results, that is, a low percentage of vacancies in clusters and the formation of
larger vacancy clusters is due to the fact that two types of collision cascades are
observed in the presence of dislocations. There is a group of cascades for which
the damage is produced far from the dislocation and results in small number of 260
defects as well as low clustering, while there is another group of cascades where
there is a larger interaction with the dislocations, forming large self-interstitial clusters close to the dislocation and consequently leaving a larger number of
vacancies in the bulk which are in clusters. Some representative examples of
this behavior are shown in figures 7(f), 8(c), and 8(f). 265
Analyzing the structure of self-interstitial clusters we observe that single
interstitials are<110>dumbbells, small interstitial clusters of sizes 2, 3 and 4
are<110>dumbbells in parallel configurations, while clusters of larger sizes
are arranged on<111>planes. From the cases studied, we have not identified
C15 clusters or<100>loops. 270
4. Conclusions
We have studied the influence of dislocations on the evolution of collision
cascades in b.c.c. Fe. An edge dislocation dipole is considered where the effects
of the dislocations on the collision cascade is more clearly observed. These
simulations show that the recoils induce glide of the dislocations, occurring in 275
the early stages of the collision cascade and related to the shock wave produced by the energetic recoil. The dislocations also influence the morphology of the
T(K) Dipole FP % V-C % I-C hVmaxi hImaxi Vmax Imax
20 No 57±4 41±3 34±3 7±1 5±1 13 9
20 Yes 60±4 27±3 41±5 7±2 10±3 20 35
300 No 47±3 45±5 52±3 10±2 10±2 26 21
300 Yes 51±6 37±7 58±7 12±4 21±8 38 58
Table 1: Analysis of defects for the two temperatures, with and without the dipole. The table includes the average number of Frenkel pairs (FP), the percentage of vacancies in clusters (% V-C), percentage of self-interstitials in clusters (% I-C), the average maximum cluster size for vacancies (hVmaxi) and interstitials (hImaxi) and the maximum vacancy (Vmax) and interstitial (Imax) cluster obtained.
line instead of almost spherical as in a pristine cell. Dislocation climb is also observed when the collision cascade surrounds the dislocation, leaving behind a 280
vacancy cluster close to the dislocation. In general, we observe that the presence
of dislocations results in the formation of larger vacancy clusters.
CREdiT authorship contribution statement
S. Heredia-Avalos: Conceptualization, Methodology, Software, Validation,
Formal analysis, Investigation, Writing - Original Draft, Writing - Review & 285
Editing, Visualization. C. D. Denton: Conceptualization, Methodology,
Soft-ware, Validation, Formal analysis, Investigation, Writing - Original Draft,
Writ-ing - Review & EditWrit-ing, Visualization. J. C. Moreno-Mar´ın:
Conceptualiza-tion, Methodology, Software, ValidaConceptualiza-tion, Formal analysis, InvestigaConceptualiza-tion,
Writ-ing - Original Draft, WritWrit-ing - Review & EditWrit-ing, Visualization. E. Martinez: 290
Methodology, Writing - Review & Editing. M. J. Caturla: Conceptualization,
Methodology, Software, Validation, Formal analysis, Investigation, Resources, Writing - Review & Editing, Visualization, Project administration, Funding
Acknowledgements
295
This work was partly supported by the Generalitat Valenciana through
PROMETEO2017/139. This work has been carried out within the framework
of the EUROfusion Consortium and has received funding from the Euratom
research and training programme 2014-2018 and 2019-2020 under grant
agree-ment No 633053. The views and opinions expressed herein do not necessarily 300
reflect those of the European Commission. EM gratefully acknowledges
sup-port from the U.S. DOE, Office of Science, Office of Fusion Energy Sciences,
and Office of Advanced Scientific Computing Research through the Scientific
Discovery through Advanced Computing (SciDAC) project on Plasma-Surface
Interactions (award no. DE-SC0008875). 305
Data availability
The raw/processed data required to reproduce these findings cannot be
shared at this time due to legal or ethical reasons.
References
[1] T. A. Khraishi, H. M. Zbib, T. D. de la Rubia, M. Victoria, Localized de-310
formation and hardening in irradiated metals: Three-dimensional discrete
dislocation dynamics simulations, Metallurgical and Materials Transactions
B 33 (2) (2002) 285–296. doi:10.1007/s11663-002-0012-7.
URLhttps://doi.org/10.1007/s11663-002-0012-7
[2] S. J. Zinkle, Microstructures and mechanical properties of irradiated metals 315
and alloys, in: V. Ghetta, D. Gorse, D. Mazi`ere, V. Pontikis (Eds.),
Ma-terials Issues for Generation IV Systems, Springer Netherlands, Dordrecht,
2008, pp. 227–244.
[3] G. Pintsuk, E. Diegele, S. Dudarev, M. Gorley, J. Henry, J. Reiser, M.
Ri-eth, European materials development: Results and perspective, Fusion En-320
[4] D. Terentyev, Y. Osetsky, D. Bacon, Competing processes in
reac-tions between an edge dislocation and dislocation loops in a
body-centred cubic metal, Scripta Materialia 62 (9) (2010) 697 – 700.
doi:https://doi.org/10.1016/j.scriptamat.2010.01.034. 325
URL http://www.sciencedirect.com/science/article/pii/
S1359646210000357
[5] D. Bacon, Y. Osetsky, D. Rodney, Chapter 88 dislocation obstacle
interac-tions at the atomic level, Vol. 15 of Dislocainterac-tions in Solids, Elsevier, 2009,
pp. 1 – 90. doi:https://doi.org/10.1016/S1572-4859(09)01501-0. 330
URL http://www.sciencedirect.com/science/article/pii/
S1572485909015010
[6] S. Hafez, M. Fivel, J. Fikar, R. Schublin, Dislocationvoid interaction in fe: A comparison between molecular dynamics and dislocation dynamics,
Journal of Nuclear Materials 386-388 (2009) 102–105. doi:10.1016/j. 335
jnucmat.2008.12.069.
[7] R. E. Voskoboinikov, Interaction of collision cascades with an isolated edge
dislocation in aluminium, Nuclear Instruments and Methods in Physics
Research Section B: Beam Interactions with Materials and Atoms 303
(2013) 125 – 128, proceedings of the 11th Computer Simulation of Radia-340
tion Effects in Solids (COSIRES) Conference Santa Fe, New Mexico, USA,
July 24-29, 2012. doi:https://doi.org/10.1016/j.nimb.2012.10.022.
URL http://www.sciencedirect.com/science/article/pii/
S0168583X12006593
[8] R. E. Voskoboinikov, Md simulations of collision cascades in the vicinity 345
of a screw dislocation in aluminium, Nuclear Instruments and Methods in
Physics Research Section B: Beam Interactions with Materials and Atoms
303 (2013) 104 – 107, proceedings of the 11th Computer Simulation of
Radi-ation Effects in Solids (COSIRES) Conference Santa Fe, New Mexico, USA,
July 24-29, 2012. doi:https://doi.org/10.1016/j.nimb.2013.01.021. 350
URL http://www.sciencedirect.com/science/article/pii/
S0168583X13001468
[9] B. Q. Fu, S. P. Fitzgerald, Q. Hou, J. Wang, M. Li, Effect of collision
cascades on dislocations in tungsten: A molecular dynamics study,
Nu-clear Instruments and Methods in Physics Research Section B: Beam In-355
teractions with Materials and Atoms 393 (2017) 169–173, 13th
Interna-tional Conference on Computer Simulation of Radiation Effects in Solids
(COSIRES), Loughborough Univ, Loughborough, ENGLAND, JUN 19-24,
2016. doi:{10.1016/j.nimb.2016.10.028}.
[10] H. Wang, J.-T. Tian, W. Zhou, X.-F. Chen, B. Bai, J.-M. Xue, Collision 360
cascades interact with an edge dislocation in bcc fe: a molecular dynamics
study, RSC Adv. 8 (2018) 14017–14024. doi:10.1039/C8RA00141C.
URLhttp://dx.doi.org/10.1039/C8RA00141C
[11] Z. Lu, L. Xu, T. Chen, L. Tan, H. Xu, Interactions between
displace-ment cascade and dislocation and their influences on peierls stress in 365
fe-20cr-25ni alloys, Computational Materials Science 160 (2019) 279 – 286.
doi:https://doi.org/10.1016/j.commatsci.2018.12.018.
URL http://www.sciencedirect.com/science/article/pii/
S0927025618307973
[12] D. H. Thompson, E. Tarleton, S. G. Roberts, S. P. Fitzgerald, 370
Interstitial-mediated dislocation climb and the weakening of
particle-reinforced alloys under irradiation, Phys. Rev. Materials 2 (2018) 080601.
doi:10.1103/PhysRevMaterials.2.080601.
URL https://link.aps.org/doi/10.1103/PhysRevMaterials.2.
080601 375
[13] S. Plimpton, Fast parallel algorithms for short-range molecular dynamics,
J. Comp. Phys. 117 (1) (1995) 1–19. doi:10.1006/jcph.1995.1039.
[14] S. Plimpton, et al., ”Computer code LAMMPS, publicly available at 380
http://lammps.sandia.gov” (2016).
[15] G. J. Ackland, M. I. Mendelev, D. J. Srolovitz, S. Han, A. V. Barashev, Development of an interatomic potential for phosphorus impurities in
-iron, Journal of Physics: Condensed Matter 16 (27) (2004) S2629–S2642.
doi:10.1088/0953-8984/16/27/003. 385
URLhttps://doi.org/10.1088%2F0953-8984%2F16%2F27%2F003
[16] T. Schneider, E. Stoll, Molecular-dynamics study of a three-dimensional
one-component model for distortive phase transitions, Phys. Rev. B 17
(1978) 1302–1322. doi:10.1103/PhysRevB.17.1302.
URLhttps://link.aps.org/doi/10.1103/PhysRevB.17.1302 390
[17] A. Stukowski, Visualization and analysis of atomistic simulation data with OVITO–the open visualization tool, Modelling and Simulation in Materials
Science and Engineering 18 (1) (2009) 015012. doi:10.1088/0965-0393/
18/1/015012.
URLhttps://doi.org/10.1088%2F0965-0393%2F18%2F1%2F015012 395
[18] J. D. Honeycutt, H. C. Andersen, Molecular dynamics study of
melt-ing and freezmelt-ing of small lennard-jones clusters, The Journal of Physical
Chemistry 91 (19) (1987) 4950–4963. arXiv:https://doi.org/10.1021/
j100303a014,doi:10.1021/j100303a014. URLhttps://doi.org/10.1021/j100303a014 400
[19] A. Stukowski, V. V. Bulatov, A. Arsenlis, Automated identification and
indexing of dislocations in crystal interfaces, Modelling and Simulation in
Materials Science and Engineering 20 (8) (2012) 085007. doi:10.1088/
0965-0393/20/8/085007.
URLhttps://doi.org/10.1088%2F0965-0393%2F20%2F8%2F085007 405
[20] Q. Peng, F. Meng, Y. Yang, C. Lu, H. Deng, L. Wang, S. De, F. Gao,
Com-munications 9 (1) (2018) 4880. doi:10.1038/s41467-018-07102-3.
URLhttps://doi.org/10.1038/s41467-018-07102-3
[21] C. Bj¨orkas, K. Nordlund, Comparative study of cascade damage in fe sim-410
ulated with recent potentials, Nuclear Instruments and Methods in Physics
Research Section B: Beam Interactions with Materials and Atoms 259 (2)
(2007) 853 – 860. doi:https://doi.org/10.1016/j.nimb.2007.03.076.
URL http://www.sciencedirect.com/science/article/pii/
S0168583X07007045 415
Supplementary material
The files movie1.avi and movie2.avi show collision cascades at 20 K depicted
on figure 7, whereas the files movie3.avi and movie4.avi show the collision
cas-cades at 300 K depicted on figure 8.
The following figures also include supplementary material. Read the figure 420
Figure 11: Evolution of the number of vacancies on bcc Fe with two dislocations after the cascade is started for (a)T = 20 K and (b)T = 300 K. Notice that after the cascade phase, the number of vacancies reaches an equilibrium value at 10 ps.
Figure 12: (a) Displacement of a dislocation during a thermal spike; we have analyzed the bending of the dislocation along thez direction by calculating the maximum and minimum values ofzin the dislocation (∆z) and dividing this value with respect to the initial value which would be a measure of the width of this dislocation (∆z0). (b) Ratio of ∆z/∆z0(b); the
Figure 13: An example of the location of vacancies and self-interstitials around a dislocation in relation to the stress distribution.