Competition and Shareholder Fees in the Mutual Fund Industry: Evidence and Implications for Policy
John C. Coates IV R. Glenn Hubbard Harvard University Columbia University
Executive Summary
This paper examines claims that price competition in the mutual fund industry either does not exist or is too weak to prevent anticompetitive pricing by investment advisors to retail investors. These claims draw on a view of mutual fund competition tracing to the 1960s, which was not supported by economic
analysis. In contrast to the 1960s view, contemporary analysis demonstrates that competition in the mutual fund industry prevents “excessive fees.” Numerous structural and performance characteristics of the mutual fund industry demonstrate that it is price competitive. Demonstrating that competition is present, and not limited by the fund-advisor governance structure, is sufficient to reject claims of “excessive fees.” These observations about the centrality of price competition from an economic
perspective imply a prominent role for competition as a factor in the legal analysis of “excessive fees” in the framework of the Gartenberg decisions interpreting Section 36(b) of the Investment Company Act. Our paper offers the following conclusions, each of which corresponds to a major section of the paper.
The Structure of the Mutual Fund Industry Is Conducive to Competition.
The mutual fund industry is a classic, competitively structured industry, with hundreds of competing firms offering thousands of products, low barriers to entry and firm expansion, and low concentration. Any attempt at pricing above the competitive level is threatened by lower prices from rivals and entrants, and investors switching to rival firms.
Fund shares are purchased through numerous competing distribution channels, ranging from direct purchases by investors from funds to purchases through brokerage houses, independent financial advisors, banks, insurance companies, and pension plans. Investors are free to choose the channel offering them the best price and service.
The Performance of the Mutual Fund Industry Is Competitive.
Claims that price competition is absent among equity mutual funds are unfounded. Investors have thousands of rival, substitutable product choices, and face small transaction costs in moving from one fund to another. Fee waivers and price decreases are at least as common as price increases. Fund complexes frequently attempt to undercut rivals’ prices.
Investors’ demand for equity mutual funds is sensitive to shareholder fees. Investors concentrate their investments in low-fee, high-return funds for a given risk class. We estimate that, on average, a 10 percent increase in equity fund fees leads to an approximately 25 percent decline in a fund’s asset share and a 15 to 18 percent decline in a complex’s share of total assets managed by mutual funds.
Equity fund complex market shares change from year to year, reflecting in part the relative ability of complexes to attract investors through lower fees and higher returns.
Claims that expense ratios have risen since the 1970s, reflecting a lack of price competition, do not survive careful scrutiny. Recent economic research shows that expense ratios both rise and fall, depending on the fund sample and time periods examined, and that when total costs are measured – including load fees – expense ratios have fallen consistently since 1980.
The existence of price dispersion across funds within various investment objective categories offers further evidence of price competition and consumer choice. Price dispersion reflects, among other factors, differences in services and the quality and content of services sought by investors, as well as consumer search costs, including the opportunity cost of investors’ time.
The Competitive Market for Mutual Funds Is Consistent with “Pricing Anomalies” Noted by Critics.
Studies report economies of scale and scope exist in mutual funds and mutual fund complexes, benefiting investors. However, the 1960s view that such economies necessarily lead to declining mutual fund costs in the long run is not consistent with economic theory. Economies of scale across firm sizes do not imply that costs will necessarily decline over time with ever increasing volume. Moreover, economies of scale do not rule out competition or drive market structure in the mutual fund industry. Hundreds of smaller funds and complexes successfully compete against much larger funds and complexes, suggesting that such economies are relatively modest.
The differences in fees paid by institutional and retail mutual fund investors are consistent with a competitive market, and fee disparities reflect differences in services provided. For example, while both public pension plans and retail clients seek traditional portfolio management services, retail portfolio management also involves managing portfolio liquidity to minimize the cost of accommodating investors’ deposits and redemptions, and costs for websites and investor information, trading, and financial
counseling. In contrast, external portfolio managers for public pension plans generally devote minimal if not zero resources to liquidity management and incur little or no costs for pension investor websites, telephone access, and counseling services.
Investors capture so-called fall-out benefits, consistent with a competitive market. Attempts to exploit investors by withholding fall-out benefits will be undercut by rival mutual funds.
The Governance Structure of Funds Does Not Forestall the Ability to Capture the Benefits of Competition.
In over 40 years of head-to-head competition between the internal and external governance structures of mutual funds, the external form has proven more efficient and thus beneficial to investors. Regardless of whether internal or external forms are used, investment advisors earn their profits on invested capital from fund shareholders, must earn a competitive rate of return, and must charge investors competitive fees to survive. If internal organizational forms provided investors with more protection against conflicts of interest between shareholders and advisors, holding other factors constant, they would have prospered in much larger numbers relative to external forms.
Shareholders’ best protection against conflicts of interest is a competitive market. Investors seek high returns and low fees. To gain new customers and expand assets under management, advisors seek high returns, which are produced in part by low fees. Thus, competitive market conditions provide a common goal for investors and advisors.
The Competitive Market for Mutual Funds Suggests Caution for Regulatory or Judicial Intervention in Fee Setting.
Economic analysis suggests limiting principles for the law and regulation of mutual funds. The law does not provide for rate regulation of shareholder fees or mandatory bidding for advisory contracts. Instead, the law relies on competition to prevent rates above the competitive level.
These limiting principles are consistent with Section 36(b) of the Investment Company Act, which established the fiduciary duty of investment advisors to fund shareholders regarding the advisors’ compensation.
As interpreted in the legal framework established by Gartenberg, Section 36(b) imposes an upper bound on advisory fees and requires a full consideration of all facts relevant to advisory fees, including the existence and effect of price competition.
Economic analysis, limiting principles, and changes in the mutual fund industry suggest the importance of competitive market conditions as a factor to be considered under the Gartenberg legalframework
Competition and Shareholder Fees in the Mutual Fund Industry: Evidence and Implications for Policy
John C. Coates IV and R. Glenn Hubbard1
I. Framework for Assessing Competition in the Mutual Fund Industry
A. Contemporary Analysis of the Fund Industry Centers on Competition
Despite the enormous growth and acceptance of mutual funds by millions of individual and institutional investors, mutual funds have periodically been accused of charging investors excessive fees – that is, fees above the competitive level.2 From an economic perspective, however, a competitive market is the best guardian against fees above the level required to guarantee a well functioning market. With price competition, fund advisors cannot set fees above the competitive level in the long run without driving themselves out of business.
This paper is organized around evidence for and implications of a contemporary view of the mutual fund industry. Section II begins with a review of the structure of the mutual fund industry; structural factors are conducive to competition in the industry. We present the core of our economic analysis in section III, offering evidence that the performance of the mutual fund industry is consistent with competition. In addition to analyzing competitive dynamics in price decreases and market shares, we offer new empirical evidence documenting that investor sensitivity to fees leads funds to compete on fees.3 In section IV, we address “pricing anomalies” noted by skeptics of mutual fund price competition. We conclude that shareholders capture economies of scale and scope as well as so-called “fall-out” benefits. We also explain that the differences in fees paid by institutional investors and retail mutual fund investors are consistent with a competitive market. Section V extends our analysis of competition for investors to the governance structure of funds; we conclude that the governance structure of mutual funds does not prevent investors from capturing the benefits of price competition. Finally, in section VI, we consider implications of our economic analysis for regulatory or judicial intervention. We argue that the competitive market for mutual funds suggests caution for regulatory or judicial intervention in fee setting. In particular, economic analysis and changes in the mutual fund industry suggest the importance of competitive market conditions as a factor to be considered under the Gartenberg legal framework.
B. An Alternative Approach: The 1960s View of Investor Fees Ignores the Contemporary Economic Framework and Evidence
Claims of excessive fees in equity mutual funds first arose in the 1950s and 1960s, when the mutual fund industry was far different in structure and scope than it is today. In the early 1960s, there were fewer than 200 mutual funds and most were load funds. The U.S. Securities and Exchange
Commission (“SEC”) contracted in 1958 with the Wharton School of Finance and Commerce to conduct a study of the mutual fund industry. The Wharton Report, issued in 1962, concluded that mutual fund assets grew substantially in the 1950s, providing lower cost through economies of scale, yet shareholder fees remained at approximately 0.5 percent of assets for most mutual funds.4 The report also concluded that investment advisor fees were lower for non-mutual fund clients, where advisors were allegedly easily fired, in contrast to mutual funds.5 The report concluded that competition had “not been substantially operative in fixing the advisory fee rates paid by mutual funds”6 because lower costs from economies of scale had not led to lower fees and because advisors did not compete for retail mutual fund contracts. The Wharton Report, however, did not test for the existence and size of economies of scale and offered no evidence that costs had declined. It simply assumed such economies were prominent and had resulted in lower costs for mutual funds. Additionally, no analysis of non-mutual fund clients was offered; nor did the study attempt to adjust for differences in asset size, size of accounts, number of accounts, and other factors that distinguished mutual fund and non-mutual fund clients. Finally, the report offered no economic basis whatsoever for the claim that price competition depended on advisors competing for mutual fund contracts.
The SEC issued a report in 1966, accepting without question the Wharton Report’s conclusions that the organizational relationship between investment advisors and mutual funds made arm’s-length bargaining on shareholder fees impossible due to the leverage that advisors had over mutual fund boards of directors, and that competition on fees was absent.7 The SEC concluded that then current law in the Investment Company Act of 1940 (“ICA”) and SEC regulations did not protect investors from excessive fees.8 To guard against the possibility of excessive fees, Congress amended the ICA in 1970 by requiring advisors to act as fiduciaries in regard to their compensation from shareholders and granting shareholders the right to sue based on claims of excessive fees.9
The size and number of competitors in the mutual fund industry have changed drastically since the SEC and Wharton reports. According to the SEC, in June 1966, there were 379 mutual funds in the United States with assets of $38.2 billion and approximately 80 percent of mutual fund assets were accounted for by load funds. 10 In 2004, there were over 8,000 mutual funds with assets of $8,100 billion, and no-load funds accounted for the majority of fund assets.11 Particularly since the early 1980s, there
has been significant new entry and existing firm expansion.12 In addition, numerous innovations have changed the mutual fund industry since the 1960s. For example, money market funds, index funds, exchange-traded funds, fund supermarkets, and defined contribution pension plans all came into existence since the 1960s.
Despite increases in the number of competing funds and distribution channels, the 1970 ICA amendments and additional legal protections for fund shareholders (discussed in section VI below), and limits in the economic analysis underlying the 1960s view of excessive mutual fund fees, this view was revived in 1998 Congressional hearings.13 According to the 1960s view, excessive mutual fund fees and the absence of price competition have allegedly persisted because: (1) investment advisors do not
compete for contracts to manage mutual funds; (2) advisors control the mutual funds’ boards of directors, so that advisors are not vulnerable to being fired and the boards have little independent power to contest the fees charged to shareholders; and (3) advisors deny investors clear knowledge of the fees they are paying.
At the heart of the 1960s view is a perceived conflict of interest between investment advisors and mutual funds. A mutual fund is created and operated by the fund’s investment advisor, who also appoints the fund’s initial board of directors. The fund’s board of directors contracts out all services to the
investment advisor. The fees that an advisor charges a fund for the advisor’s services require approval by the fund’s board of directors (as well as the shareholders for any fee increase).14 The conflict is seen as the advisor’s incentive to maximize its profits by charging the highest possible fees for its services, the fund’s shareholders’ desire to minimize fees so as to maximize the fund’s return on investment, and the advisor’s alleged control over the fee approval process. Because they are generally not vulnerable to being fired by the mutual fund's board of directors, advisors are sometimes alleged to be dealing in effect with themselves when seeking approval of shareholder fees.15
There are two primary types of this alleged conflict of interest. One is the conflict between those wishing to sell at the highest price and those wishing to buy at the lowest price. This conflict is, of course, inherent in all economic transactions and such conflicts are addressed in a market economy by ensuring that competition prevails. Under competition, sellers and buyers transact exchanges at
competitive prices. Under competition, the desire to maximize profits forces firms to minimize costs in order to survive in the long term.
The second type of alleged conflict is the advisors’ alleged ability to have noncompetitive shareholder fees approved by the mutual funds’ boards of directors. But mutual fund investors have alternative mutual fund and non-mutual fund investment choices. While investment advisors may typically not compete for mutual fund contracts (although some compete to be sub-advisors to other
funds), advisors clearly compete for individual investors’ assets by striving for superior returns in order to increase money inflows. Investors in turn can fire any investment advisor on their own by redeeming their shares and investing their assets elsewhere. If price competition prevails, advisors’ attempts to charge excessive fees relative to the services offered will fail in the long run as investors move to lower-fee funds. As long as investors can switch at relatively low cost to lower-cost, better-performing funds, excessive fees cannot persist for more than a short period of time despite the perceived conflict of interest between advisors and fund shareholders.
Proponents of the 1960s view try to buttress their conflict-of-interest theory with claims that investment advisors engage in fee competition for institutional clients but not for mutual fund clients. The explanations offered for these contrasting views are that investment advisors engage in competitive bidding to manage portfolios for institutional clients and institutions can fire external investment advisors on short notice.16 By contrast, retail investment advisors are rarely fired by their mutual funds for either poor performance or fee levels.17 The alternative, investors firing the investment advisor by moving to lower-cost, higher-return funds, is given little credence in the 1960s view. The 1960s view concludes that competition has not served to protect the interests of retail mutual fund shareholders by ensuring that they pay no more than competitive fees.18
II. The Structure of the Mutual Fund Industry is Conducive to Competition
Basic economic theory shows that price competition is determined, in part, by the number of rivals and the extent of barriers to entry and expansion (and thus the effect of potential competition on existing competitors). In addition, both law and regulation provide additional support for price
competition in a given industry. In this section, we review the evidence on market structure in the mutual fund industry, and show that structural conditions are consistent with and conducive to the presence of price competition.
A. Trends in the Number and Concentration of Assets in Mutual Funds and Fund Complexes Support Competition
As noted, one element of economic models of competition is the number of firms competing in a market. While under certain market conditions two firms are sufficient to assure competitive prices, various models show that the larger the number of rivals, the more choices available to consumers and the greater the likelihood of competitive pricing.19 Thus, the greater the number of rivals and choices
available to buyers in a market the less likely is collusion and rivals fixing prices above the competitive level.20 Empirical studies of auction markets and various product lines, such as airlines, railroads, books,
and pharmaceuticals, show prices declining as the number of bidders or rivals increases and as concentration of sales in a few firms declines.21
The mutual fund industry offers many choices for investors, and with choice comes competition. There are thousands of mutual funds divided among equity, bond, balanced (stocks and bonds), and money market funds.22 Using data on equity funds from Strategic Insight, Table 1 shows the number of U.S. equity funds and complexes annually from 1985 through 2004. The number of equity funds and complexes has increased dramatically since 1985. Funds are offered by hundreds of complexes and single fund investment advisors. Figure 1 shows the distribution of funds by complex size in terms of number of funds from 1985 through 2004. The majority of funds, over 70 percent, exist as single funds or part of complexes up through 10 funds. However, fund complexes with from 11 to over 100 equity funds have increased their share of total funds since 1985.
Table 1 also shows that the Herfindahl-Hirschman Indexes (“HHI”) of industry concentration for equity funds and for complexes (measured as the sum of the percent market shares of funds or complexes) are relatively low, indicating that no fund, complex, or small group of funds or complexes, has a
dominant market share. The HHI for funds has fallen steadily as the number of funds increased, while the HHI for fund complexes has risen since 1985 but has remained low. HHIs with a value of 1,000 or less are considered consistent with competition by the U.S. Department of Justice and Federal Trade
Commission horizontal merger guidelines.23 Similar results of relatively low fund HHI levels are shown in Table 2 for the five largest Morningstar investment style categories. As the number of funds increased, concentration declined. Table 3 presents a comparable table at the complex level, where there are fewer entities, and somewhat higher HHIs. HHIs fell in each category over the period to below 1,000, except for the large-cap value category, which declined from 1985 but remained slightly above 1,000 in 2004. However, the HHIs remain today well below what would be considered high levels of concentration – that is, sales dominated by a few funds or complexes.
With thousands of investment choices available to individual investors from hundreds of investment advisors, the likelihood of price collusion is virtually zero. An individual firm gains more from deviating from a price-fixing agreement than by adhering to price collusion, so the likelihood of effective price collusion decreases with the number of firms. Thus, the structure of the mutual fund industry, with thousands of funds and hundreds of investment advisors competing for investors, implies effective price competition.
Firms have different business models and strategies. Some choose to compete for investors by offering extensive services, incurring higher costs with commensurately higher prices, while others choose to compete with less service, lower overhead, and lower prices. With hundreds of complexes
seeking to gain a competitive advantage on their rivals, “price” is an integral element of competition. The view that all fund complexes select not to compete on price, when price competition can gain new
customers and increase advisor profits, is economically unfounded.24
B. The Absence of Barriers to New Firm Entry and Expansion of Existing Firm Supports Price Competition
Conditions that facilitate entry of new firms and expansion of existing firms enhance price competition. Low barriers to entry and expansion inhibit existing firms from raising price (adjusted for product quality and customer service) above the competitive level. Although price competition per se is not inconsistent with high barriers to entry and expansion, potential entry and expansion enhance price competition.
The most direct indicator of barriers to entry and expansion is the extent of actual firm entry and existing firm expansion. Recall that Table 1 demonstrated that the number of equity mutual funds and complexes have grown at a rapid pace since 1985. New mutual funds have been created by both new and existing firms expanding the breadth of their fund complexes. Many of the funds and complexes existing in 2004 entered from 1985 to 2004.25 Table 4 shows the 20 largest equity mutual funds in 2004 that did not exist in 1994 and Table 5 shows the same thing for equity complexes. The top fund entrants are larger than 95 percent of existing funds while the top complex entrants are generally larger than
approximately 70 percent of existing complexes. Funds and complexes entering in the past 15 years have secured billions in new investments. Existing firms have also expanded through new investment flows and asset appreciation.26 A further indicator of growth in the number of funds is presented in Figure 1, which presents the distribution of funds by complex size. Complexes in various sizes from 6 to 100 funds have increased in the number of funds offered. Given no substantial barriers to entry and expansion in equity mutual funds, as indicated by new entry since 1985, there is little basis to claim that such funds have been able to price above the competitive level.
The 1960s view claims that investment advisors earn above competitive rates of return owing to their pricing above the competitive level. Absent barriers to entry and expansion, this observation simply cannot be correct. While some firms will earn above average returns owing to their superiority, with no significant barriers to entry and expansion investment advisors will not earn monopoly rates of return. Instead, there will be a distribution of returns to investment advisors, with superior firms earning above average returns and funds with persistently low returns unable to attract new investment funds and possibly exiting or being merged into better-performing mutual funds. At the margin, firms that remain will earn a risk-adjusted, competitive rate of return.
C. Numerous Distribution Channels and Trends in Distribution Costs Promote Competition
Multiple channels of distribution offer more industry contacts with consumers and greater competition. The more channels the more competition for mutual fund investors, and the more competition for investors the greater the pressure on shareholder fees. Mutual funds are distributed through a variety of channels, all competing for investor funds. With multiple funds competing in each channel, the structure of distribution channels in mutual funds is consistent with price competition. Institutional investors have their own channel, with direct sales from mutual funds to institutions. Current channels include: (1) direct sales,27 (2) retirement plans,28 (3) full-service financial firms,29 (4) fund supermarkets and discount brokers,30 and (5) direct sales to institutional investors.31
Mutual fund purchases in 2001 by major distribution channel segment were approximately: 48 percent through retirement plans; 37 percent through sales force outlets, such as brokers, financial advisors, and insurance brokers; 10 percent through direct sales by funds; and 5 percent through broker-provided fund supermarkets, whereas in 2005 60 percent of shareholders used defined contribution retirement plans as their main mutual fund purchase source.32 The growing importance of retirement plans, such as 401(k) plans, as a main channel for mutual fund investments place additional price pressure on mutual funds as funds compete to be one of a limited number of employee fund investment options. To be selected by an employer, acting as an agent for employees, a fund must offer competitive prices.
Multiple share classes with different fee structures also provide alternatives for purchasing mutual funds. Investors have a range of price choices, depending in part on how long they intend to hold the mutual fund assets. For those purchasing load funds, there are A, B, and C class shares. The A class shares are most common, generally having a front-end load at the time of purchase and a small annual 12b-1 fee. B class shares have a 12b-1 annual fee and a back-end load, more formally known as a contingent deferred sales load (“CDSL”). After the first year, the CDSL generally decreases by one percent each year until reaching zero. C class shares are a modified form of B class shares; they have a 12b-1 annual fee and a CDSL set at one percent the first year, and generally not charged thereafter.33
Funds are subject to competition in each share class. Investors can chose which class is most suitable for financing their mutual fund investments, and determine which fund offers the best financial terms.
Distribution costs have been declining since 1980, with average equity fund distribution costs declining from 149 basis points in 1980 to 40 in 2001.34 Part of the decline came from a shift by consumers from load to no-load equity funds, with no-load funds increasing from 34 percent of total
equity sales in 1980 to 58 percent in 2001.35 Among funds with loads, average load fees declined from 227 basis points in 1980 to 47 points in 2001, and average maximum equity load fees fell from 7.4 percent in 1980 to 4.9 percent in 2001.36 This decline was partially offset by a rise in average 12b-1 fees from 15 basis points in 1985 to 43 in 2001.37 The net decline in distribution costs from load and 12b-1 fees provides unambiguous evidence of price competition in the total fees facing equity mutual fund customers.
D. Law and Regulation Offer Structural Underpinnings for Competition
Law and regulation offer important structural underpinnings for competition in the mutual fund industry. In particular, restrictions under the ICA and SEC have helped funds successfully compete with other sectors of the financial services industry; that is, investors could invest in funds knowing that the usual temptations for self-dealing or outright theft were greatly mitigated by law and regulatory oversight.38 Unlike traditional business corporations, funds are subject to detailed laws and regulations that channel the myriad ways that fiduciaries can extract value from funds into a single, readily monitored path – advisory fees.39 Regulators require that fee increases be approved by fund shareholders (who have little interest in raising fees). Recent scandals involving the fund industry do not change the fact that the industry has long been regulated and that it has been a remarkable success not only from the perspective of growth, but also in remaining relatively untroubled by serious financial lapses (compare the thrift crises of the 1980s, the bank crisis of the early 1990s, and the large numbers of complaints brought by
individual investors against brokers in the last few years).40 The indignant and rapid public and
regulatory response to the discovery of late trading and undisclosed frequent trading (both of which were already illegal) demonstrates the seriousness of the oversight of funds.41 More directly relevant to fees, fund directors are subject to fiduciary duties under both the ICA and state corporation or equivalent business trust law.42
Another legal restraint – from an economic perspective arguably more important in structurally supporting competition than the ICA, SEC or fiduciary duties – is embedded in the contracts between funds and fund shareholders: redeemable shares.43 Investors’ ability to demand nearly immediate repayment of their investment at current net asset value (“NAV”) is the defining feature of the open-end investment company (that is, the mutual fund). 44 While the ICA and SEC regulations help make
redeemable shares even more effective at providing investors with assurance that advisors will deal fairly with funds, it is worth noting that redeemable shares in mutual funds were developed in the marketplace in the 1920s, and that market forces had already begun to allow mutual funds to dominate closed-end companies prior to enactment of the ICA. 45 Along with mandatory disclosure, the requirement of an independent custodian for fund assets, and rules governing how NAV is calculated, the simple mechanism
of redeemable shares is perhaps the most important aspect of fund regulation – often neglected by critics46 – that directly facilitate competition in the fund industry. That redeemable shares facilitate competition among funds is consistent with the fact that, in the market for pooled investments, open-end companies with redeemable shares have largely displaced closed-end funds, which lack redeemable shares and instead sell shares only on a sporadic basis.47
III. The Performance of the Mutual Fund Industry is Competitive
In addition to theory and evidence showing that the structure of the fund industry is price-competitive, the performance of the industry and the behavior of investors show that it is price competitive. Funds have frequently reduced fees, as we review in subsection A, and the evidence of overall trends in fees is at least as consistent with long-term reductions in fees as it is with long-term increases (subsection B). Funds and fund complexes experience large and frequent changes in market shares (subsection C), and we provide new econometric evidence showing that an important factor in the demand for funds and complexes is investor sensitivity to fees and changes in fees (subsection D). Funds with lower expenses, holding other factors constant, perform better – that is, have higher net returns. Such funds outperform rivals and grow in asset size.48 Shifts in funds’ size are therefore indicative of relative returns and price competition.
A. Price Reductions Provide Evidence of Competition
A clear example of price competition takes place in money market mutual funds. Differences in money market fund net returns can be traced to differences in shareholder fee expenses, with the lowest-fee money market fund having the highest net return.49 Susan Christoffersen found that close to 80 percent of institutional money market fund managers waived almost half of their contractual advisory fees and 55 percent of retail money market fund managers waived almost two-thirds of their contracted-for fees.50 Almost half of money market fund total expenses were being waived in the early 1990s. Low-performing retail and institutional funds waived fees to improve their net performance and ranking relative to rivals. High-performing retail money market funds also waived fees to improve performance in an attempt to increase investment flows into their funds. For equity mutual funds, Christoffersen found that 37 percent waived fees to be more price competitive. Christoffersen also found that fee waivers changed frequently throughout a calendar year, reflecting price responses to competitive pressures. Such widespread waiving of fees by investment advisors reflects price competition in both money market and equity mutual funds.
Table 6 shows the number of equity mutual fund classes annually with fee waivers in the Simfund dataset. Over 40 percent of the share classes waived fees annually since 1998, with 48 to 49 percent in recent years. Price reductions through waivers rose substantially since 2001.
Also seen in Table 6 is the number of equity share classes with fee increases, decreases, and no change in price. Fee decreases occurred more frequently than fee increases in some years. The 1960s view’s claim that conflicts of interest determine advisor fees implies that fees never decline and are pushed steadily upward in the absence of price competition. The evidence is to the contrary; fee decreases are relatively common.
B. Trends in Shareholder Expense Ratios Offer Evidence of Price Competition
Proponents of the 1960s view contend that average shareholder expense ratios for equity mutual funds have risen since the 1950s.51 Based on this finding, they conclude there is no (or, at best, little) price competition among mutual funds. They argue that if price competition existed, expense ratios would have declined over time given economies of scale in mutual fund operation, especially in spreading the fixed costs of research and portfolio management over more assets through new investment funds and the large appreciation in fund assets since the 1970s.52
Studies of trends in average expense ratios report conflicting results, depending on the time period analyzed, how expense ratios are measured, and the sample of funds analyzed. Some studies find increasing average expense ratios over long time periods and some find decreasing ratios. Results are also mixed within shorter time periods.
Studies on trends in expense ratios tend not to follow a fixed group of funds over an extended period of time, instead focusing on all funds in a given year and comparing results across years. The number, size, and composition of funds have changed substantially over the past 25 years, and those changes have affected average expense ratios. 53 For example, higher expense ratios predominate in international funds, small-cap funds, funds in smaller complexes, and newer funds.54 Conversely, lower expense ratios predominate in index funds, bond funds, money market funds, and large, older income and value funds.
Studies finding apparent evidence of increasing expense ratios over various subperiods since the 1970s, as shown in Table 7, include those by the SEC, John C. Bogle, Brad M. Barber, et al., and the Investment Company Institute.55 For the S&P 500 Index funds, Ali Hortacsu and Chad Syverson found that while large new fund entry occurred from 1995 to 2000, it was dominated by higher-fee firms and thus asset-weighted average fees in their sample increased from 0.27 percent in 1995 to 0.32 percent in 2000.56 The SEC concluded that the primary cause of increasing average expense ratios was that firms
shifted from load fees, which are not included in expense ratios, to 12b-1 fees, which are part of expense ratios and have been rising over time. Examining pure no-load funds, with no 12b-1 fees, the SEC found the average expense ratio rose slightly from 0.75 percent in 1979 to 0.80 percent in 1992, but declined to 0.66 percent in 1998, followed by a rise to 0.69 percent in 1999.57 Thus, overall, the SEC actually found a decline in expense ratios.
A number of studies have found evidence of expense ratios declining over time. The U.S. General Accounting Office found the average expense ratio (without accounting for load fees) for the 46 largest equity funds, declined from 0.74 percent in 1990 to 0.65 percent in 1998, with a rise to 0.70 percent in 2001.58 They found that 39 of the 46 funds reduced their expense ratio from 1990 to 1998, two did not change, and five experienced a higher expense ratio. Despite this general decline in expense ratios, the GAO concluded that fund advisors compete primarily on the basis of performance (returns) or services to investors rather than on fees charged. Because returns necessarily embody fees and advisors compete on returns, competition on returns includes competition on fees.
Michele LaPlante examined equity and bond expense ratios for the period 1994 through 1998, distinguishing between funds sold through no-transaction-fee fund supermarkets and those sold outside fund supermarkets.59 The expense ratio of no-load funds available outside supermarket channels declined from an average of 0.74 percent to 0.54 percent, while the ratios of funds sold through supermarkets fell from 1.06 to 0.89 percent.60 Expense ratios for funds sold through supermarkets were 0.17 to 0.19 percentage points higher on average than expense ratios for funds unavailable through supermarket channels due to the added cost of distribution.
As Table 7 shows, studies examining total fees, including amortized load fees, tend to find declining total fees. Examining expense ratios from 1970 to 1989 for no-load and load funds, Erik Sirri and Peter Tufano found that expense ratios rose in no-load funds from approximately 0.60 to 0.75 percent and fell in load funds from approximately 2.25 to 1.9 percent. Overall, total fees fell from 2.2 to 1.5 percent.61 In a second study of 690 mutual funds from 1971 to 1990, the authors found that average expense ratios increased over the period from 0.96 percent to 1.44 percent, but total fees fell over the same period from 1.66 percent to 1.37 percent.62 Studies by the SEC and Investment Company Institute looking at load fees alone found significant declines from 1980 to 1999 (SEC)63 and from 1980 to 2002 (Investment Company Institute).64 Calculating expense ratios by fund complex and amortizing loads, Khorana and Servaes found average expense ratios declined from 1.40 to 1.19 percent over the period 1979 to 1998.65 Amortizing loads over a five-year period, the SEC found average expense ratios fell from 2.28 percent in 1979 to 1.88 percent in 1999.66 Similarly, adding amortized load fees to expense ratios, the Investment Company Institute found expense ratios declined from 1980 to 2002 in equity funds from
2.26 to 1.25 percent, in bond funds from 1.53 to 0.88 percent, and in money market funds from 0.55 to 0.34 percent.67
These results indicate that drawing conclusions about price competition in mutual funds based on trends in expense ratios can be misleading unless one accounts for total shareholder costs, including front- and back-end loads, changes over time in the composition of the funds examined, and changes in
distribution channels. The large increase in small, new funds in the 1990s and the shift in investing toward international and specialty-sector funds with higher expense ratios tended to push average expense ratios higher, while the fall in load fees pushed average total fees lower. The rise in 12b-1 fees, including financial advisor fees, tended to move expense ratios higher. In addition, the introduction of
no-transaction-fee fund supermarkets in the early 1990s offered direct competition to fund complexes and thus provided easier access to more investment choices in funds and transfers between funds, but added to higher expense ratios. To summarize, the 1960s view’s conclusion that expense ratios have risen over time is contradicted by numerous studies, and the results are sensitive to how the expense ratio is measured and over what period of time. Drawing a conclusion that price competition is absent in mutual funds because expense ratios are rising is unwarranted.68
C. Changes in Market Shares Offer Evidence of Competition
Changes in market shares are a direct reflection of competition, with more successful funds growing at the expense of rivals. Table 8 presents market shares of the top 25 equity fund complexes in select years from 1985 through 2004. As the table shows, market shares for complexes are not stable, reflecting competition among complexes. Some funds experienced substantial declines in business, such as American Express’ market share falling from 3.7 percent in 1985 to 1.1 percent in 2004 and Dreyfus’ share declining from 3.2 percent to 0.9 percent over the same period. Other funds experienced significant growth in share, including American Funds, Fidelity, and Vanguard. Tables 9a through 9e show similar market share data for five investment style categories. Again, market shares are far from stable, reflecting competition among complexes within investment style categories.
Even in the short term, substantial shifts in shares occur as competition on performance leads investors to shift among funds and fund complexes. Examples from Table 8 for the period 2000 to 2004 include American Funds’ share increasing from 8.5 percent to 14.1 percent and Dodge and Cox's share rising from 0.3 to 1.6 percent.69 Substantial share changes from 1990 to 2000 include Janus' share rising from 0.6 to 4.5 percent and Putnam Funds’ share rising from 2.8 to 5.4 percent. American Funds outperformed the S&P 500 in recent years. As a consequence, American Funds grew faster than many of its rivals over the past three years and its share grew accordingly. American Funds’ strong performance is attributed to astute stock selection as well as low shareholder fees, in some cases 50 percent lower than
similar funds according to Morningstar, enhancing American Funds’ performance.70 Low fees represent price competition and are reflected in returns to stockholders.
D. Investor Mobility Across Funds Provides Important Evidence of Price Competition
Effective mutual fund competition entails the ability to redeem shares and move assets to better performing funds. If investors’ movements from one fund to another are subject to high switching costs, such as large back-end loads, and switching costs are not revealed a priori, investors are more susceptible to fees being raised to reflect the switching costs. Accordingly, choosing no-load funds and funds with no or reduced back-end loads facilitates investor mobility, and increased mobility enhances price
competition.
However, investors can avoid switching costs on old investments by investing new contributions elsewhere. In addition, markets have evolved to minimize switching costs. Supermarket-style fund marketing provides no-transaction-fee investing in numerous funds, facilitating shifts between mutual funds. Through fund supermarkets investors can readily switch to the hot funds of the moment, or invest in a set of funds for the long term. Furthermore, fund complexes typically charge no fees for switching within the fund complex. Large fund complexes may offer scores of funds, facilitating asset allocation and diversification. Most importantly, with the widespread availability of no-load funds, switching costs are very low. The Simfund equity fund dataset indicates that 58 percent of assets were in no-load funds in 2003 and 59 percent in 2004.71
Equity mutual funds typically seek long-term investors. However, nothing prevents investors from switching from one type of fund to another, such as equity, bond, and money market funds; within a fund sector, such as specialized equity funds; or within bond funds. (However, funds seek to minimize high frequency trading to reduce overall shareholder transaction costs.) With low switching costs, investors can move in and out of stock, bond, and money market funds with changes in their personal requirements and market conditions, such as interest rates, unemployment, and expectations for business profits.72
Not all buyers have to switch from high- to low-cost products to affect price competition; only price-sensitive buyers. Given a sufficient number of buyers engaging in price search for a given quality of product and service, rivals must price competitively to retain price-sensitive customers, which benefits all their customers, both price searching and non-price searching customers. This process applies as much to mutual funds as it does to everyday goods, such as foods, clothing, and household products.
Mutual funds compete for investment funds by striving to outperform their rivals. Superior returns increase fund flows and market share. A variety of studies have tested for price competition
between funds by determining whether investor costs, expense ratios, and load fees are related to returns, fund flows, and market shares. These studies provide direct tests of price competition. For example, an inverse relationship between expense ratios and returns, flows, and market share is consistent with price competition. The lower expenses the greater returns, leading to greater fund flows and market share relative to rivals. The consensus results show price competition between mutual funds affecting market shares and fund flows. Stated differently, studies show that investors are sensitive to expense ratios, investing where expense ratios are relatively low.
Ajay Khorana and Henri Servaes examined the relationship between fund expenses and fund complex shares over the period 1979 to 1998 for the universe of open-ended fund complexes.73 They found a strong inverse relationship between expenses and market share; the lower expenses the higher fund market share. They found the same inverse relationship between fees and market share at the fund objective level and concluded that “Competing on price is an effective way of obtaining market share.”74 The results held after they adjusted for the fact that larger funds may charge lower fees. Similar results were found by Mark Carhart who examined diversified mutual funds from 1962 to 1993, finding a negative relationship between expense ratios and fund abnormal returns and between load fees and abnormal returns.75 To summarize, the best-performing fund complexes had the lowest fees and the highest market shares. Consistent with these findings, Barber, et al. found the lowest decile of operating expenses in their sample represented 36 percent of total net assets while the highest operating expense decile represented only one percent of assets.76 Investors are sensitive to price and concentrate their investments in the lowest-fee funds.
Studies have found that fund flows are positively related to various measures of returns over the period and fund ratings, and ratings are based in large part on past returns.77 In a sample of 690 funds from 1971 through 1990, Erik Sirri and Peter Tufano found a positive relationship between returns and fund flows and the relationship was especially strong for firms in the top quintile of returns.78 They also found that total fees and changes in fees were inversely related to growth in fund flows. Lower-fee funds and funds that reduced their fees grew faster than higher-fee funds. In a study of 632 equity mutual funds from 1979 to 1990, the same authors found that lower-fee funds gained market share over higher-fee funds.79 Funds charging 10 percent more than the average level (approximately 15 basis points)
experienced 1.2 percentage points lower growth than funds charging the average fee.80 Vikram Nanda, et al. examined the relationship between money growth in mutual funds and expense ratios, along with other variables, finding an inverse relationship; the lower expense ratios the greater the funds’ money growth.81 Specifically, Nanda, et al. estimated the extent to which mutual funds’ cash flows are affected by their performance and the performance of other funds in the mutual fund complex. They showed that
complexes with at least one Morningstar five-star-rated fund attract greater inflows both to the star fund and to other funds in the complex. Their estimates imply that a 10 percent decline in expenses increases new fund flow by 2.5 percent, confirming the sensitivity of investors to fees.
These recent studies – confirming price competition – in which lower-fee funds have higher market share, grow faster, and have greater returns than higher-fee funds – raise additional questions, which we explore below. First, the “demand for funds” is in part a demand for the complex of funds. Second, as Michael Koehn, Jimmy Royer, and Marc van Audenrode point out, the empirical
specifications used by existing studies on fund flows (such as Nanda, et al.) underestimate the sensitivity of investors to fees.82
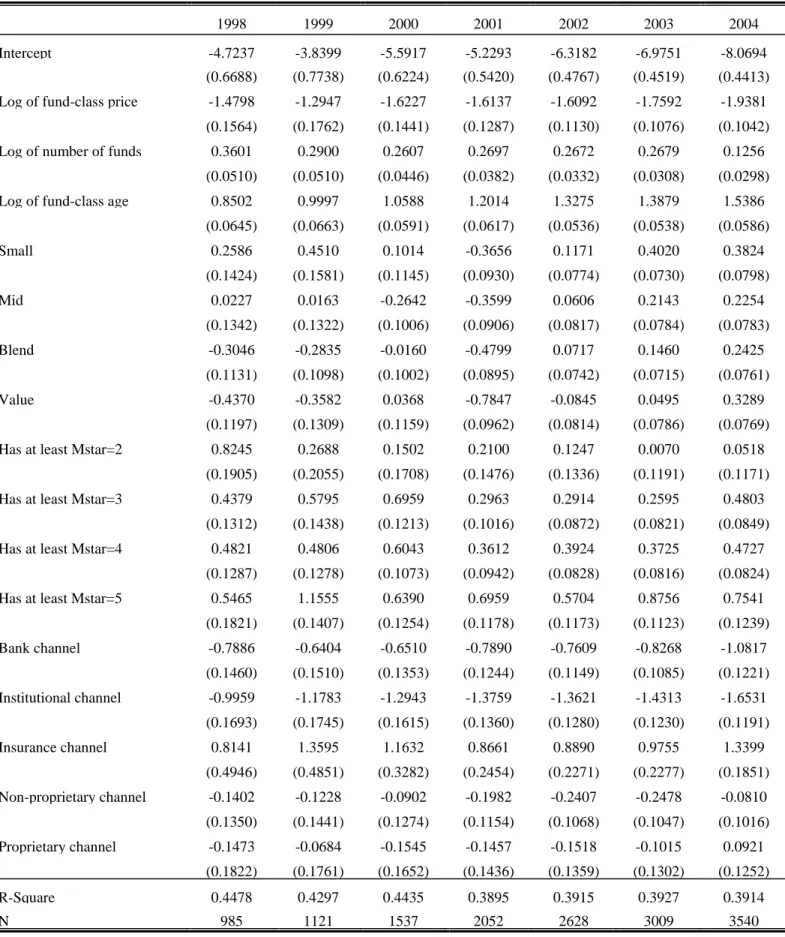
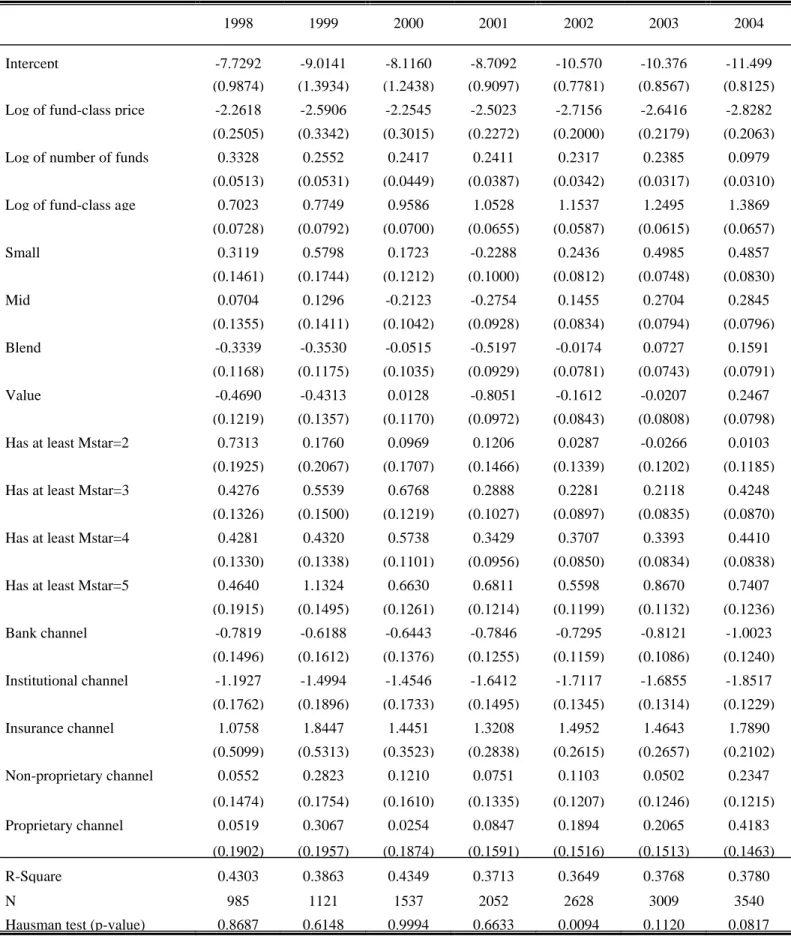
Using the Simfund data over the period from 1998 through 2004, we find that both a fund complex’s and an individual fund’s total assets are very responsive to fees. (We present our findings in detail in the appendix to this paper.) In our econometric tests, we estimate the effect of fees on a fund’s (complex’s) total net assets in each year from 1998 through 2004. In so doing, we hold constant other factors determining investors’ relative fund asset allocation. Those factors in our analysis include a fund's Morningstar rating, number of funds in a complex, complex or fund age, investment category, and channel of distribution.
We estimate a range of elasticities of market share with respect to fees for funds of approximately -2.3 to -2.8 and for fund complexes of -1.5 to -1.9. These estimates imply that a 10 percent increase in fund fees, all else equal, decreases a fund’s share of total net assets by 23 to 28 percent and a complex’s share of assets by 15 to 19 percent. While broadly consistent with implied elasticities estimated by William Baumol, et al.,83 our estimated effects of fees are larger than those implied in some earlier studies.84 In addition, we find that investors select fund complexes and not just individual funds in making their asset allocation decisions. Taken together, our results strongly support competitive responses of assets to fees.85
IV. The Competitive Market for Mutual Funds Is Consistent with “Pricing Anomalies” Noted by Critics
A. Economies of Scale and Scope in Funds and Complexes Must be Analyzed Carefully
The existence and size of economies of scale in mutual fund management, that is, declining costs per unit as output increases, have been a central issue in the debate over whether shareholders are being charged excessive fees. The Wharton Report found that investment advisors tended to charge an
the rapid growth in mutual fund assets in the 1950s.86 In approximately 80 percent of the funds they studied, the fee rate remained at 0.5 percent despite growth in assets managed. As a consequence, the Wharton Report concluded that investment advisors were gaining from economies of scale but not sharing the cost savings with shareholders. Had there been competition on fees, the report concluded, cost
savings would have resulted in non-trivial reductions in fees. Therefore, according to the Wharton Report, mutual fund investment advisors did not compete for mutual fund contracts or investors on the basis of fees. The Wharton Report further argued that because investment advisors ran the funds and were difficult to discharge, there was a lack of arm’s-length bargaining, so advisors did not have to compete on fees.
As noted above, this view, an absence of price competition on shareholder fees, was accepted by the SEC in the 1960s.87 Indeed, the view that large economies of scale existed in mutual fund
management, but were not being passed on to shareholders due to an absence of price competition, motivated the SEC to recommend changes to the ICA in the late 1960s, some of which were adopted by Congress in the 1970 Amendments to the ICA.
Lower costs per unit as output increases can arise from a variety of sources – including greater specialization in the use of capital and labor, learning-by-doing as output grows, and spreading fixed set- up and operating costs over greater output. Observers have long assumed that there are economies of scale in mutual fund operation due to fixed set-up costs. Using assets as a measure of output, they assume that the costs of securities research and portfolio management are relatively fixed so it costs roughly the same to conduct research and manage portfolios for both small and large asset portfolios.88 Even if research and portfolio management costs increase with asset growth, economies of scale may exist if advisors become more efficient in managing resources through specialization and learning-by-doing.
Total assets in mutual funds have grown decade by decade through market price appreciation and new investment, prompting some observers to expect declining expense ratios and shareholder fees. The 1960s view claims that expense ratios have risen with asset growth, which allegedly shows that cost savings from economies of scale are not benefiting investors due to an absence of competition on shareholder fees.
This argument makes little economic sense. Underlying costs for mutual funds can increase over time while economies of scale exist at any point in time. Hence, economies of scale do not necessarily imply that average costs decline over time. Numerous industries experience large economies of scale, such as automobiles, beer, and telecommunications, while their underlying costs rise as the costs of inputs – labor, raw materials, technology, and so forth – increase. Moreover, in mutual funds, economies of scale do not rule out competition between small and large funds and complexes.
One approach to identifying the presents of economies of scale is to examine the survival of firms or plants by size distribution categories. Optimum sizes can be inferred by shifts in the size distribution of firms over time, as firms move to the most efficient size ranges or depart the industry.89 Such analysis shows that there is a wide dispersion in sizes across mutual funds and mutual fund complexes; small funds and fund complexes have competed for years against much larger funds and complexes, indicating that there is no unique optimum size (minimum efficient scale) associated with economies of scale in mutual funds. Tables 10 and 11 present the distribution of surviving funds and complexes through 2004, respectively, by size decile, with 1 representing the bottom 10 percent. As shown in Table 10, 44.6 percent of funds in the smallest decile in 1985 survived through 2004 and 46.7 percent of the smallest funds survived starting from 1995. The survival rate of funds increases with decile size which is not unexpected because larger funds can survive a given percentage redemption rate better than smaller funds.
The matrices on the right hand side of Table 10 indicate the percentage of surviving funds that did not change size deciles (shown in bold) between the starting year and 2004. Within a given decile size, cells to the right of the highlighted cells show the percentage of funds that moved into larger size deciles over time and cells to the left show funds that moved into smaller fund deciles over time. If the 1960s view that economies of scale were large and ubiquitous was correct, small funds would suffer a cost disadvantage and would not survive. The fund survivor table shows this was not the case. Of the surviving fund in the smallest decile starting in 1985, 34 percent remained in the bottom half of the distribution. For funds starting in 1995 that survived through 2004, 66 percent remained in the bottom half of the size distribution. The analysis also shows that some funds decline in size over time, contrary to the 1960s view that economies of scale are large and pervasive.
Similar data for complexes are shown in Table 11. Of the surviving complexes in the smallest decile starting in 1985, 55 percent remained in the bottom half of the size distribution by 2004. For complexes as of 1995 in the smallest decile, 79 percent remained in the bottom half of the distribution by 2004. As with funds, large complexes frequently decline in size, indicating that smaller size complexes, as with funds, do not suffer a major cost disadvantage relative to larger size complexes.
If economies of scale in mutual funds were significant, small funds and complexes would not be cost competitive. While economies of scale in mutual funds may exist, they are likely relatively modest because small funds and complexes compete with larger funds and complexes. To summarize, the claim that economies of scale in mutual fund management necessarily lead to declining industry expense ratios over time given price competition is inconsistent with basic economics and industry reality.
Costs extend well beyond portfolio management. Management costs can include distribution and marketing costs. Such costs may be subject to economies of scope as a fund complex adds more
products. Additional expenses include transfer agency, communication with investors (websites, telephone access, fund reports), custodial service, reports to regulatory agencies, brokerage fees, and overhead expenses such as management, legal, regulatory, and accounting. Whether economies of scale in these and other areas exist has been discussed in court cases challenging the level of shareholder fees.90
Some prominent studies have found evidence of, or evidence consistent with, economies of scale in mutual fund complexes. The studies range from simple examinations of how expense ratios change with fund asset size to econometric models of fund costs and size. Holding other influences on costs constant, such as portfolio turnover, number of funds in a complex, prior fund returns, fund objective, and age of fund, regression analysis using assets as the measure of output generally find evidence of
economies of scale – that is, declining cost per unit of assets as assets increase.91 The consensus view from regression analysis is that economies of scale exist; however, there is no consensus on the size of such economies and at what level of output unit costs no longer decline or diseconomies of scale occur.
Economies of scope (lower costs to produce two or more products jointly than to produce them independently) have also been estimated for mutual fund complexes. Adding funds to a complex can contribute to covering common costs, such as information technology and a computer system. Studies tend to find economies of scope in mutual funds for smaller complexes, implying that such economies are exhausted in the earlier stages of product extensions.92 This finding is consistent with the evidence that small complexes compete with larger complexes, indicating that small complexes need not incur a significant cost disadvantage.93
To summarize, a number of studies have found evidence of economies of scale and scope in the mutual fund industry, however, the studies disagree on the magnitude of such economies. As noted, economies of scale are not so large as to limit competition to a few firms, given that hundreds of complexes of varying size compete in equity funds alone. The claim that mutual funds experience large economies of scale that do not benefit investors because expense ratios have risen over time is false; there is substantial evidence that expense ratios have declined over time and little evidence of large economies of scale.
B. Price Dispersion Supports Investor Demand for Mutual Funds in a Competitive Market
Claimants of excessive fees and expense ratios also point to the range of price dispersion in shareholder fees across passive funds, such as S&P 500 index funds, as reflecting an absence of price
competition.94 Such claims reason that if price competition prevails, there will be little price dispersion across funds, especially for an essentially identical good like the returns on S&P 500 index funds. These claims also point to a difference in fees charged to retail and institutional investors in passive funds as further evidence that price competition is absent. If price competition existed in retail funds, as in institutional funds, according to this view there would be little difference between retail and institutional investor fees for identical services. The view implicitly assumes that the cost of duplicating the S&P 500’s performance is identical for retail and institutional funds.
Common experience and economic research show that price dispersion for specific products is widespread in competitive markets and is perfectly compatible with price competition. Careful shoppers are well aware that prices for identical items differ across types of outlets, such as full service department stores versus mass merchandiser price discount stores. Price dispersion in everyday highly competitive markets is well documented by economists.95 Economic theory shows that price dispersion in
homogeneous good markets is a function in part of search costs.96 Given that consumers lack perfect information, they search up to the point where search costs just exceed the expected lower price. Thus, search cost, including the opportunity costs of an investor’s time, provide a basis for price dispersion in competitive markets.
Economic theory also points to differentiation by type of outlet, such as services offered, and differences in preferences of buyers as further causes of price dispersion among homogeneous products. Products are necessarily associated with the services, amenities, reputation, and location of outlets, which differentiates products in accordance with buyer preferences.97 Thus, not even for physically
homogeneous goods is a homogeneous purchasing experience ensured.98
The importance of search costs and seller differentiation in explaining price dispersion applies with equal force to variation in prices across mutual fund investors and, more specifically, investors in S&P 500 index funds. Given that there are over 8,000 mutual funds, there are obviously search costs in choosing between mutual funds. Various specialized research firms, such as Morningstar, Lipper, and Yahoo Financial, have long served the demand for information on mutual funds to reduce buyer search costs. In addition, there are thousands of financial advisors and pension plan administrators serving to economize on search costs by providing information for first-time and subsequent mutual fund investors. Moreover, while gross returns vary little across S&P 500 index funds, the funds are differentiated in terms of marketing and investor access in order to serve different segments of the demand for mutual funds. At one end is a fund like the Vanguard 500, which promotes low prices. Investors seeking a low-price fund with basic service can select the Vanguard 500, assuming they meet Vanguard’s minimum investment requirements and do not subsequently fall below that minimum investment, which would trigger
additional fees by Vanguard. At the other end of the service and price spectrum are funds providing more access to fund personnel and financial advice, with higher costs of marketing. Vanguard and other funds’ business model is based on being a low-cost alternative, while still other funds provide a larger set of services to investors, at a higher price.99 That is, expense ratios will vary depending on the type of services provided and selected by investors.
Ali Hortacsu and Chad Syverson studied price dispersion and the role of search costs and seller differentiation in S&P 500 index funds.100 They found substantial price dispersion across 85 S&P 500 index funds. At the extremes, prices ranged from 9.5 to 268 basis points. The price differences are not likely due to differences in returns because gross returns are similar across the funds. In addition, the number of S&P funds increased from 24 in 1995 to 85 in 2000. The authors ask: if entry and more firms increase competition, why did price dispersion remain wide and persistent?
Hortacsu and Syverson found that price dispersion in retail S&P 500 index funds is consistent with investor search costs, differences in services offered to investors across the funds, and changes in the demographics of investors in the late 1990s. Over the 1995-2000 period, entry into S&P 500 index funds was dominated by higher-price funds and asset market shares within this sector shifted from lower- to higher-price funds. Simultaneously, large numbers of new investors with little knowledge of mutual funds entered. As novice investors with a high demand for information, they tended to rely on financial advisors, whose services are paid for by front- and back-end loads and 12b-1 fees – that is, the highest-price funds. In the face of search costs and large differentiation across funds, new investors sought financial advice and guidance, which is not as extensively available through the lowest-price S&P 500 index funds. It is not surprising that price dispersion persisted with new entry during this time period.
Focusing on the price of an individual fund may also be misleading. The median number of funds owned by an investor is four.101 If investors prefer the convenience of multiple funds at the same fund complex, then investors are interested in the bundled price of all their funds, including investing in the complex’s index fund. The price of the fund as a standalone product is not as relevant as the bundled price across all the funds in a complex and the services received. Index funds arise to serve the divergent interests of all index fund investors, from those who seek financial advice, asset allocation
recommendations, access to a broad fund complex, an inexpensive place to park their funds, high-quality investor services, and easy access to investment and redemption choices – to those who want no more than the lowest-price S&P 500 index fund with limited investor services. The range in fees reflects these divergent interests in the services sought; they are not a sign that price competition is absent.
Table 12 shows measures of price dispersion across investment styles. Price spreads differ across the various styles and sectors. As seen, the S&P 500 index fund style has the lowest median expense
ratio, but relatively high price dispersion. It is also the case that more than 90 percent of investments in the S&P 500 index sector are concentrated in funds with the lowest expense ratios, below 0.5 percent (see Figure 2). In a low-price sector, investors are concentrating their investments in the lowest-priced funds, indicating investors’ responsiveness to the level of fees.
To summarize, while the 1960s view contends that price dispersion reflects an absence of price competition, the opposite is true: price dispersion is perfectly consistent with a competitive equilibrium. Indeed, price dispersion reflects search costs for some investors. Prices also differ because of cost differences across funds due, for example to average balance size. Buyer choice is a hallmark of
competitive markets. The price dispersion in, for example, S&P 500 index funds demonstrates substantial choice available to investors.
C. Fees Paid By Institutional and Retail Investors Are Consistent With a Competitive Market
The 1960s view concludes that investment advisors compete aggressively on price for
institutional clients, in particular public pension plans, in contrast to the alleged lack of price competition for retail mutual fund customers.102 Starting with the 1962 Wharton Report, various studies have reported that public pension plans, due to price competition, incur lower advisory fees than retail mutual funds.103 Some attribute the lower prices to institutional clients to the absence of a conflict of interest between investment advisors and institutional clients.104 Advisory fees to public pension funds are viewed by the 1960s school as the competitive benchmark for what retail mutual fund prices would be if price
competition prevailed.
To be meaningful, price comparisons among goods or services require the supply and demand conditions for the products to be equivalent. Without comparing the same product under the same market conditions, there is no basis for a price comparison. If retail and institutional customers consume
different services or differ in the underlying cost of generating services, simple price comparisons are invalid.
On an overall cost basis, there is little justification for comparing fees paid by public pension plans and retail mutual fund shareholders. There are significant product and cost differences between advising retail mutual funds and public pension plans. Retail mutual funds provide investors liquidity, incurring costs for cash management and possibly lower returns to meet claims and the costs of
processing redemptions. Retail customers purchase, sell, and communicate with funds, resulting in costs to the fund. External portfolio managers for public pension funds do not face the same costs associated with providing liquidity, websites, and shareholders moving in and out of the fund. Servicing retail
mutual fund shareholders requires providing 24-hour telephone access, Internet websites, checking and direct deposit services, tax information, transfers between mutual funds, preparation and distribution of prospectuses, reports to the SEC, and retirement plan advice. Retail mutual funds also face costs in distribution and marketing to replace redeemed assets and to grow the fund. Managing a portfolio for a public pension fund does not entail similar distribution and marketing expenses. The products and costs of servicing retail shareholders and public pension fund clients are quite distinct, invalidating any comparisons of operating expense ratios and investor fees.105
The Wharton Report examined 54 investment advisors on the fees they charged mutual and non-mutual fund clients. Fees were found to be at least 50 percent higher to non-mutual funds in 39 cases, and reached 500 percent higher in nine cases.106 The SEC’s 1966 study examined advisory fees at six banks for pension and profit-sharing plans. The fee was 0.06 percent on a portfolio of $100 million at five of the banks and 0.07 percent at the remaining bank.107 The SEC compared these fees to the 0.50 percent fee that the Wharton Report found the majority of investment advisors at the time were allegedly charging retail mutual funds. The SEC concluded the disparity reflected a lack of price competition between retail mutual funds. However, it acknowledged that part of the fee difference came from: (1) the lower cost of managing pension portfolios owing to a greater emphasis on fixed-income securities in pension plans; and (2) the greater risk and cost of starting and operating a retail mutual fund.108 The Wharton and SEC fee studies are examples of nonsensical comparisons of two different products with different services. In neither case is there a basis for concluding that price competition is absent in retail mutual funds.
To avoid nonsensical product price comparisons, some studies of fee levels attempt to compare like services between retail mutual funds and public pension plans, such as the pure costs of stock selection and portfolio management. They reason that such services are identical for each client base, be it retail mutual funds or public pension plans, so pure portfolio management costs and thus fees should be identical if price competition prevails in both market areas. A further refinement is to compare like investment styles in portfolios. As we noted earlier, expense ratios are generally higher for international, small-cap, and specialized funds as compared to large-cap income or growth funds.109 Therefore, valid comparisons of fees must consider similar style funds, such as large-cap income funds, mid-cap growth funds, small-cap growth funds, and so forth. However, even if stock research, selection, and portfolio management costs could theoretically be accurately identified, the portfolio management requirements are sufficiently different – managing liquidity in one case and not the other – that price comparisons would be invalid.110
More recently, John P. Freeman and Stewart L. Brown surveyed the top 100 public pension plans in 1998 on the fees they paid external equity portfolio managers. They received usable responses from 36
plans, with the majority sending the fee schedule for different asset size funds.111 The authors concluded that retail mutual fund advisory fees were twice as high on average as fees paid by public pension plans, 56 versus 28 basis points. They found similar differences when the public pension and mutual funds were