doi: 10.17265/1934-7359/2018.07.006
Concept Paper: Developing Pavement Structural
Deterioration Curves
Gregory Kelly1, Chai Chai2, Sittampalam Manoharan3, Deborah Delaney4 and Sanaul Chowdhury5 1. School of Engineering, Griffith University, Southport, Australia
2. Griffith University, Australia
3. Department of Transport and Main Road, Brisbane, Australia 4. Griffith University, Australia
5. Griffith University, Australia
Abstract: An SN (structural number) can be calculated for a road pavement from the properties and thicknesses of the surface, basecourse, sub-base and subgrade. Historically, the cost of collecting structural data has been very high. Data were initially collected using Benkelman Beams and now by FWD (falling weight deflectometer). The structural strength of pavements weakens over time due to environmental and traffic loading factors but due to a lack of data, no structural deterioration curve for pavements has been implemented in a PMS (pavement management system). IRI (international roughness index) is a measure of the road longitudinal profile and has been used as a proxy for a pavement’s structural integrity. This paper offers two conceptual methods to develop PSDC (pavement structural deterioration curves). Firstly, structural data are grouped in sets by design ESA (equivalent standard axles). An ISN (“initial” SN), SNI (intermediate SN) and a TSN (terminal SN), are used to develop the curves. Using FWD data, the ISN is the SN after the pavement is rehabilitated (Financial Accounting “Modern Equivalent”). Intermediate SNIs, are SNs other than the ISN and TSN. The TSN was defined as the SN of the pavement when it was approved for pavement rehabilitation. The second method is to use TSD (traffic speed deflectometer) data. The road network already divided into road blocks, is grouped by traffic loading. For each traffic loading group, road blocks that have had a recent pavement rehabilitation, are used to calculate the ISN and those planned for pavement rehabilitation to calculate the TSN. The remaining SNs are used to complete the age-based or if available, historical traffic loading-based SNIs.
Key words: Conceptual, pavement structural number, pavement structural deterioration curve, pavement management system.
1. Background
Many road network managers in Australia use a PMS (pavement management system). The sophistication of PMS can range from local knowledge built up from years of experience to a computerised AMS (asset management system). The latter of which will have detailed construction records, treatment types and condition histories, current treatment type costs, calibrated deterioration factors and a modelling or prediction system. The AMS can produce reports on the expected future road network
Corresponding author: Gregory Kelly, RPEQ, CP.Eng. NER. maintenance planning engineer; research field: better road management. E-mail: [email protected] and [email protected].
condition based on different future funding scenarios and annual works program that makes the best use of the available budget or a targeted future condition index. Many SEQ (South East Queensland), LGA (local government authorities) have access to the SMEC (snowy mountains engineering corporation) PMS (pavement management system). The SMEC PMS provides all the capabilities listed above for a computerized AMS. The SMEC PMS utilises the HDM-III (highway design and maintenance standards model).
Road roughness is a major component of the SMEC PMS used in SEQ, Australia. Originally the NAASRA (National Association of State Road Authorities) counts were used in Australia. The IRI (international
D
roughness index) is now the measure of the road longitudinal profile, used in Australia.
TMR [1] Test Method Q708B: Road roughness—surface evenness—two laser profilometer relationship between NAASRA and IRI is presented in Eq. (1).
N= (33.67 IRI) – 1.95 (1) where, N = NAASRA roughness (counts/km);
IRI = Lane International Roughness Index (m/km). The South Australia DPTI (Department of Planning, Transport and Infrastructure) [2] specification (Part R35 Surface Characteristics) relationship between NAASRA and IRI is presented in Eq. (2).
NAASRA (counts/km) 26.9 IRIlane – 1.27 (Quarter Car) (2)
Other references include:
Standard Operating Instructions for the NAASRA Roughness Meter and Guide for the Present Serviceability Rating of Road Pavements, National Association of Australian State Road Authorities, 1981;
User Manual Two Laser Profiler, ARRB Transport Research, December 1997;
ASTM Test Method E 1926-98 (2003): Standard practice for computing IRI of roads from profile measurements;
TMR Test Method Q708-1986: Road Roughness—Surface Evenness.
A significant benefit of roughness data collection is that it has been relatively cheap to collect. To improve the usefulness of IRI in a PMS, much work has occurred to calibrate IRI deterioration. In SEQ [3], this work was carried out as part of a LTPP (long term pavement performance) study initiated by Griffith University and six LGA in SEQ. The Queensland Government’s, Department of TMR (Transport and Main Roads) is now a LTPP study partner. A limitation of road roughness is that, it is not a measure of the structural strength of a section of pavement. Another limitation is, a thin asphalt overlay will significantly improve the IRI but it will not
significantly improve the structural integrity of a pavement.
This paper proposes two methodologies that a LGA can use to the develop PSDC. The first is based on geotechnical data collected as part of annual pavement rehabilitation designs. The second is (when available) data from the Danish TSD (traffic speed deflectometer). It is expected that the TSD is a future solution to, the unrealistically high cost of collecting network pavement structural data. The PSDC would then be used to improve the prediction of pavement deterioration and financial depreciation, as a new measure of future road network budget requirements.
In Australia, the New South Wales Auditor-General [4] in accordance with Section 38E of the Public Finance and Audit Act 1983, presented the Condition of State Road: Roads and Traffic Authority of New South Wales report. This report included:
“Understanding the underlying structural condition of roads and their remaining life is a challenge for all road agencies. These factors are difficult to measure and predict. They depend on how the road was built, and its exposure to water penetration and heavy vehicle traffic over time.”
“Effective asset management, however, leading to the setting of appropriate condition standards, needs reliable forecasts of the structural condition of road pavements. This has not been available due to the absence of technology to assess the structural condition across a large road network.”
“We recommended in 1999 that the RTA consider implementing a computerised PMS. The RTA agreed and carried out an investigation in 2002, but did not find any suitable system. The RTA considered the available systems relied too heavily on surface condition measurements and did not take sufficient account of structural fatigue. Sydney region has continued to use one it had trialled but other regions have adopted their own less sophisticated systems.”
“More important in the long term, but less obvious than ride quality, is the underlying structural condition of State Roads. While more difficult to assess than surface condition, the RTA has done well to recognise the importance of measuring structural condition and progressively improve its methods to do so. In our opinion, however, the structural condition and expected life of State Roads is declining as a consequence of the RTA deferring road rebuilding works.”
Based on the above, the study of the development of pavement structural deterioration is a worthy goal of road engineers and researchers.
2. Objective
The objective of this concept paper is to provide methodologies to develop PSDC. One methodology allows for the development using existing data and the other using the TSD (when available) data. By developing PSDC, we will provide PMS developers with a measurement of pavement structural strength for inclusion as a new component in pavement prediction.
This new measure will reduce the PMS limitations of using road roughness as a proxy. And counter to the effect in the PMS of thin asphalt surfacing reducing the IRI count especially for pavement deterioration predictions.
For those road managers not using a computerized PMS, the PSDC could be used as a complementary or alternative methodology for assessing the future rehabilitation triggers and therefore future budgeting requirements.
From a financial reporting perspective, if normalized to the construction costs and pavement life, these PSDC could also be considered as an alternative financial depreciation methodology. The acceptance of these PSDC could be argued that there is a more realistic relationship between construction cost and pavement life, than the widely used “straight line” deterioration.
3. Calculating Pavement Structural Number
In order to model pavement structural deterioration, we must have a way to calculate that SN (structural number) before we can measure a pavements SN. For pavements, unfortunately there are many way to calculate the SN for pavements. As part of their IAP (industry affiliates program), Griffith University partnered with a LGA to report on “Modelling the Various Methods in Assessing Pavement Strength Using FWD Deflection” [5]. This report reviewed:
AASHTO Method A1;
AASHTO Method A2;
AASHTO Method B; Howard’s Method; Rohde’s Method; Jameson’s Method; Asgari’s Method; Salt’s Method; Robert’s Method; Rolt’s Method A; Rolt’s Method B.
And previous studies were comparing methods for calculating SNP from FWD:
Salt & Stevens Study, 2001;
Rohde & Hartman Study, 1996;
Rohde Study, 1994;
Martin Study, 2003.
This report recommended the Salt Method, as most suitable for SN determination. The recommendation was for a LGA road network, where the project was completed. It follows therefore, that care should be taken to determine which method is to be used to calculate SN in a different road networks. The LGA used the SMEC PMS which uses HDM-III. In his report Shivpuri acknowledged the Tepper’s [6] 2003 report Comparison of Project Level and Network Level Pavement Strength Assessment which links to the HDM-4 Model.
4. Concepts Options
presented in this paper. The first is based on FWD data that may be available to most road network managers as a part of geotechnical testing for developing annual works programs. The second is based on the availability of a TSD data.
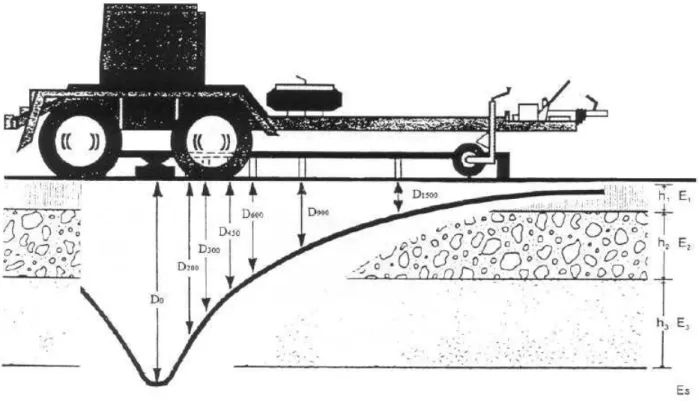
4.1 Option 1—Annual Works Program Data
Option 1 is the most easily implementable concept for developing PSDC. This option assumes that the road network manager develops annual works programs for the resurfacing and rehabilitation of the road network and that as part of developing this program the geotechnical testing includes carrying out FWD testing. An idealised pavement deflection is shown in Fig. 1 from TMR/AAPA [7]. For pavement design in Australia, D0 is the maximum deflection, D250 / D0 is the deflection ratio, D0 – D200 is the curvature function and the D900 reflects the subgrade response. Note, for subgrade response on thin pavements, recent research by Chai et al. [8] should be considered. For calculating the pavement structural the FWD test data can be used. In the case below,
only the D0, D900 and D1500 are required. (1) Calculating the pavement structural number Calculating the pavement structural number can occur using many methods. Of the available methods, Salt’s method [9] is used in Eq. (3).
(3) where d0, d900 and d1500 are the deflections in microns at the radial offsets 0, 900 and 1500 mm respectively, under a standard 40 kN FWD impact load.
Note: SNP includes the subgrade component.
(2) Developing the pavement structural deterioration curve
An outcome to aim for, is a curve of the deterioration of the strength of a pavement over time (traffic load), from construction to reconstruction (pavement rehabilitation). The initial problem that needs to be overcome is that pavement structural data are required over the life of the pavement. For flexible pavementsinAustralia,theytypicallyhaveatwenty-year
design life. This time period is way beyond the period that a LGA is likely to fund a research project.
The proposed solution to this problem is in three parts, firstly start with calculating the TSN (terminal structural number), this is the SN when the pavement has no useful remaining life. While all pavements technically have some remaining life, in this case the pavement is deemed to have no remaining pavement life, when the LGA decides to fund the rehabilitation of the pavement. This SN can be calculated from FWD data that are collected as part of the preparation of the annual works program, from those road sections that will have their pavement rehabilitated. If Salt’s method is used, the D0, D900 and D1500 data are required to calculate the pavement structural number. The road sections with TSN can be separated into similar pavement traffic design groups.
The second step is to calculate an ISN (initial structural number); that is, the SN of the pavement when it is first constructed. As it is highly unlikely that FWD data are available from 20 years ago, and as part of the potential use PSDC is as a depreciation methodology in financial reporting, the solution is to use the “Modern Equivalent”. “Modern Equivalent” is the asset that would be used to replace existing asset, in this case the new pavement design. To calculate the ISN, a FWD survey must be completed soon after road sections have been rehabilitated. This can be done as a separate survey or as part (cheaper) of developing next year’s annual works program. On completion of the survey on the newly constructed pavements, a set of ISN and TSN will be available.
The road sections with FWD data should be separated into similar pavement traffic design groups. The maximum design traffic loading will form the maximum of the horizontal axis on the PSDC. The assumption is that road sections with higher traffic loads will have stronger designs with higher SNs. As there are only initial and terminal points, no curve can be drawn until the third step of the process is completed.
The third and final stage of the process is to calculate the SN for the Intermediate points (SNI) on the PSDC. Again, the problem is that the research is unlikely to be funded until enough time has passed for significant structural deterioration from the ISN to the SNI to occur. The proposed solution is to again use the annual works program FWD data. An assumption is that of all the road sections that were FWD tested, only some would have their pavements rehabilitated. Therefore, an SNI between the ISN and the TSN can be calculated from these road sections. Using the remaining FWD data, calculate SNIs. As these are intermediate points on the PSDC, the traffic loading data will have to be calculated from existing counts or estimated to deduct where on the horizontal axis (traffic load) of the PSDC the SNI is plotted. Use the traffic loading to assign these SNIs into the similar pavement traffic design groups, used in steps one and two above for plotting the PSDC.
From the step three data, it is reasonable to expect that in the first year of the research, at least some design traffic loading will have initial, intermediate and terminal SNs. From this data, an initial set of PSDC can be plotted. As the annual work programs are developed, Steps one, two and three can be repeated and the PSDC can be further developed.
An immediate benefit of the cost of the extra testing (for the TSN) is that the data can be used to calculate the remaining life of the pavement and this can be compared to the design life (traffic loading). This can be used to confirm or improve pavement rehabilitation and/or rehabilitation design practice. A second immediate benefit of the PSDC will be an automatic development of, a traffic design loading acceptable structural strength, at which pavements are rehabilitated. A future benefit is that when a TSD survey is completed, an alternative method for calculating remaining pavement life and future budgeting needs can be developed.
Limitations:
Because the PSDC are built from annual road rehabilitation FWD data, it may take more than one year to build a statistically sufficient data set, to represent the local road network.
4.2 Option 2—Traffic Speed Deflectometer
Option 2 is to use TSD data. “In early 2000, the world first Doppler based Traffic Speed deflectometer (TSD) was developed by Greenwood Engineering” [10]. The TSD though a higher initial investment cost, overcomes the major ongoing cost and safety issues with standard FWD data collection, which are due to the need for traffic control. The TSD provides a cheaper and safer method for collecting pavement structural data. While cost and safety are major benefits, the technology is yet to be fully proven and has not yet become the norm Australia.
As TSD is an emerging technology in Australia, it is not being used by LGA in SEQ. The TSD is being developed in Australia, including a partnership including TMR. TMR took part in a trial of collecting TSD data in 2010 [10], resulting in extensive current road structural data being available for the first time. A limitation is that an approved calibration process will be required to relate the TSD data to FWD data. A second limitation is that TSD data are not available for LGA roads.
The TSD does not measure pavement deflection is the same way as an FWD. During operations, Doppler sensors measure vertical deflection velocities of the
pavement surface at the discrete points and when divided by the instantaneous vehicle speed, they produce deflection slopes at those points [11]. Fig. 2 shows the pavement deflection velocity vectors under a rolling wheel. Together with the deflection velocity the corresponding deflection basin is shown in Fig. 3 where deflection slopes (tangents) are displayed.
In order to determine the actual pavement deflections, deflection slope curve must be integrated using a closed-form solution of a mechanical model such as an elastic beam as expressed in the 2-parameter Euler-Bernoulli beam as shown in Eq. (4) [11]:
where, F is the point force, E the elasticity, I the moment of inertia, h the pavement thickness and k is the spring constant.
The corresponding differential is seen in Eq. (4) [11].
(4) Because the TSD does not measure pavement deflection is the same way as an FWD and the relationship between deflections calculated using TSD and the FWD has to be correlated. In Queensland, a relationship has been developed by Manoharan [10] using the following methodology.
A total of six trial sites with granular unbound pavements were selected in Queensland. FWD tests were conducted alongside the TSD device in order to study the correlation between them. The trial sections
Fig. 3 Pavement deflection velocity and deflection basin with deflection slopes (tangents) [11].
Fig. 4 Illustration of the road behaving like an elastic beam on a foundation of linear springs. Table 1 FWD testing sites with location details [10].
Sites Highway Chainage (km) Traffic volume Type of pavement Zone Testing interval (m)
10L Bruce 68.00 to 69.00 5,800 Granular WNR 10.50
10N Bruce 122.00 to 122.50 4,300 Granular WNR 5
14B Flinders 200.00 to 200.50 500 Granular DNR 10 13E Landsborough 49.00 to 50.00 560 Granular DR 10
18D Warrego 93.20 to 94.00 1,250 Granular DNR 10
28A Gore 58.50 to 59.50 2,250 Granular DR 10
varied from 500 m to 1,000 m in length and the FWD tests were measured at 5, 10 and 50 m intervals at different test locations. After processing, the TSD and FWD data were filtered to approximately 400 test locations for analysis.
Table 1 displays trial sites, which were selected to appropriately capture various traffic volumes and different road classifications. TMR controlled roads have been classified according to subgrade material
type and typically experienced rainfall levels. These classifications include WNR (wet non-reactive) WR (wet reactive) DNR (dry non-reactive) and DR (dry reactive). This analysis only considered flexible granular pavement with thin asphalt or spray seal surfacing are the majority of the network. To investigate the relationship between the max deflection of TSD and FWD, the deflections were plotted illustrating a linear relationship between the
D0 deflection measurement from FWD and that obtained by TSD device. This outcome demonstrated a highly beneficial method of converting TSD data to the FWD equivalent and using existing FWD base technology for practical applications.
Manoharan’s [10] statistical analysis identifies that TSD-D0 and FWD-D0 have a linear relationship as presented in Eq. (5).
129
.
40
*
9845
.
0
0( ) ) ( 0TSD
D
FWD
D
(5)The correlation is deemed to be strong with an R² value of 0.8826.
Because Option 1 is limited to the annual works program, it will have a limited number of road sections with FWD data. For Option 2, the size of the data set will be in the thousands of road sections with multiple deflections points, a process is required to calculate the structural number for each road section. Assigning the points to their respective road sections can be done by road chainage or geo-referencing. A computerized system for calculating and calibrating their average structural number is a separate issue.
In preparation for the TSD data becoming available for local roads, the road network should be divided into homogeneous sections. (The vast TSD dataset also provides an opportunity to refine existing homogeneous sections by using the variation in deflection.) This is a normal requirement for a PMS and has already been completed by LGA in SEQ. The road sections should be separated into groups on similar pavement traffic design groups. A current limitation is that much of the traffic data in the PMS are estimated data. These data are typically only upgraded with traffic counts for pavement rehabilitation designs and traffics studies for safety issues and capital works.
Road sections should be separated into groups of similar pavement traffic designs, each road section should be further tagged as “recently rehabilitated”, “no planned rehabilitation” or “rehabilitation planned”. Because all road sections will:
have a structural number;
be in similar pavement traffic design groups;
be tagged as “recently rehabilitated”, “no planned rehabilitation” or “rehabilitation planned”, the process of developing PSDC is simplified and comprehensive.
For each pavement traffic design group, the ISN set will be the structural numbers of the “recently rehabilitated” road sections. The TSN set will be the structural numbers of the “rehabilitation planned” road sections. The data from the remaining road blocks will form the SNI set.
The SNIs require further work, in that their age or traffic loading to date must be calculated. For simplicity, the curves can be developed using the ISNs as year Zero, SNIs as their pavement age (usually available) and the TSNs as the design life used in the planned pavement design.
Limitations:
The availability of TSD data;
Poor historical traffic data.
5. Conclusion
This paper proposes two methods for calculating PSDC.
Method 1, uses typically available FWD data collected in the normal course of developing an annual works program. This option only requires extra FWD data to be collected on road sections that have be recently had their pavement rehabilitated. This option will improve annually as more FWD data are collected. The usefulness of this option includes a new method to assess the structural condition of your road network, an alternative or complementary financial reporting methodology, an opportunity to improve PMSs by including pavement structural deterioration and an opportunity to review pavement design practice. Option 1 could be easy initiated in any LGA by pavement engineers that have FWD data.
Method 2, assumes that a TSD survey is carried out on the whole road network. A calibration method is required to relate TSD to FWD data. Work on this
calibration commenced in 2016 for State roads [10]. This option is less suited to local government in Australia, as no LGA has engaged a TSD.
The benefits of option 1 above could be more easily realized by LGA if the engaged with the State Road Authority, where cost sharing, expertise and local calibration would be available.
Both methods require a decision to be made as to which of the available methods is best suited to calculating the structural number, for the road network. Work on this, was been completed in 2009 [5].
Acknowledgements
The authors wish to acknowledge Logan City Council, City of Gold Coast Council, Redlands City Council, Queensland Department of Transport and Main Roads and the Southern Regional Roads Group, for their contribution to research funding through Griffith University Queensland.
References
[1] Department of Transport and Main Roads. 2014. Materials Testing Manual. Part 11: Pavements. Test Method Q708B: Road Roughness—Surface Evenness—Two Laser Profilometer.
[2] South Australia Department of Planning, Transport and Infrastructure. 2015. Spectification: Part R35 Surface Charactoristics—Roughness, Section 2.2 Measurement. [3] Kelly, G., and Shah, A. 2013. “Showcasing Research
Alliance Managing Road Lifecycle.” Logan City Council.
http://www.alliancingforums.com/uploads/Greg_Kelly__ _Ashish_Shah.pdf.
[4] Auditor General NSW. 2006. “Condition of State Roads.” The Audit Office of NSW. http://www.audit.nsw.gov.au/ArticleDocuments/138/157 _Condition_Of_State_Roads.pdf.aspx?Embed=Y. [5] Shivpuri, S. 2009. “Modelling the Various Methods in
Assessing Pavement Strength Using FWD Deflection.” Griffith University, Industrial Affiliates Program 2006. [6] Tepper, S. 2003. “Comparison of Project Level and
Network Level Pavement Strength Assessment.” Asutroads, Sydney, Australia. https://www.online publications.austroads.com.au/items/AP-T21-03.
[7] Australian Asphalt Pavement Association. Year. “Deflection Response.” Transport and Main Roads. http://www.aapaqtmr.org/documents/PRM/Overlay_Desi gn_cpee_ver_final.pdf.
[8] Chai, G., Kelly, G., Huang, A., Chowdhury, S., Golding, A., and Manoharan, S. 2016. “New Approaches for Modelling Subgrade Nonlinearity in Thin Surfaced Flexible Pavements.” International Journal of Pavement Engineering 19 (2): 122-30.
[9] Salt, Stevens, Tonkin & Taylor Ltd. 2001. “Determination and Calibration of Structural Capacity (SNP), Equation 13.” ARRB. http://www.pavementanalysis.com/images/papers/arrb20
01.pdf.
[10] Manoharan, S., Chai, G., Chowdhury, S., and Golding, A. 2016. “A study of the Structural Performance of Flexible Pavement Using Traffic Speed Deflectometer.” Paper presented on the 4th Geochina International Conference, Shandong, China.
[11] Weligamage, J., Piyatrapoomi, N., and Gunapala, L. 2010. Traffic Speed Deflectometer-Queensland Trial. Brisbane Australia: Transport and Main Roads.
![Fig. 2 Pavement deflection velocity under a rolling load [11].](https://thumb-us.123doks.com/thumbv2/123dok_us/113056.2512968/6.892.191.657.869.1097/fig-pavement-deflection-velocity-rolling-load.webp)
![Fig. 3 Pavement deflection velocity and deflection basin with deflection slopes (tangents) [11]](https://thumb-us.123doks.com/thumbv2/123dok_us/113056.2512968/7.892.189.699.134.474/pavement-deflection-velocity-deflection-basin-deflection-slopes-tangents.webp)
