Procedia Computer Science 57 ( 2015 ) 868 – 875
1877-0509 © 2015 Published by Elsevier B.V. This is an open access article under the CC BY-NC-ND license (http://creativecommons.org/licenses/by-nc-nd/4.0/).
Peer-review under responsibility of organizing committee of the 3rd International Conference on Recent Trends in Computing 2015 (ICRTC-2015) doi: 10.1016/j.procs.2015.07.498
ScienceDirect
3rd International Conference on Recent Trends in Computing 2015 (ICRTC-2015)
Medical data classifications using genetic algorithm based
Generalized Kernel Linear Discriminant Analysis
P.Hari Babu
a, E.S.Gopi
aaNational Institute of Technology, Trichy-620015, India Abstract
The generalized Kernel Linear Discriminant Analysis (KLDA) is the dimensionality reduction technique with class discrimination to map the vectors from the feature dimensional space to the lower dimensional space. In this paper, we propose to tune the unknown parameters of the generalized KLDA using genetic algorithm to map the vectors from the feature dimensional space to the lower dimensional space. Nearest mean classifier is used for classification. Experiments are performed on medical data using the genetic algorithm based GLDA and reported in this paper. As an average 5% increase in the detection rate is achieved using the genetic algorithm based GLDA when compared with the other kernel function based LDA.
© 2014 The Authors. Published by Elsevier B.V.
Selection and/or peer-review under responsibility of organizing committee of the 3rd International Conference on Recent trends in Computing 2015 (ICRTC-2015)
Keywords: Kernel Linear Dicriminant analysis(KLDA); Genetic Algorithm; Generalized kernel;
1.Introduction
Medical databases contains large collection of medical data, which includes all the parameters that defines its type. Medical data classification contains great importance in the field of medicine because of enormous development of automation methodologies. By applying data classification algorithms on medical data, it is possible to aid diagnosis of diseases and especially in its early stages. When it gets successfully detected in early stages itself, the chances of recovery is high.
Early work on classification was done by Fisher[6][7]for a two class problem tends to develop Fisher’s linear discriminant function which becomes a rule for assigning class to the new instance. Later so much development happened in this field, large no of algorithms like Perceptron algorithm, Support vector machine, Linear discriminant analysis,..etc are developed on the basis of linear predictor function in which the class of new instance is predicted by means of scores obtained. In the year 1999, Sebastian Mika[5] demonstrated kernel based LDA is competitive to other state of art classification techniques and there is much room for extensions. In this paper, we had taken Real Time Medical Databases and classification is done using Genetic algorithm based Kernel Linear Discriminant Analysis (KLDA). Here the kernels[10] used are K1, K2, K3, K5, K6 and © 2015 Published by Elsevier B.V. This is an open access article under the CC BY-NC-ND license
(http://creativecommons.org/licenses/by-nc-nd/4.0/).
Peer-review under responsibility of organizing committee of the 3rd International Conference on Recent Trends in Computing 2015 (ICRTC-2015)
Generalized kernel[2]. In case of N-Class problem, whatever may be the size of individual vector in the feature dimensional space because of the KLDA technique these vectors are mapped to lower dimensional space with size N-1. By means of Nearest mean classifier, an individual vector is predicted that it belongs to which class. In this medical data classification, some part of data is taken as Training data which is used for fixing the coefficients of kernel used in KLDA method. Remaining part of data is used for testing the performance and hence the success factor (percentage of success) is calculated. Here, Genetic algorithm is used for the optimization of the kernel coefficients.
2.Medical Databases taken
2.1.Weaning database
Weaning data set consists of retrospective records of patients suffering from acute respiratory insufficiency on a long-term (at least 7 days) mechanical ventilation. Each case is described by 17 clinical and paraclinical features. Based on these, two classes of patients are distinguished: (1) not ready for weaning and (2) ready for weaning from mechanical ventilation. Total no of instances are 302. No of attributes are 17, They are 1. T-body temperature, 2. Hb-Hemoglobin, 3. Ht-Hematocrit, 4. Lv-Leucocytes, 5. Rue-Rue factor, 6. Ob-Albumen, 7. Alb- Blood albumin, 8. Krz-Blood sugar, 9. Lakt-Lactate, 10. FiO2-Oxygen concentration (inhaled), 11. PaO2-Partial pressure of oxygen in arterial blood, 12. PaCO2-PaO2-Partial pressure of CO2 in arterial blood, 13. PaO2/FiO2-Ratio of features 11/10, 14. Rs-Heart rate, 15. RRs-Systolic arterial pressure, 16. RRd-Diastolic arterial pressure, 17. RRm-Mean arterial pressure, 18. Class-(1- Not ready for weaning; 2- Ready for weaning)
2.2.Laryngeal3 database
Laryngeal3 data set consists of Voice signal records of patients distributed in different classes. This data will be used to aid diagnosis of Laryngeal pathology and especially in detecting its early stages.Total no of instances are 173. No of attributes are 16, they are 1.Class label-(0-normal, 2-Organic pathological, 3-Functional pathological voices), 2. Duration of the voice signal, 3. DUV-Degree of unvoiceness: ratio of unvoiced part of the signal to the whole signal, 4. Fo-Fundamental frequency, 5. Standard deviation of fundamental frequency, 6. PPQ-Pitch period perturbation quotient (Jitter), 7. APQ-Amplitude perturbation quotient (Shimmer), 8. HNRf-Harmonic energy to noise energy ratio in frequency domain [dB], 9. HNRq- Harmonic energy to noise energy ratio, Qi method [dB], 10. NNE-Normalized noise energy [dB], 11. DH- Degree of hoarseness: ratio of noise energy to all energy, 12. TNI-Turbulence noise index, 13. NFHE- Normalized first harmonic energy: first harmonic energy to all harmonic energy ratio, 14. HLER-High to low energy ratio: ratio of harmonics in range 0-500 Hz to 500-3500Hz, 15. NVB-Number of voiceness breaks, 16. FrTI-Frequency tremors intensity.
2.3. Contractions database
Wireless capsule video endoscopy is a recent technology in which a pill with an attached camera is swallowed by the patient. The camera travels along the intestinal tract and emits a radio signal recorded as a video. The problem is to detection of contraction frames in the video automatically. Each contraction is defined as a sequence of 9 image frames. 27 attributes were derived from these frames, 3 features for each frame: mean ntensity, the hole size (lumen opening) and global contrast. The 9 values from the consecutive frames have been standardized by taking out the mean and dividing by the standard deviation of the respective feature. Total no of instances are 98. No of attributes are 27, they are 1 – 9. Mean intensity of frames 1 to 9, 10 – 18. Hole
size of frames 1 to 9, 19 – 27. Global contrast of frames 1 to 9, 28. Class label (1 - contractions; 2 - non contractions)
2.4.RDS database
The Respiratory data set consists of the clinical records (17 features) for 85 premature newborn children with two types of respiratory distress syndrome (RDS): Hyaline Membrane Disease (HMD) and non-HMD. The two classes need urgent and completely different treatment, therefore an accurate RDS classification is crucial within the first few hours after delivery. Total no of instances are 85. No of attributes are 17, they are 1. Pathology during pregnancy, 2. Antenatal administration of corticosteroids, 3. Preterm rupture of the foetal membranes, 4. Chorionamnionitis, 5. Tocolysis (suppression of the premature delivery by i.v. infusion of betamimetics), 6. Gestation age (weeks), 7. Birth weight (grams), 8. Morphological maturity (weeks), 9. APGAR score at 5 minutes after delivery (scale from 0 to 10), 10. PH from umbilical artery (before resuscitation of the newborn infant), 11. PH after resuscitation (at least after 1 hour), 12. BE (Basis excess) after resuscitation, 13. Heart rate at the 1 hour (bpm) [measured one hour after resuscitation in the delivery room], 14. Respiratory insufficiency 6 hours after delivery (Silvermann- index, scale from 0 to 10), 15. Cyanosis 6 hours after delivery, 16. Crepitation rales by lung auscultation 6 hours after delivery, 17. Heart rate 6 hours after delivery (bpm), 18. Class 1 - non-HMD, Class 2 - HMD
2.5.Voice database
Signals of patients voices were processed to derive parameters in the time, spectral and cepstral domains. This data will be used to aid diagnosis of laryngeal pathology and especially in detecting its early stages. It is a three class problem. Total no of instances are 238. No of attributes are 10, they are 1. Gender (1- Male, 2 - Female), 2. Age, 3. APQ - Amplitude perturbation quotient (Shimmer), 4. PPQ -Pitch period perturbation quotient (Jitter), 5. Diss- The degree of dissimilarity of the shape of the pitch pulses, 6. Turbo- measure for the turbulence of the signal, 7. Stab - Stability of to (pitch period) generation, 8. HNR - harmonics to noise ratio, 9. Pecm - Ratio of the energy concentrated in the cepstral pitch impulse to the total cepstral energy, 10. DH - Degree of hoarseness: ratio of noise energy to all energy, 11. Class label - (1 - normal, 2 -functional pathology, 3-organic pathology).
3.Kernels for LDA and Cost function
For this experiment, we had taken six kernels. Let Y1 and Y2 are two input vectors given to the kernel then,
x Gaussian kernel (K1) is
(1)
(2)
x Polynomial kernel (K2) is
(3)
x Power exponential kernel (K3) is )
(4)
(5)
x Inverse multi-quadric kernel (K6) is
(6) x Generalized kernel is (7) (8) (9) (10) (11) The cost function choosen for this purpose is J as shown below.
(12)
x Homoscedasticity (Q1):
Class {i} =collection of vectors belongs to class i from the Gram matrix are arranged along columns.
(13) (14) x Excess Kurtosis (Q2): (15) (16) (17)
(18)
(19)
(20)
(21)
We need to tune the coefficients of the kernel to maximize the value of cost function. This cost function minimizes the inter-cluster Euclidean distance and maximizes the intra-cluster Euclidean distance by making individual classes to be Gaussian distributed with identical covariance matrices. 4.Genetic algorithm based KLDA The method used for data classification is Genetic algorithm based KLDA. The entire work is divided in to two parts. They are fixing a kernel by the use of training data and classification to be done on the testing data. 4.1.Fixing coefficients of kernel using training data: 1. Construct an initial matrix M with columns as training vectors. 2. Initialize the tuning parameters vector C with some arbitrary values. 3. Compute Gram matrix GM from M using C vector. (22)
the resultant matrix GM is a square matrix with no of rows/columns as no of training vectors. 4. From this Gram matrix GM, calculate the values of Q1, Q2, Q3 and then compute the cost function J. 5. Find next C vector using Genetic algorithm and go to step3. This process has to be repeated for required no of iterations. 6. When required no of iterations gets completed, identify the C vector for which the value of cost function J is maximum. 7. The Best vector identified from above step is taken as final C vector, thus the coefficients of the kernel gets fixed and then the kernel is ready for classification of data. 4.2.Data classification using kernel: The remaining part of database after taking training data is taken as testing data. Data classification is applied on these testing data and performance analyses of the kernels are studied. The Steps followed are 1. After fixing kernel coefficients, the resultant Gram matrix is (23)
2. From the Gram matrix GM, the means of all classes are calculated (M1, M2 ... Mr) (24)
(25) 3. Between class scatter matrix
(26)
4. Within class scatter matrix (27)
5. Then the final matrix F is obtained by (28)
6. Find the significant eigen values for the matrix F and the corresponding eigen vectors are taken as columns of matrix E. 7. All the vectors present in the kernel space are mapped to lower dimension then the new matrix U is obtained. pp (29)
(30)
(31)
(32)
8. All the vectors in the data base are arranged along the columns, the obtained matrix is named as initial. 9. Then the matrix new is obtained by using kernel with inputs as vectors from M and initial matrices. y g p (33)
i varies from 1 to no of columns of M j varies from 1 to no of columns of initial 10. The final reduced vectors are obtained by (34)
(35) i varies from 1 to no of columns of initial.
11. Then for each and every vector of the matrix P, the distances from the centroids of the classes are calculated and then by observing the values of distances, the nearest centroid is identified. Thus how, the vector is predicted that it belongs to which class.
12. With the above step, Data classification is completed. To check the validity of the classification, we need to cross check whether all the training data are predicted correctly or not. If any of the training data is predicted wrong, then the classification is not proper.
13. If the classification is proper, then find the no of correctly predicted vectors from testing set. The ratio of correctly predicted vectors to the total vectors gives percentage of success in detection.
5.Results and Conclusion
During the calculation of percentage of success for each and every kernel, for the validity of the result, k-fold classification is done i.e. for each and every database, the same experiment is done by taking different training sets from same data set. Here for all the observations, 20% of total data is taken as training set and the remaining is taken as testing set. So, we have five possible training data sets. Percentage of success calculation does not include prediction of training vectors. During experiment, training vectors are intentionally predicted to know whether the result is valid or not. The results obtained for five databases taken are shown below.
Table 1. Result obtained for Weaning data
Type Generalized K1 K2 K3 K5 K6
count % Count % Count % Count % Count % Count % Case1 176 72.73 124 51.24 156 64.46 123 50.83 117 48.35 145 59.92 Case2 177 73.14 179 73.97 145 59.92 127 52.48 122 50.41 154 63.64 Case3 171 70.66 158 65.29 120 49.59 150 61.98 180 74.38 126 52.07 Case4 194 80.17 162 66.94 192 79.34 181 74.79 171 70.66 177 73.14 Case5 169 69.83 124 51.24 181 74.79 173 71.49 183 75.62 109 45.04 Average 177.4 73.30 149.4 61.73 158.8 65.62 150.8 62.31 154.6 63.88 142.2 58.76 Table 2. Result obtained for Laryngeal3 data
Type Generalized K1 K2 K3 K5 K6
count % Count % Count % Count % Count % Count % Case1 94 67.14 53 37.85 76 54.28 85 60.71 63 45 73 52.14 Case2 91 65 82 58.57 76 54.28 92 65.71 92 65.71 64 45.71 Case3 80 57.14 70 50 67 47.85 79 56.42 85 60.71 84 60 Case4 75 53.57 62 44.28 84 60 56 40 79 56.42 74 52.85 Case5 80 57.14 43 30.71 56 40 52 37.14 54 38.57 86 61.42 Average 84 60 62 44.28 71.8 51.28 72.8 52 74.6 53.28 76.2 54.42
Table 3. Result obtained for Contractions data
Type Generalized K1 K2 K3 K5 K6
count % Count % Count % Count % Count % Count % Case1 61 78.2 59 75.64 55 70.51 51 65.38 39 50 43 55.12 Case2 60 76.92 50 64.10 50 64.10 47 60.25 29 37.17 42 53.84 Case3 57 73.07 52 66.67 54 69.23 56 71.79 64 82.05 42 53.84 Case4 57 73.07 40 51.28 43 55.12 43 55.12 63 80.76 65 83.33 Case5 53 67.94 50 64.10 65 83.33 66 84.61 64 82.05 43 55.12 Average 57.6 73.84 50.2 64.36 53.4 68.45 52.6 67.43 51.8 66.4 47 60.25
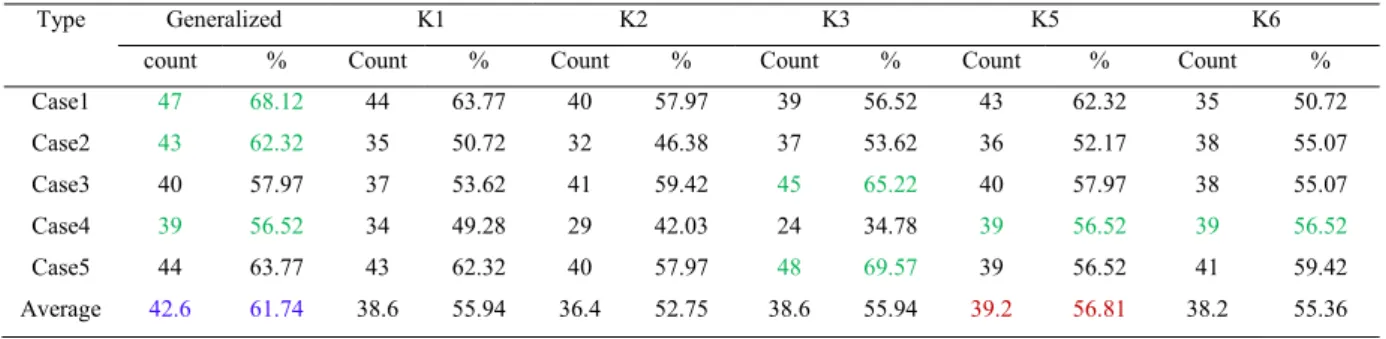
Table 4. Result obtained for RDS data
Type Generalized K1 K2 K3 K5 K6
count % Count % Count % Count % Count % Count % Case1 47 68.12 44 63.77 40 57.97 39 56.52 43 62.32 35 50.72 Case2 43 62.32 35 50.72 32 46.38 37 53.62 36 52.17 38 55.07 Case3 40 57.97 37 53.62 41 59.42 45 65.22 40 57.97 38 55.07 Case4 39 56.52 34 49.28 29 42.03 24 34.78 39 56.52 39 56.52 Case5 44 63.77 43 62.32 40 57.97 48 69.57 39 56.52 41 59.42 Average 42.6 61.74 38.6 55.94 36.4 52.75 38.6 55.94 39.2 56.81 38.2 55.36
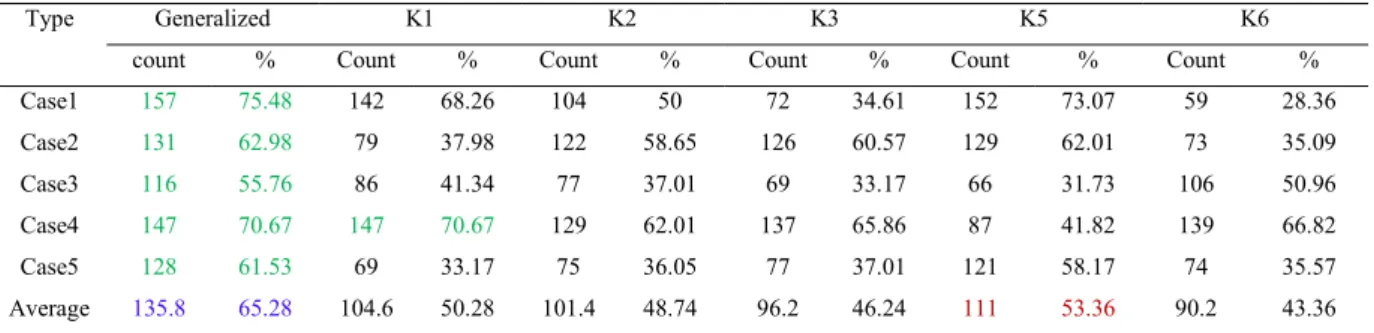
Table 5. Result obtained for Voice data
Type Generalized K1 K2 K3 K5 K6
count % Count % Count % Count % Count % Count % Case1 157 75.48 142 68.26 104 50 72 34.61 152 73.07 59 28.36 Case2 131 62.98 79 37.98 122 58.65 126 60.57 129 62.01 73 35.09 Case3 116 55.76 86 41.34 77 37.01 69 33.17 66 31.73 106 50.96 Case4 147 70.67 147 70.67 129 62.01 137 65.86 87 41.82 139 66.82 Case5 128 61.53 69 33.17 75 36.05 77 37.01 121 58.17 74 35.57 Average 135.8 65.28 104.6 50.28 101.4 48.74 96.2 46.24 111 53.36 90.2 43.36
In case of Weaning data, Total of 302 instances are present among which 60 instances are taken as training set and 242 are as testing set. So, maximum count possible is 242. In case of Laryngeal3 data, total of 173 instances are there among which 33 are taken as training set and remaining 140 are taken as testing set. For Contractions data, among total of 98 instances 20 are taken as training set and remaining 78 as testing set. For RDS data, among total of 85 instances 16 are taken as training set and 69 are taken as testing set. For Voice data, among total of 238 instances 30 are taken as training set and 208 are taken as testing set.
From above tables 1 to 5, we can observe that for Weaning data, generalized kernel performance is 7.68% better than the kernel K2 in average sense though in some cases other kernels are performing better than the generalized kernel. For Laryngeal3, data generalized kernel performance is 5.6% better than the kernel K6 in average sense. For Contractions data, generalized kernel performance is 5.4% better than the kernel K2 in average sense. For RDS data, generalized kernel performance is 4.93% better than the kernel K5 in average sense. For Voice data, generalized kernel performance is 11.9% better than the kernel K5 in average sense. Hence, the Experiments are performed on medical data using genetic algorithm based KLDA by using different kernels as discussed before. The results obtained are reported in this. If we observe the results obtained for different cases and data, different kernels are performing better in different situations. But as an average, there is a minimum of 5% increase in detection rate is achieved using the genetic algorithm based GLDA when compared with the other kernel function based LDA. So we can conclude that independent to data, the genetic algorithm based GLDA will have better performance than the remaining kernel function based LDA.
References
[1] Gopi,E.S. and Palanisamy,P., 2014. Maximizing Gaussianity using kurtosis measurement in the kernel space for kernel linear discriminant analysis. Elsevier journal on Neurocomputing 144, p. 329-337.
[2]. Gopi,E.S. and Palanisamy,P., 2012. Formulating Particle Swarm Optimization based Generalized Kernel function for Kernel-Linear discriminant analysis. SecondInternational conference on Communication, Computing and Security (ICCCS - 2012) 6, p. 517-525. [3]. Gopi,E.S., 2007. Algorithm collections for digital signal processing using Matlab. Springer publications. ISBN: 978-1-4020-6409-8.
[4]. Ludmila Kuncheva’s home page. Real time medical databases. http://pages.bangor.ac.uk/~mas00a/.
[5]. Mika,S., Ratsch,G., Weston,J., Scholkopf,B., Mullers,K.R.,1999. Fisher discriminant analysis with kernels. Neural networks for signal processing IX,Proceedings of the 1999 IEEE Signal processing society workshop, p. 41-48.
[6]. Fisher,R.A., 1938. The Statistical utilization of multiple measurements. Annals of Eugenics 8, p.376-386. [7]. Fisher,R.A., 1936. The use of multiple measurements in taxonomic problems. Annals of Eugenics 7, p.179-188.
[8]. Duchene,J. and Leclercq,S., 1988. An optimal transformation for discriminant and principal component analysis. IEEE Trans. Pattern Analysis 10, p. 978–983.
[9]. Park,C.H. and Park,H., 2008. A Comparison of generalized linear discriminant analysis algorithms. Elsevier journal on pattern Recognition 41, p. 1083- 1097.