Memory Usage
Contents
Introduction
5Organization of This Document 5
About the Virtual Memory System
6About Virtual Memory 6
Details of the Virtual Memory System 7 Wired Memory 9
Page Lists in the Kernel 10 Paging Out Process 10 Paging In Process 11
Tips for Allocating Memory
12Tips for Improving Memory-Related Performance 12 Defer Your Memory Allocations 12
Initialize Memory Blocks Efficiently 13 Reuse Temporary Memory Buffers 13 Free Unused Memory 14
Memory Allocation Techniques 14 Allocating Objects 15
Allocating Small Memory Blocks Using Malloc 15 Allocating Large Memory Blocks using Malloc 16 Allocating Memory in Batches 17
Allocating Shared Memory 18 Using Malloc Memory Zones 18 Copying Memory Using Malloc 19
Copying Memory Directly 19
Delaying Memory Copy Operations 20 Copying Small Amounts of Data 20 Copying Data to Video RAM 20
Responding to Low-Memory Warnings in iOS 20
Caching and Purgeable Memory
22Overview of Caching 22 Why Use Caching? 22
Problems Caching Can Cause 22 Solutions 22
Using Purgeable Memory 23
Advantages of Using Purgeable Memory 23 How to Implement Purgeable Memory 24 Purgeable Memory and NSCache 25
Some Warnings About Purgeable Memory 25 When to Use Purgeable Memory 25
Tracking Memory Usage
26Tracking Allocations With Instruments 26
Analyzing Memory Allocations with the ObjectAlloc Instrument 27 Analyzing Shared Memory Usage 27
Analyzing Data from the Memory Monitor Instrument 27 Tracking Memory Allocations With malloc_history 27
Examining Memory With the heap Tool 28
Finding Memory Leaks
29Finding Leaks Using Instruments 29 Using the leaks Tool 30
Tips for Improving Leak Detection 30
Enabling the Malloc Debugging Features
32Enabling Guard Malloc 32
Configuring the Malloc Environment Variables 32 Detecting Double Freed Memory 34
Detecting Heap Corruption 34
Detecting Memory Smashing Bugs 35
Viewing Virtual Memory Usage
36Viewing Virtual Memory Statistics 36 Viewing Mach-O Code Pages 37 Viewing Virtual Memory Regions 38
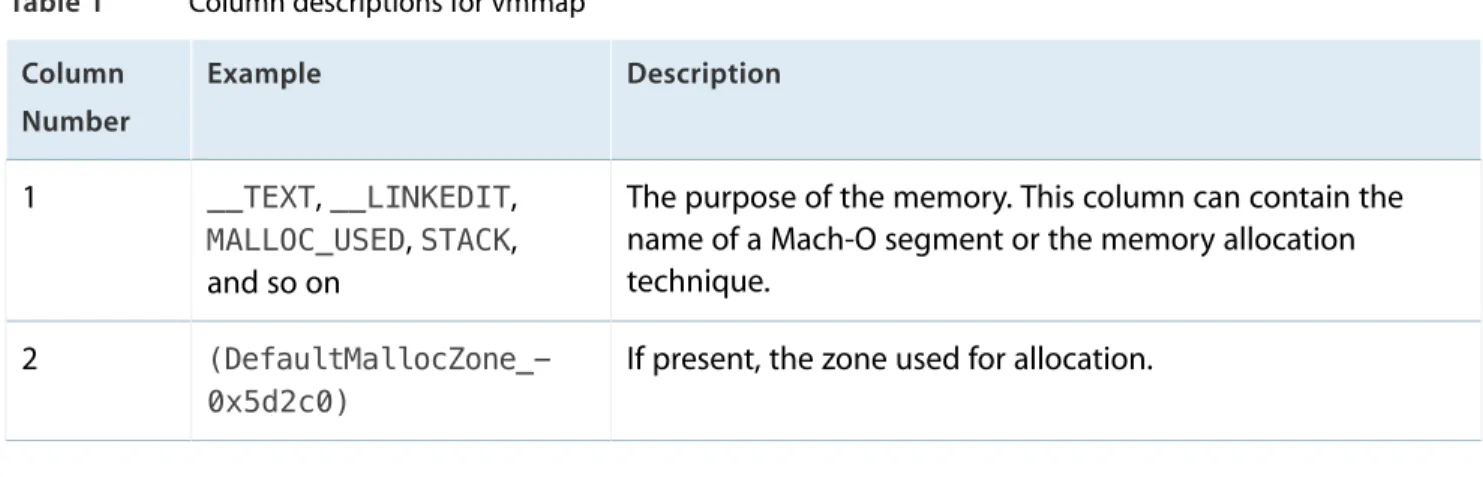
Sample Output From vmmap 38 Interpreting vmmap’s Output 40
Tables and Listings
About the Virtual Memory System
6Table 1 Fields of the VM object 8
Table 2 Wired memory generated by user-level software 9
Tips for Allocating Memory
12Listing 1 Lazy allocation of memory through an accessor 13 Listing 2 Allocating memory with vm_allocate 17
Enabling the Malloc Debugging Features
32Table 1 Malloc environment variables 33
Viewing Virtual Memory Usage
36Table 1 Column descriptions for vmmap 40 Listing 1 Output of vm_stat tool 36
Listing 2 Partial output of pagestuff tool 37 Listing 3 Typical output of vmmap 38
Memory is an important system resource that all programs use. Programs must be loaded into memory before they can run and, while running, they allocate additional memory (both explicitly and implicitly) to store and manipulate program-level data. Making room in memory for a program’s code and data requires time and resources and therefore affect the overall performance of the system. Although you cannot avoid using memory altogether, there are ways to minimize the impact your memory usage has on the rest of the system.
This document provides background information about the memory systems of OS X and iOS and how you use them efficiently. You can use this information to tune your program’s memory usage by ensuring you are allocating the right amount of memory at the right time. This document also provides tips on how to detect memory-related performance issues in your program.
Organization of This Document
This programming topic includes the following articles:
● About the Virtual Memory System (page 6) introduces the terminology and provides a high-level overview of the virtual memory systems of OS X and iOS.
● Tips for Allocating Memory (page 12) describes the best techniques for allocating, initializing, and copying memory. It also describes the proper ways to respond to low-memory notifications in iOS.
● Caching and Purgeable Memory (page 22) discusses the benefits of caching, and how to avoid some of the problems that can arise from implementing caches. It also details the advantages of implementing purgeable memory into a caching system and how to successfully implement this beneficial technology. ● Tracking Memory Usage (page 26) describes the tools and techniques for analyzing your application’s
memory usage.
● Finding Memory Leaks (page 29) describes the tools and techniques for finding memory leaks in your application.
● Enabling the Malloc Debugging Features (page 32) describes the environment variables used to enable malloc history logging. You must set some of these variables before using some of the memory analysis tools.
● Viewing Virtual Memory Usage (page 36) describes the tools and techniques for analyzing your application’s
Introduction
Efficient memory management is an important aspect of writing high performance code in both OS X and iOS. Minimizing memory usage not only decreases your application’s memory footprint, it can also reduce the amount of CPU time it consumes. In order to properly tune your code though, you need to understand something about how the underlying system manages memory.
Both OS X and iOS include a fully-integrated virtual memory system that you cannot turn off; it is always on. Both systems also provide up to 4 gigabytes of addressable space per 32-bit process. In addition, OS X provides approximately 18 exabytes of addressable space for 64-bit processes. Even for computers that have 4 or more gigabytes of RAM available, the system rarely dedicates this much RAM to a single process.
To give processes access to their entire 4 gigabyte or 18 exabyte address space, OS X uses the hard disk to hold data that is not currently in use. As memory gets full, sections of memory that are not being used are written to disk to make room for data that is needed now. The portion of the disk that stores the unused data is known as the backing store because it provides the backup storage for main memory.
Although OS X supports a backing store, iOS does not. In iPhone applications, read-only data that is already on the disk (such as code pages) is simply removed from memory and reloaded from disk as needed. Writable data is never removed from memory by the operating system. Instead, if the amount of free memory drops below a certain threshold, the system asks the running applications to free up memory voluntarily to make room for new data. Applications that fail to free up enough memory are terminated.
Note: Unlike most UNIX-based operating systems, OS X does not use a preallocated disk partition for the backing store. Instead, it uses all of the available space on the machine’s boot partition.
The following sections introduce terminology and provide a brief overview of the virtual memory system used in both OS X and iOS. For more detailed information on how the virtual memory system works, seeKernel Programming Guide.
About Virtual Memory
Virtual memory allows an operating system to escape the limitations of physical RAM. The virtual memory manager creates a logical address space (or “virtual” address space) for each process and divides it up into uniformly-sized chunks of memory calledpages. The processor and its memory management unit (MMU)
About the Virtual Memory System
maintain apage tableto map pages in the program’s logical address space to hardware addresses in the computer’s RAM. When a program’s code accesses an address in memory, the MMU uses the page table to translate the specified logical address into the actual hardware memory address. This translation occurs automatically and is transparent to the running application.
As far as a program is concerned, addresses in its logical address space are always available. However, if an application accesses an address on a memory page that is not currently in physical RAM, apage faultoccurs. When that happens, the virtual memory system invokes a special page-fault handler to respond to the fault immediately. The page-fault handler stops the currently executing code, locates a free page of physical memory, loads the page containing the needed data from disk, updates the page table, and then returns control to the program’s code, which can then access the memory address normally. This process is known aspaging. If there are no free pages available in physical memory, the handler must first release an existing page to make room for the new page. How the system release pages depends on the platform. In OS X, the virtual memory system often writes pages to the backing store. Thebacking storeis a disk-based repository containing a copy of the memory pages used by a given process. Moving data from physical memory to the backing store is calledpaging out(or “swapping out”); moving data from the backing store back in to physical memory is called
paging in(or “swapping in”). In iOS, there is no backing store and so pages are are never paged out to disk, but read-only pages are still be paged in from disk as needed.
In both OS X and iOS, the size of a page is 4 kilobytes. Thus, every time a page fault occurs, the system reads 4 kilobytes from disk.Disk thrashingcan occur when the system spends a disproportionate amount of time handling page faults and reading and writing pages, rather than executing code for a program.
Paging of any kind, and disk thrashing in particular, affects performance negatively because it forces the system to spend a lot of time reading and writing to disk. Reading a page in from the backing store takes a significant amount of time and is much slower than reading directly from RAM. If the system has to write a page to disk before it can read another page from disk, the performance impact is even worse.
Details of the Virtual Memory System
The logical address space of a process consists of mapped regions of memory. Each mapped memory region contains a known number of virtual memory pages. Each region has specific attributes controlling such things as inheritance (portions of the region may be mapped from “parent” regions), write-protection, and whether it iswired(that is, it cannot be paged out). Because regions contain a known number of pages, they are
page-aligned, meaning the starting address of the region is also the starting address of a page and the ending address also defines the end of a page.
The kernel associates aVM objectwith each region of the logical address space. The kernel uses VM objects to
About the Virtual Memory System
regions with either the default pager or the vnode pager. Thedefault pageris a system manager that manages the nonresident virtual memory pages in the backing store and fetches those pages when requested. The
vnode pagerimplements memory-mapped file access. The vnode pager uses the paging mechanism to provide a window directly into a file. This mechanism lets you read and write portions of the file as if they were located in memory.
In addition to mapping regions to either the default or vnode pager, a VM object may also map regions to another VM object. The kernel uses this self referencing technique to implementcopy-on-writeregions. Copy-on-write regions allow different processes (or multiple blocks of code within a process) to share a page as long as none of them write to that page. When a process attempts to write to the page, a copy of the page is created in the logical address space of the process doing the writing. From that point forward, the writing process maintains its own separate copy of the page, which it can write to at any time. Copy-on-write regions let the system share large quantities of data efficiently in memory while still letting processes manipulate those pages directly (and safely) if needed. These types of regions are most commonly used for the data pages loaded from system frameworks.
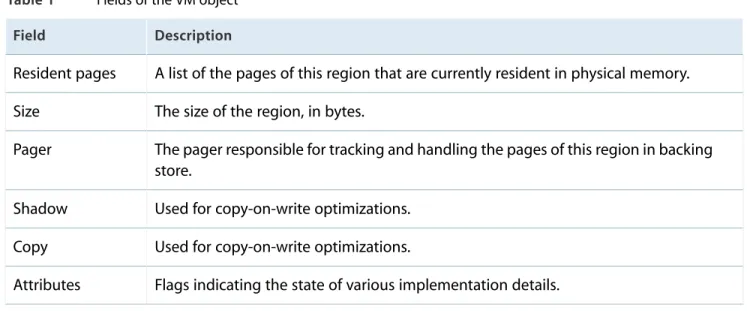
Each VM object contains several fields, as shown in Table 1.
Table 1 Fields of the VM object
Description Field
A list of the pages of this region that are currently resident in physical memory. Resident pages
The size of the region, in bytes. Size
The pager responsible for tracking and handling the pages of this region in backing store.
Pager
Used for copy-on-write optimizations. Shadow
Used for copy-on-write optimizations. Copy
Flags indicating the state of various implementation details. Attributes
If the VM object is involved in a copy-on-write (vm_copy) operation, the shadow and copy fields may point to other VM objects. Otherwise both fields are usuallyNULL.
About the Virtual Memory System
Wired Memory
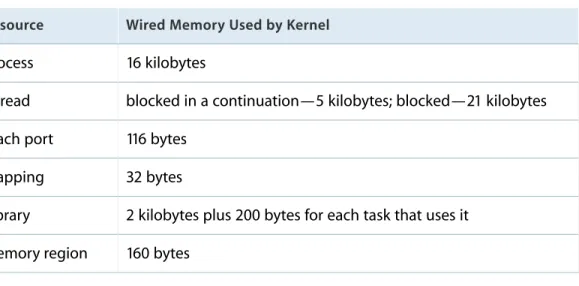
Wired memory (also calledresidentmemory) stores kernel code and data structures that must never be paged out to disk. Applications, frameworks, and other user-level software cannot allocate wired memory. However, they can affect how much wired memory exists at any time. For example, an application that creates threads and ports implicitly allocates wired memory for the required kernel resources that are associated with them. Table 2 lists some of the wired-memory costs for application-generated entities.
Table 2 Wired memory generated by user-level software
Wired Memory Used by Kernel Resource
16 kilobytes Process
blocked in a continuation—5 kilobytes; blocked—21 kilobytes Thread
116 bytes Mach port
32 bytes Mapping
2 kilobytes plus 200 bytes for each task that uses it Library
160 bytes Memory region
Note: These measurements may change with each new release of the operating system. They are provided here to give you a rough estimate of the relative cost of system resource usage.
As you can see, every thread, process, and library contributes to the resident footprint of the system. In addition to your application using wired memory, however, the kernel itself requires wired memory for the following entities:
● VM objects
● the virtual memory buffer cache ● I/O buffer caches
● drivers
Wired data structures are also associated with the physical page and map tables used to store virtual-memory mapping information, Both of these entities scale with the amount of available physical memory. Consequently, when you add memory to a system, the amount of wired memory increases even if nothing else changes.
About the Virtual Memory System
Wired memory pages are not immediately moved back to the free list when they become invalid. Instead they are “garbage collected” when the free-page count falls below the threshold that triggers page out events.
Page Lists in the Kernel
The kernel maintains and queries three system-wide lists of physical memory pages:
● Theactive listcontains pages that are currently mapped into memory and have been recently accessed. ● Theinactive listcontains pages that are currently resident in physical memory but have not been accessed
recently. These pages contain valid data but may be removed from memory at any time.
● Thefree listcontains pages of physical memory that are not associated with any address space of VM object. These pages are available for immediate use by any process that needs them.
When the number of pages on the free list falls below a threshold (determined by the size of physical memory), the pager attempts to balance the queues. It does this by pulling pages from the inactive list. If a page has been accessed recently, it is reactivated and placed on the end of the active list. In OS X, if an inactive page contains data that has not been written to the backing store recently, its contents must be paged out to disk before it can be placed on the free list. (In iOS, modified but inactive pages must remain in memory and be cleaned up by the application that owns them.) If an inactive page has not been modified and is not permanently resident (wired), it is stolen (any current virtual mappings to it are destroyed) and added to the free list. Once the free list size exceeds the target threshold, the pager rests.
The kernel moves pages from the active list to the inactive list if they are not accessed; it moves pages from the inactive list to the active list on a soft fault (seePaging In Process (page 11)). When virtual pages are swapped out, the associated physical pages are placed in the free list. Also, when processes explicitly free memory, the kernel moves the affected pages to the free list.
Paging Out Process
In OS X, when the number of pages in the free list dips below a computed threshold, the kernel reclaims physical pages for the free list by swapping inactive pages out of memory. To do this, the kernel iterates all resident pages in the active and inactive lists, performing the following steps:
1. If a page in the active list is not recently touched, it is moved to the inactive list.
2. If a page in the inactive list is not recently touched, the kernel finds the page’s VM object.
3. If the VM object has never been paged before, the kernel calls an initialization routine that creates and assigns a default pager object.
About the Virtual Memory System
4. The VM object’s default pager attempts to write the page out to the backing store.
5. If the pager succeeds, the kernel frees the physical memory occupied by the page and moves the page from the inactive to the free list.
Note: In iOS, the kernel does not write pages out to a backing store. When the amount of free memory dips below the computed threshold, the kernel flushes pages that are inactive and unmodified and may also ask the running application to free up memory directly. For more information on responding to these notifications, seeResponding to Low-Memory Warnings in iOS (page 20).
Paging In Process
The final phase of virtual memory management moves pages into physical memory, either from the backing store or from the file containing the page data. A memory access fault initiates the page-in process. A memory access fault occurs when code tries to access data at a virtual address that is not mapped to physical memory. There are two kinds of faults:
● Asoft faultoccurs when the page of the referenced address is resident in physical memory but is currently not mapped into the address space of this process.
● Ahard faultoccurs when the page of the referenced address is not in physical memory but is swapped out to backing store (or is available from a mapped file). This is what is typically known as a page fault.
When any type of fault occurs, the kernel locates the map entry and VM object for the accessed region. The kernel then goes through the VM object’s list of resident pages. If the desired page is in the list of resident pages, the kernel generates a soft fault. If the page is not in the list of resident pages, it generates a hard fault. For soft faults, the kernel maps the physical memory containing the pages to the virtual address space of the process. The kernel then marks the specific page as active. If the fault involved a write operation, the page is also marked as modified so that it will be written to backing store if it needs to be freed later.
For hard faults, the VM object’s pager finds the page in the backing store or from the file on disk, depending on the type of pager. After making the appropriate adjustments to the map information, the pager moves the page into physical memory and places the page on the active list. As with a soft fault, if the fault involved a write operation, the page is marked as modified.
About the Virtual Memory System
Memory is an important resource for your application so it’s important to think about how your application will use memory and what might be the most efficient allocation approaches. Most applications do not need to do anything special; they can simply allocate objects or memory blocks as needed and not see any
performance degradation. For applications that use large amount of memory, however, carefully planning out your memory allocation strategy could make a big difference.
The following sections describe the basic options for allocating memory along with tips for doing so efficiently. To determine if your application has memory performance problems in the first place, you need to use the Xcode tools to look at your application’s allocation patterns while it is running. For information on how to do that, seeTracking Memory Usage (page 26).
Tips for Improving Memory-Related Performance
As you design your code, you should always be aware of how you are using memory. Because memory is an important resource, you want to be sure to use it efficiently and not be wasteful. Besides allocating the right amount of memory for a given operation, the following sections describe other ways to improve the efficiency of your program’s memory usage.
Defer Your Memory Allocations
Every memory allocation has a performance cost. That cost includes the time it takes to allocate the memory in your program’s logical address space and the time it takes to assign that address space to physical memory. If you do not plan to use a particular block of memory right away, deferring the allocation until the time when you actually need it is the best course of action. For example, to avoid the appearance of your app launching slowly, minimize the amount of memory you allocate at launch time. Instead, focus your initial memory allocations on the objects needed to display your user interface and respond to input from the user. Defer other allocations until the user issues starts interacting with your application and issuing commands. This lazy allocation of memory saves time right away and ensures that any memory that is allocated is actually used. Once place where lazy initialization can be somewhat tricky is with global variables. Because they are global to your application, you need to make sure global variables are initialized properly before they are used by the rest of your code. The basic approach often taken with global variables is to define a static variable in one of your code modules and use a public accessor function to get and set the value, as shown in Listing 1.
Tips for Allocating Memory
Listing 1 Lazy allocation of memory through an accessor MyGlobalInfo* GetGlobalBuffer()
{
static MyGlobalInfo* sGlobalBuffer = NULL; if ( sGlobalBuffer == NULL )
{
sGlobalBuffer = malloc( sizeof( MyGlobalInfo ) ); }
return sGlobalBuffer; }
The only time you have to be careful with code of this sort is when it might be called from multiple threads. In a multithreaded environment, you need to use locks to protect theifstatement in your accessor method. The downside to that approach though is that acquiring the lock takes a nontrivial amount of time and must be done every time you access the global variable, which is a performance hit of a different kind. A simpler approach would be to initialize all global variables from your application’s main thread before it spawns any additional threads.
Initialize Memory Blocks Efficiently
Small blocks of memory, allocated using themallocfunction, are not guaranteed to be initialized with zeroes. Although you could use thememsetfunction to initialize the memory, a better choice is to use thecalloc
routine to allocate the memory in the first place. Thecallocfunction reserves the required virtual address space for the memory but waits until the memory is actually used before initializing it. This approach is much more efficient than usingmemset, which forces the virtual memory system to map the corresponding pages into physical memory in order to zero-initialize them. Another advantage of using thecallocfunction is that it lets the system initialize pages as they’re used, as opposed to all at once.
Reuse Temporary Memory Buffers
If you have a highly-used function that creates a large temporary buffer for some calculations, you might want to consider reusing that buffer rather than reallocating it each time you call the function. Even if your function needs a variable buffer space, you can always grow the buffer as needed using thereallocfunction. For multithreaded applications, the best way to reuse buffers is to add them to your thread-local storage. Although you could store the buffer using a static variable in your function, doing so would prevent you from using that function on multiple threads at the same time.
Tips for Allocating Memory
Caching buffers eliminates much of the overhead for functions that regularly allocate and free large blocks of memory. However, this technique is only appropriate for functions that are called frequently. Also, you should be careful not to cache too many large buffers. Caching buffers does add to the memory footprint of your application and should only be used if testing indicates it would yield better performance.
Free Unused Memory
For memory allocated using the malloc library, it is important to free up memory as soon as you are done using it. Forgetting to free up memory can cause memory leaks, which reduces the amount of memory available to your application and impacts performance. Left unchecked, memory leaks can also put your application into a state where it cannot do anything because it cannot allocate the required memory.
Note: Applications built using the Automatic Reference Counting (ARC) compiler option do not need to release Objective-C objects explicitly. Instead, the app must store strong references to objects it wants to keep and remove references to objects it does not need. When an object does not have any strong references to it, the compiler automatically releases it. For more information about supporting ARC, seeTransitioning to ARC Release Notes.
No matter which platform you are targeting, you should always eliminate memory leaks in your application. For code that uses malloc, remember that being lazy is fine for allocating memory but do not be lazy about freeing up that memory. To help track down memory leaks in your applications, use the Instruments app.
Memory Allocation Techniques
Because memory is such a fundamental resource, OS X and iOS both provide several ways to allocate it. Which allocation techniques you use will depend mostly on your needs, but in the end all memory allocations eventually use the malloc library to create the memory. Even Cocoa objects are allocated using the malloc library eventually. The use of this single library makes it possible for the performance tools to report on all of the memory allocations in your application.
If you are writing a Cocoa application, you might allocate memory only in the form of objects using thealloc
method ofNSObject. Even so, there may be times when you need to go beyond the basic object-related memory blocks and use other memory allocation techniques. For example, you might allocate memory directly usingmallocin order to pass it to a low-level function call.
The following sections provide information about the malloc library and virtual memory system and how they perform allocations. The purpose of these sections is to help you identify the costs associated with each type of specialized allocation. You should use this information to optimize memory allocations in your code.
Tips for Allocating Memory
Note: These sections assume you are using the system supplied version of the malloc library to do your allocations. If you are using a custom malloc library, these techniques may not apply.
Allocating Objects
For Objective-C based applications, you allocate objects using one of two techniques. You can either use the
allocclass method, followed by a call to a class initialization method, or you can use thenewclass method to allocate the object and call its defaultinitmethod in one step.
After creating an object, the compiler’s ARC feature determines the lifespan of an object and when it should be deleted. Every new object needs at least one strong reference to it to prevent it from being deallocated right away. Therefore, when you create a new object, you should always create at least one strong reference to it. After that, you may create additional strong or weak references depending on the needs of your code. When all strong references to an object are removed, the compiler automatically deallocates it.
For more information about ARC and how you manage the lifespan of objects, seeTransitioning to ARC Release Notes.
Allocating Small Memory Blocks Using Malloc
For small memory allocations, where small is anything less than a few virtual memory pages,malloc
sub-allocates the requested amount of memory from a list (or “pool”) of free blocks of increasing size. Any small blocks you deallocate using thefreeroutine are added back to the pool and reused on a “best fit” basis. The memory pool itself is comprised of several virtual memory pages that are allocated using thevm_allocate
routine and managed for you by the system.
When allocating any small blocks of memory, remember that the granularity for blocks allocated by the malloc library is 16 bytes. Thus, the smallest block of memory you can allocate is 16 bytes and any blocks larger than that are a multiple of 16. For example, if you callmallocand ask for 4 bytes, it returns a block whose size is 16 bytes; if you request 24 bytes, it returns a block whose size is 32 bytes. Because of this granularity, you should design your data structures carefully and try to make them multiples of 16 bytes whenever possible.
Tips for Allocating Memory
Note: By their nature, allocations smaller than a single virtual memory page in size cannot be page aligned.
Allocating Large Memory Blocks using Malloc
For large memory allocations, where large is anything more than a few virtual memory pages,malloc
automatically uses thevm_allocateroutine to obtain the requested memory. Thevm_allocateroutine assigns an address range to the new block in the logical address space of the current process, but it does not assign any physical memory to those pages right away. Instead, the kernel does the following:
1. It maps a range of memory in the virtual address space of this process by creating amap entry; the map entry is a simple structure that defines the starting and ending addresses of the region.
2. The range of memory is backed by the default pager.
3. The kernel creates and initializes a VM object, associating it with the map entry.
At this point there are no pages resident in physical memory and no pages in the backing store. Everything is mapped virtually within the system. When your code accesses part of the memory block, by reading or writing to a specific address in it, a fault occurs because that address has not been mapped to physical memory. In OS X, the kernel also recognizes that the VM object has no backing store for the page on which this address occurs. The kernel then performs the following steps for each page fault:
1. It acquires a page from the free list and fills it with zeroes.
2. It inserts a reference to this page in the VM object’s list of resident pages.
3. It maps the virtual page to the physical page by filling in a data structure called thepmap. The pmap contains the page table used by the processor (or by a separate memory management unit) to map a given virtual address to the actual hardware address.
The granularity of large memory blocks is equal to the size of a virtual memory page, or 4096 bytes. In other words, any large memory allocations that are not a multiple of 4096 are rounded up to this multiple
automatically. Thus, if you are allocating large memory buffers, you should make your buffer a multiple of this size to avoid wasting memory.
Note: Large memory allocations are guaranteed to be page-aligned.
For large allocations, you may also find that it makes sense to allocate virtual memory directly using
vm_allocate, rather than usingmalloc. The example in Listing 2 shows how to use thevm_allocate
function.
Tips for Allocating Memory
Listing 2 Allocating memory with vm_allocate void* AllocateVirtualMemory(size_t size) {
char* data;
kern_return_t err;
// In debug builds, check that we have // correct VM page alignment
check(size != 0);
check((size % 4096) == 0);
// Allocate directly from VM
err = vm_allocate( (vm_map_t) mach_task_self(), (vm_address_t*) &data, size, VM_FLAGS_ANYWHERE); // Check errors check(err == KERN_SUCCESS); if(err != KERN_SUCCESS) { data = NULL; } return data; }
Allocating Memory in Batches
If your code allocates multiple, identically-sized memory blocks, you can use themalloc_zone_batch_malloc
function to allocate those blocks all at once. This function offers better performance than a series of calls to
mallocto allocate the same memory. Performance is best when the individual block size is relatively small—less than 4K in size. The function does its best to allocate all of the requested memory but may return less than was requested. When using this function, check the return values carefully to see how many blocks were
Tips for Allocating Memory
Batch allocation of memory blocks is supported in OS X version 10.3 and later and in iOS. For information, see the/usr/include/malloc/malloc.hheader file.
Allocating Shared Memory
Shared memory is memory that can be written to or read from by two or more processes. Shared memory can be inherited from a parent process, created by a shared memory server, or explicitly created by an application for export to other applications. Uses for shared memory include the following:
● Sharing large resources such as icons or sounds ● Fast communication between one or more processes
Shared memory is fragile and is generally not recommended when other, more reliable alternatives are available. If one program corrupts a section of shared memory, any programs that also use that memory share the corrupted data. The functions used to create and manage shared memory regions are in the
/usr/include/sys/shm.hheader file.
Using Malloc Memory Zones
All memory blocks are allocated within a malloc zone (also referred to as a malloc heap). Azoneis a variable-size range of virtual memory from which the memory system can allocate blocks. A zone has its own free list and pool of memory pages, and memory allocated within the zone remains on that set of pages. Zones are useful in situations where you need to create blocks of memory with similar access patterns or lifetimes. You can allocate many objects or blocks of memory in a zone and then destroy the zone to free them all, rather than releasing each block individually. In theory, using a zone in this way can minimize wasted space and reduce paging activity. In reality, the overhead of zones often eliminates the performance advantages associated with the zone.
Note: The term zone is synonymous with the terms heap, pool, and arena in terms of memory allocation using themallocroutines.
By default, allocations made using themallocfunction occur within the default malloc zone, which is created whenmallocis first called by your application. Although it is generally not recommended, you can create additional zones if measurements show there to be potential performance gains in your code. For example, if the effect of releasing a large number of temporary (and isolated) objects is slowing down your application, you could allocate them in a zone instead and simply deallocate the zone.
Tips for Allocating Memory
If you are create objects (or allocate memory blocks) in a custom malloc zone, you can simply free the entire zone when you are done with it, instead of releasing the zone-allocated objects or memory blocks individually. When doing so, be sure your application data structures do not hold references to the memory in the custom zone. Attempting to access memory in a deallocated zone will cause a memory fault and crash your application.
Warning: You should never deallocate the default zone for your application.
At the malloc library level, support for zones is defined in/usr/include/malloc/malloc.h. Use the
malloc_create_zonefunction to create a custom malloc zone or themalloc_default_zonefunction to get the default zone for your application. To allocate memory in a particular zone, use themalloc_zone_malloc
,malloc_zone_calloc,malloc_zone_valloc, ormalloc_zone_reallocfunctions. To release the memory in a custom zone, callmalloc_destroy_zone.
Copying Memory Using Malloc
There are two main approaches to copying memory in OS X: direct and delayed. For most situations, the direct approach offers the best overall performance. However, there are times when using a delayed-copy operation has its benefits. The goal of the following sections is to introduce you to the different approaches for copying memory and the situations when you might use those approaches.
Copying Memory Directly
The direct copying of memory involves using a routine such asmemcpyormemmoveto copy bytes from one block to another. Both the source and destination blocks must be resident in memory at the time of the copy. However, these routines are especially suited for the following situations:
● The size of the block you want to copy is small (under 16 kilobytes). ● You intend to use either the source or destination right away. ● The source or destination block is not page aligned.
● The source and destination blocks overlap.
If you do not plan to use the source or destination data for some time, performing a direct copy can decrease performance significantly for large memory blocks. Copying the memory directly increases the size of your application’s working set. Whenever you increase your application’s working set, you increase the chances of paging to disk. If you have two direct copies of a large memory block in your working set, you might end up paging them both to disk. When you later access either the source or destination, you would then need to
Tips for Allocating Memory
Note: If the source and destination blocks overlap, you should prefer the use ofmemmoveover
memcpy. The implementation ofmemmovehandles overlapping blocks correctly in OS X, but the implementation ofmemcpyis not guaranteed to do so.
Delaying Memory Copy Operations
If you intend to copy many pages worth of memory, but don’t intend to use either the source or destination pages immediately, then you may want to use thevm_copyfunction to do so. Unlikememmoveormemcpy,
vm_copydoes not touch any real memory. It modifies the virtual memory map to indicate that the destination address range is a copy-on-write version of the source address range.
Thevm_copyroutine is more efficient thanmemcpyin very specific situations. Specifically, it is more efficient in cases where your code does not access either the source or destination memory for a fairly large period of time after the copy operation. The reason thatvm_copyis effective for delayed usage is the way the kernel handles the copy-on-write case. In order to perform the copy operation, the kernel must remove all references to the source pages from the virtual memory system. The next time a process accesses data on that source page, a soft fault occurs, and the kernel maps the page back into the process space as a copy-on-write page. The process of handling a single soft fault is almost as expensive as copying the data directly.
Copying Small Amounts of Data
If you need to copy a small blocks of non-overlapping data, you should prefermemcpyover any other routines. For small blocks of memory, the GCC compiler can optimize this routine by replacing it with inline instructions to copy the data by value. The compiler may not optimize out other routines such asmemmoveor
BlockMoveData.
Copying Data to Video RAM
When copying data into VRAM, use theBlockMoveDataUncachedfunction instead of functions such asbcopy. Thebcopyfunction uses cache-manipulation instructions that may cause exception errors. The kernel must fix these errors in order to continue, which slows down performance tremendously.
Responding to Low-Memory Warnings in iOS
The virtual memory system in iOS does not use a backing store and instead relies on the cooperation of applications to remove strong references to objects. When the number of free pages dips below the computed threshold, the system releases unmodified pages whenever possible but may also send the currently running
Tips for Allocating Memory
application a low-memory notification. If your application receives this notification, heed the warning. Upon receiving it, your application must remove strong references to as many objects as possible. For example, you can use the warnings to clear out data caches that can be recreated later.
UIKit provides several ways to receive low-memory notifications, including the following:
● Implement theapplicationDidReceiveMemoryWarning:method of your application delegate. ● Override thedidReceiveMemoryWarningmethod in your customUIViewControllersubclass. ● Register to receive theUIApplicationDidReceiveMemoryWarningNotificationnotification.
Upon receiving any of these notifications, your handler method should respond by immediately removing strong references to objects. View controllers automatically remove references to views that are currently offscreen, but you should also override thedidReceiveMemoryWarningmethod and use it to remove any additional references that your view controller does not need.
If you have only a few custom objects with known purgeable resources, you can have those objects register for theUIApplicationDidReceiveMemoryWarningNotificationnotification and remove references there. If you have many purgeable objects or want to selectively purge only some objects, however, you might want to use your application delegate to decide which objects to keep.
Important: Like the system applications, your applications should always handle low-memory warnings, even if they do not receive those warnings during your testing. System applications consume small amounts of memory while processing requests. When a low-memory condition is detected, the system delivers low-memory warnings to all running programs (including your application) and may terminate some background applications (if necessary) to ease memory pressure. If not enough memory is released—perhaps because your application is leaking or still consuming too much memory—the system may still terminate your application.
Tips for Allocating Memory
Caching and purgeable memory can be vital assets to developers who are dealing with large objects that require significant memory or computation time, or developers whose code is getting bogged down as the computer writes data to disk because the RAM is full.
Overview of Caching
A cache is a collection of objects or data that can greatly increase the performance of applications.
Why Use Caching?
Developers use caches to store frequently accessed objects with transient data that can be expensive to compute. Reusing these objects can provide performance benefits, because their values do not have to be recalculated. However, the objects are not critical to the application and can be discarded if memory is tight. If discarded, their values will have to be recomputed again when needed.
Problems Caching Can Cause
Although caching can provide enormous benefits in terms of performance, there are also some possible drawbacks that caching presents. Most importantly, caching can use very large amounts of memory. When caching many large data objects, it is possible to cache so many objects that there is no RAM left for other applications, and the computer will grind to a halt as it writes all of this data to disk in order to free up RAM.
Solutions
Cocoa provides anNSCacheobject as a convenient storage container for items you want to cache, while at the same time addressing the memory management issues discussed above. TheNSCacheclass is very similar to theNSDictionaryclass, in that they both hold key-value pairs. However, anNSCacheobject is a “reactive cache.” That is, when memory is available, it aggressively caches any data it is given. Yet, when memory is low, it will automatically discard some of its elements in order to free up memory for other applications. Later, if these discarded items are needed, their values will have to be recalculated.
NSCacheprovides two other useful "limit" features: limiting the number of cached elements and limiting the total cost of all elements in the cache. To limit the number of elements that the cache is allowed to have, call the methodsetCountLimit:. For example, if you try to add 11 items to a cache whosecountLimitis set to10, the cache could automatically discard one of the elements.
When adding items to a cache, you can specify acostvalue to be associated with each key-value pair. Call thesetTotalCostLimit: method to set the maximum value for the sum of all the cached objects’ costs. Thus, when an object is added that pushes the totalCostabove thetotalCostLimit, the cache could automatically evict some of its objects in order to get back below the threshold. This eviction process is not guaranteed, so trying to manipulate thecostvalues to achieve specific behavior could be detrimental to the performance of the cache. Pass in0for thecostif you have nothing useful, or use thesetObject:forKey:
method, which does not require a cost to be passed in.
Note: The count limit and the total-cost limit are not strictly enforced. That is, when the cache goes over one of its limits, some of its objects might get evicted immediately, later, or never, all depending on the implementation details of the cache.
Using Purgeable Memory
The Cocoa framework also provides theNSPurgeableDataclass to help ensure that your applications do not use up too much memory. TheNSPurgeableDataclass adopts theNSDiscardableContentprotocol, which any class can implement to allow memory to be discarded when clients of the class's instances are finished accessing those objects. You should implementNSDiscardableContentwhen creating objects that have disposable subcomponents. In addition, theNSPurgeableDataclass does not have to be used in conjunction withNSCache; you may use it independently to get purging behavior.
Advantages of Using Purgeable Memory
By using purgeable memory, you allow the system to quickly recover memory if it needs to, thereby increasing performance. Memory that is marked as purgeable is not paged to disk when it is reclaimed by the virtual memory system because paging is a time-consuming process. Instead, the data is discarded, and if needed later, it will have to be recomputed.
A caveat when using purgeable memory is that the block of memory must be locked before being accessed. This locking mechanism is necessary to ensure that no auto-removal policies try to dispose of the data while you are accessing it. Similarly, the locking mechanism will ensure that the virtual memory system has not already discarded the data. TheNSPurgeableDataclass implements a very simple locking mechanism to
Caching and Purgeable Memory
How to Implement Purgeable Memory
TheNSPurgeableDataclass is very simple to use, because the class simply implements the
NSDiscardableContentprotocol. Then notion of a “counter” variable is central to the life cycle of
NSDiscardableContentobjects. When the memory being used by this object is being read, or is still needed, its counter variable will be greater than or equal to1. When it is not being used, and can be discarded, the counter variable is equal to0.
When the counter is equal to0, the block of memory may be discarded if memory is tight. To discard the content, calldiscardContentIfPossibleon the object, which frees the associated memory if the counter variable equals0.
By default, when anNSPurgeableDataobject is initialized, it is created with the counter variable equal to1
and can safely be accessed. To access purgeable memory, simply call thebeginContentAccessmethod. This method will first check to make sure the object’s data has not been discarded. If the data is still there, it will increment the counter variable in order to protect the memory while it is being read, and returnYES. If the data has been discarded, this method will returnNO. When you are done accessing the data, call
endContentAccess, which decrements the counter and allows the memory to be discarded if the system desires to do so. You must keep track of the counter variable’s state and access memory only if the
beginContentAccessmethod returnsYES.
The system or client objects call thediscardContentIfPossiblemethod to discard the purgeable data if the system’s available memory is running low. This method will only discard the data if its counter variable is
0, and otherwise does nothing. Lastly, theisContentDiscardedmethod returnsYESif the memory has been discarded.
Below is an example of a life cycle for anNSPurgeableDataobject:
NSPurgeableData * data = [[NSPurgeableData alloc] init];
[data endContentAccess]; //Don't necessarily need data right now, so mark as discardable.
//Maybe put data into a cache if you anticipate you will need it later.
...
if([data beginContentAccess]) { //YES if data has not been discarded and counter variable has been incremented
...Some operation on the data...
[data endContentAccess] //done with the data, so mark as discardable } else {
Caching and Purgeable Memory
//data has been discarded, so recreate data and complete operation data = ...
[data endContentAccess]; //done with data }
//data is able to be discarded at this point if memory is tight
Purgeable Memory and NSCache
When objects that implement theNSDiscardableContentprotocol are put inNSCacheobjects, the cache keeps a strong reference to the object. However, if an object’s content has been discarded and the cache’s
evictsObjectsWithDiscardedContentvalue is set toYES, the object is automatically removed from the cache and is not found by a lookup call.
Some Warnings About Purgeable Memory
A caveat to using purgeable memory is that only large objects or chunks of memory can use it directly. The purgeable memory API acts on multi page virtual memory objects, which makes it hard to mark a single small cache element as purgeable. The caching API will do the required bookkeeping to allow small cache elements to use purgeable memory. Likewise, there will be cases where it is awkward to allocate the memory for cache elements through the API directly, such as when a convenience method is used to allocate an object or when an object is allocated in a different layer than the layer doing the caching. In such cases, it is not possible to use purgeable memory.
When to Use Purgeable Memory
It makes sense to use purgeable memory when the expected cost of purging is less than the expected cost of paging — when the cost of paging is greater than the cost of recomputing the particular data value times the probability that that data item is reused. Many caches fall into this category because their speculative nature makes it likely that the items will not be used again. Similarly, cache items that are easily recomputed are prime candidates for purgeable memory, because the application will not take a huge performance hit if their values have to be recalculated.
Caching and Purgeable Memory
If you suspect your code is not using memory as efficiently as it could, the first step in determining if there is a problem is to gather some baseline data. Monitoring your code using one of the Apple-provided performance tools can give you a picture of your code’s memory usage and may highlight potential problems or point to areas that need further examination. The following sections describe the tools most commonly used for memory analysis and when you might want to use them.
Tracking Allocations With Instruments
The Instruments application is always a good starting point for doing any sort of performance analysis. Instruments is an integrated, data-gathering environment that uses special modules (called instruments) to gather all sorts of information about a process. Instruments can operate on your application’s shipping binary file—you do not need to compile special modules into your application to use it. The library of the Instruments application contains four modules that are designed specifically for gathering memory-related data. These modules are as follows:
● The ObjectAlloc instrument records and displays a history of all memory allocations since the launch of your application.
● The Leaks instrument looks for allocated memory that is no longer referenced by your program’s code; seeFinding Leaks Using Instruments (page 29).
● The Shared Memory instrument monitors the opening and unlinking of shared memory regions. ● The Memory Monitor instrument measures and records the system’s overall memory usage.
You can add any or all of these instruments to a single trace document and gather data for each of them simultaneously. Being able to gather the data all at once lets you correlate information from one instrument with the others. For example, the Leaks instrument is often combined with the ObjectAlloc instrument so that you can both track the allocations and find out which ones were leaked.
After gathering data for your application, you need to analyze it. The following sections provide tips on how to analyze data using several of the memory-related instruments. For information on how to use the Leaks instrument, seeFinding Leaks Using Instruments (page 29).
Analyzing Memory Allocations with the ObjectAlloc Instrument
You use the ObjectAlloc instrument to track the memory allocation activity for your application. This instrument tracks memory allocations from the time your application is launched until you stop recording data. The instrument shows you the allocations in terms of the number of objects created and the size (or type) of the objects that were created. In the icon viewing mode, the instrument displays a real-time histogram that lets you see changes and trends directly as they occur. It also retains a history of allocations and deallocations, giving you an opportunity to go back and see where those objects were allocated.
The information displayed by the ObjectAlloc instrument is recorded by an allocation statistics facility built into the Core Foundation framework. When this facility is active, every allocation and deallocation is recorded as it happens.
Analyzing Shared Memory Usage
For Mac apps, the Shared Memory instrument tracks calls to anyshm_openandshm_unlinkfunctions, which are used for opening and closing regions of shared memory in the system. You can use this information to find out where your application is getting references to shared memory regions and to examine how often those calls are being made. The detail pane displays the list of each function call along with information about the calling environment at the time of the call. Specifically, the pane lists the executable that initiated the call and the function parameters. Opening the Extended Detail pane shows the stack trace associated with the call.
Analyzing Data from the Memory Monitor Instrument
For Mac apps, the Memory Monitor instrument displays assorted statistics about system memory usage. You can use this instrument to view the memory usage trends in your application or on the entire system. For example, you can see how much memory is currently active, inactive, wired, and free. You can also see the amount of memory that has been paged in or out. You might use this instrument in conjunction with other instruments to track the amount of memory your application uses with respect to specific operations.
Tracking Memory Allocations With malloc_history
In OS X, themalloc_historytool displays backtrace data showing exactly where your program made calls to themallocandfreefunctions. If you specify an address when callingmalloc_history, the tool tracks memory allocations occurring at that address only. If you specify the-all_by_sizeor-all_by_count
options, the tool displays all allocations, grouping frequent allocations together.
Tracking Memory Usage
Before using themalloc_historytool on your program, you must first enable the malloc library logging features by setting theMallocStackLoggingto1. You may also want to set the
MallocStackLoggingNoCompactenvironment variable to retain information about freed blocks. For more information on these variables, seeEnabling the Malloc Debugging Features (page 32).
Themalloc_historytool is best used in situations where you need to find the previous owner of a block of memory. If you determine that a particular data is somehow becoming corrupted, you can put checks into your code to print the address of the block when the corruption occurs. You can then usemalloc_history
to find out who owns the block and identify any stale pointers.
Themalloc_historytool is also suited for situations where Sampler or MallocDebug cannot be used. For example, you might use this tool from a remote computer or in situations where you want a minimal impact on the behavior of your program.
For more information on using themalloc_historytool, seemalloc_historyman page.
Examining Memory With the heap Tool
In OS X, theheapcommand-line tool displays a snapshot of the memory allocated by the malloc library and located in the address space of a specified process. For Cocoa applications, this tool identifies Objective-C objects by name. For both memory blocks and objects, the tool organizes the information by heap, showing all items in the same heap together.
Theheaptool provides much of the same information as the ObjectAlloc instrument, but does so in a much less intrusive manner. You can use this tool from a remote session or in situations where the use of Instruments might slow the system down enough to affect the resulting output.
For more information about using theheaptool, seeheap(1)man page.
Tracking Memory Usage
Memory leaks are blocks of allocated memory that the program no longer references. Leaks waste space by filling up pages of memory with inaccessible data and waste time due to extra paging activity. Leaked memory eventually forces the system to allocate additional virtual memory pages for the application, the allocation of which could have been avoided by reclaiming the leaked memory.
For apps that use malloc, memory leaks are bugs and should always be fixed. For apps that use only Objective-C objects, the compiler’s ARC feature deallocates objects for you and generally avoids the problem of memory leaks. However, apps that mix the use of Objective-C objects and C-based structures must manage the ownership of objects more directly to ensure that the objects are not leaked.
The malloc library can only reclaim the memory you tell it to reclaim. If you callmallocor any routine that allocates memory, you must balance that call with a correspondingfree. A typical memory leak occurs when you forget to deallocate memory for a pointer embedded in a data structure. If you allocate memory for embedded pointers in your code, make sure you release the memory for that pointer prior to deallocating the data structure itself.
Another typical memory leak example occurs when you allocate memory, assign it to a pointer, and then assign a different value to the pointer without freeing the first block of memory. In this example, overwriting the address in the pointer erases the reference to the original block of memory, making it impossible to release.
Finding Leaks Using Instruments
The Instruments application can be used to find leaks in both OS X and iPhone applications. To find leaks, create a new document template in Instruments and add the Leaks instrument to it. The Leaks instrument provides leak-detection capabilities identical to those in theleakscommand-line tool. The Leaks instrument records all allocation events that occur in your application and then periodically searches the application’s writable memory, registers, and stack for references to any active memory blocks. If it does not find a reference to a block in one of these places, it deems the block a “leak” and displays the relevant information in the Detail pane.
In the Detail pane, you can view leaked memory blocks using Table and Outline modes. In Table mode, Instruments displays the complete list of leaked blocks, sorted by size. Selecting an entry in the table and
Finding Memory Leaks
that address. Selecting an entry from this allocation history then shows the stack trace for that event in the Extended Detail pane of the document window. In Outline mode, the Leaks instrument displays leaks organized by call tree, which you can use to get information about the leaks in a particular branch of your code.
For more information about using the Instruments application, including more information about the information displayed by the Leaks instrument, seeInstruments User Guide.
Using the leaks Tool
In OS X, theleakscommand-line tool searches the virtual memory space of a process for buffers that were allocated bymallocbut are no longer referenced. For each leaked buffer it finds,leaksdisplays the following information:
● the address of the leaked memory ● the size of the leak (in bytes) ● the contents of the leaked buffer
Ifleakscan determine that the object is an instance of an Objective-C or Core Foundation object, it also displays the name of the object. If you do not want to view the contents of each leaked buffer, you can specify the-nocontextoption when callingleaks. If theMallocStackLoggingenvironment variable is set and you are running your application ingdb,leaksdisplays a stack trace describing where the buffer was allocated. For more information onmallocdebugging options, seeEnabling the Malloc Debugging Features (page 32).
Note: The leaks command-line tool is located in/usr/bin.
Tips for Improving Leak Detection
The following guidelines can help you find memory leaks quickly in your program. Most of these guidelines are intended to be used with theleakstool but some are also applicable for use with MallocDebug and general use.
● Runleaksduring unit testing. Because unit testing exercises all code paths in a repeatable manner, you are more likely to find leaks than you would be if you were testing your code in a production environment. ● Use the-excludeoption ofleaksto filter out leaks in functions with known memory leaks. This option
helps reduce the amount of extraneous information reported byleaks.
● Ifleaksreports a leak intermittently, set up a loop around the target code path and run the code hundreds or thousands of times. This increases the likelihood of the leak reappearing more regularly.
Finding Memory Leaks
● Run your program againstlibgmalloc.dylibingdb. This library is an aggressive debugging malloc library that can help track down insidious bugs in your code. For more information, see thelibgmalloc
man page.
● For Cocoa and iPhone applications, if you fix a leak and your program starts crashing, your code is probably trying to use an already-freed object or memory buffer. Set theNSZombieEnabledenvironment variable toYESto find messages to already freed objects.
Most unit testing code executes the desired code paths and exits. Although this is perfectly normal for unit testing, it creates a problem for theleakstool, which needs time to analyze the process memory space. To fix this problem, you should make sure your unit-testing code does not exit immediately upon completing its tests. You can do this by putting the process to sleep indefinitely instead of exiting normally.
Finding Memory Leaks
Debugging memory-related bugs can be time consuming if you do not know where to start looking. This is usually compounded by the problem that many memory bugs occur well after the memory in question was manipulated by the code. Fortunately, Xcode includes options for identifying memory problems closer to when those problems actually happen.
Enabling Guard Malloc
Guard Malloc is a special version of the malloc library that replaces the standard library during debugging. Guard Malloc uses several techniques to try and crash your application at the specific point where a memory error occurs. For example, it places separate memory allocations on different virtual memory pages and then deletes the entire page when the memory is freed. Subsequent attempts to access the deallocated memory cause an immediate memory exception rather than a blind access into memory that might now hold other data. When the crash occurs, you can then go and inspect the point of failure in the debugger to identify the problem.
To enable debugging using Guard Malloc, configure your project to run with Guard Malloc in Xcode’s scheme editor. You can use this option for Mac apps and iOS apps running in the simulator.
For more information about the types of memory problems that Guard Malloc can help you track down, see thelibgmallocman page inOS X Man Pages.
Configuring the Malloc Environment Variables
The malloc library provides debugging features to help you track down memory smashing bugs, heap corruption, references to freed memory, and buffer overruns. You enable these debugging options through a set of environment variables. With the exception ofMallocCheckHeapStartandMallocCheckHeapEach, the value for most of these environment variables is ignored. To disable a variable from Terminal, use theunset
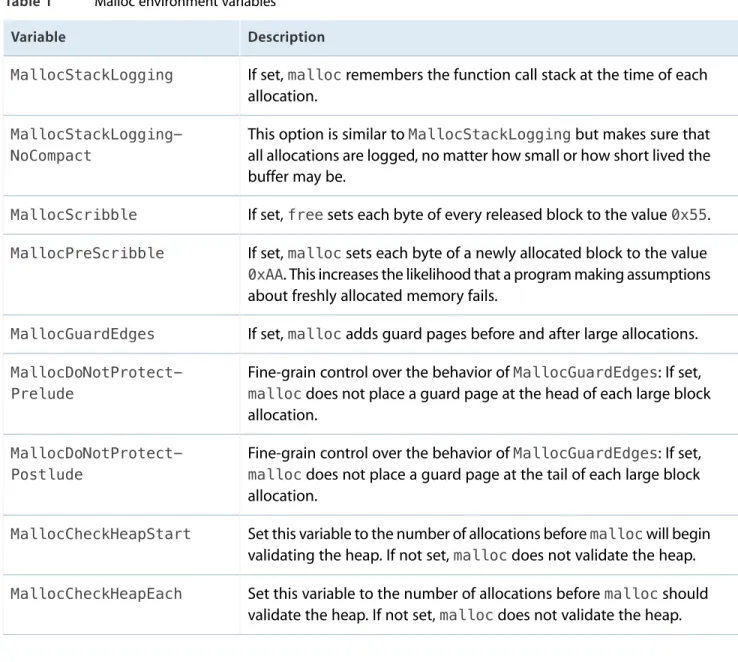
command. Table 1 lists some of the key environment variables and describes their basic function. For a complete list of variables, see themallocman page.
Table 1 Malloc environment variables
Description Variable
If set,mallocremembers the function call stack at the time of each allocation.
MallocStackLogging
This option is similar toMallocStackLoggingbut makes sure that all allocations are logged, no matter how small or how short lived the buffer may be.
MallocStackLogging-NoCompact
If set,freesets each byte of every released block to the value0x55.
MallocScribble
If set,mallocsets each byte of a newly allocated block to the value
0xAA. This increases the likelihood that a program making assumptions about freshly allocated memory fails.
MallocPreScribble
If set,mallocadds guard pages before and after large allocations.
MallocGuardEdges
Fine-grain control over the behavior ofMallocGuardEdges: If set,
mallocdoes not place a guard page at the head of each large block allocation.
MallocDoNotProtect-Prelude
Fine-grain control over the behavior ofMallocGuardEdges: If set,
mallocdoes not place a guard page at the tail of each large block allocation.
MallocDoNotProtect-Postlude
Set this variable to the number of allocations beforemallocwill begin validating the heap. If not set,mallocdoes not validate the heap.
MallocCheckHeapStart
Set this variable to the number of allocations beforemallocshould validate the heap. If not set,mallocdoes not validate the heap.
MallocCheckHeapEach
The following example enables stack logging and heap checking in the current shell before running an application. The value forMallocCheckHeapStartis set to 1 but is irrelevant and can be set to any value you want. You could also set these variables from your shell’s startup file, although if you do be sure toexport
each variable.
% MallocStackLogging=1 % MallocCheckHeapStart=1000 % MallocCheckHeapEach=100 % ./my_tool
Enabling the Malloc Debugging Features
If you want to run your program ingdb, you can set environment variables from the Xcode debugging console using the commandset env, as shown in the following example:
% gdb
(gdb) set env MallocStackLogging 1 (gdb) run
Some of the performance tools require these options to be set in order to gather their data. For example, the
malloc_historytool can identify the allocation site of specific blocks if theMallocStackLoggingflag is set. This tool can also describe the blocks previously allocated at an address if the
MallocStackLoggingNoCompactenvironment variable is set. Theleakscommand line tool will name the allocation site of a leaked buffer ifMallocStackLoggingis set. See the man pages forleaksand
malloc_historyfor more details.
Detecting Double Freed Memory
The malloc library reports attempts to callfreeon a buffer that has already been freed. If you have enabled theMallocStackLoggingNoCompactoption, you can use the logged stack information to find out where in your code the secondfreecall was made. You can then use this information to set up an appropriate breakpoint in the debugger and track down the problem.
The malloc library reports information tostderr.
Detecting Heap Corruption
To enable heap checking, assign values to theMallocCheckHeapStartandMallocCheckHeapEach
environment variables. You must set both of these variables to enable heap checking. The
MallocCheckHeapStartvariable tells the malloc library how manymalloccalls to process before initiating the first heap check. Set the second to the number ofmalloccalls to process between heap checks.
TheMallocCheckHeapStartvariable is useful when the heap corruption occurs at a predictable time. Once it hits the appropriate start point, the malloc library starts logging allocation messages to the Terminal window. You can watch the number of allocations and use that information to determine approximately where the heap is being corrupted. Adjust the values forMallocCheckHeapStartandMallocCheckHeapEachas necessary to narrow down the actual point of corruption.
Enabling the Malloc Debugging Features
Detecting Memory Smashing Bugs
To find memory smashing bugs, enable theMallocScribblevariable. This variable writes invalid data to freed memory blocks, the execution of which causes an exception to occur. When using this variable, you should also set theMallocStackLoggingandMallocStackLoggingNoCompactvariables to log the location of the exception. When the exception occurs, you can then use themalloc_historycommand to track down the code that allocated the memory block. You can then use this information to track through your code and look for any lingering pointers to this block.
Enabling the Malloc Debugging Features
If you need more detailed information about virtual memory usage, you can use thetop,vm_stat,pagestuff, andvmmapcommand-line tools for analyzing your Mac apps. The information returned by these tools ranges from summary information about all the system processes to detailed information about a specific process. The following sections provide information on using thevm_stat,pagestuff, andvmmaptools to gather detailed memory information. For more information on using Instruments to analyze memory, seeInstruments User Guideand the other articles in this document. For information on how to use thetoptool, seePerformance Overview.
Viewing Virtual Memory Statistics
Thevm_stattool displays high-level statistics about the current virtual memory usage of the system. By default,vm_statdisplays these statistics once, but you can specify an interval value (in seconds) to update these statistics continuously. For information on the usage of this tool, see thevm_statman page.
Listing 1 shows an example of the output fromvm_stat.
Listing 1 Output of vm_stat tool
Mach Virtual Memory Statistics: (page size of 4096 bytes)
Pages free: 3194.
Pages active: 34594.
Pages inactive: 17870.
Pages wired down: 9878.
"Translation faults": 6333197.
Pages copy-on-write: 81385.
Pages zero filled: 3180051.
Pages reactivated: 343961.
Pageins: 33043.
Pageo