Copyright © UNU-WIDER 2006 * Addis Ababa University, Ethiopia.
This study has been prepared within UNU-WIDER’s research on Globalization, Finance and Growth, linked to the project on Financial Sector Development for Growth and Poverty Reduction.
UNU-WIDER gratefully acknowledges the financial contributions to the research programme by the governments of Denmark (Royal Ministry of Foreign Affairs), Finland (Ministry for Foreign Affairs), Norway (Royal Ministry of Foreign Affairs), Sweden (Swedish International Development Cooperation Agency—Sida) and the United Kingdom (Department for International Development).
ISSN 1810-2611 ISBN 92-9190-896-7 (internet version)
Research Paper No. 2006/112
The Structure and Performance
of Ethiopia’s Financial Sector
in the Pre- and Post-Reform Period
with a Special Focus on Banking
Alemayehu Geda
*
October 2006
Abstract
Since 1992 Ethiopia has been engaged in liberalizing its financial sector. The hallmark of the strategy is gradualism. The approach is not without problems especially from Bretton Woods Institutions that saw the reform as a sluggish process. This study examines this liberalization program by analyzing the performance of the sector before and after the reform. The study notes that given the nascent development of the financial sector in the country, the relatively good shape in which the existing financial institutions find themselves, and given that supervision and regulation capacity of the regulating agency is weak, the government’s strategy of gradualism and its over all reform direction is encouraging. However, we argue for charting out clearly defined time frame for liberalization and exploring the possibility of engaging with foreign banks to acquire new technology that enhance the efficiency of the financial sector in general and the banking sector in particular.
Keywords: financial sector development, growth, banking, financial liberalization, Ethiopia, Africa
The World Institute for Development Economics Research (WIDER) was established by the United Nations University (UNU) as its first research and training centre and started work in Helsinki, Finland in 1985. The Institute undertakes applied research and policy analysis on structural changes affecting the developing and transitional economies, provides a forum for the advocacy of policies leading to robust, equitable and environmentally sustainable growth, and promotes capacity strengthening and training in the field of economic and social policy making. Work is carried out by staff researchers and visiting scholars in Helsinki and through networks of collaborating scholars and institutions around the world.
www.wider.unu.edu [email protected]
UNU World Institute for Development Economics Research (UNU-WIDER) Katajanokanlaituri 6 B, 00160 Helsinki, Finland
Camera-ready typescript prepared by Lorraine Telfer-Taivainen at UNU-WIDER
The views expressed in this publication are those of the author(s). Publication does not imply endorsement by the Institute or the United Nations University, nor by the programme/project sponsors, of
Acknowledgements
1 Introduction
One of the main objectives of financial institutions is mobilizing resources (in particular domestic saving) and channeling these to would-be investors. This intermediation role of financial institutions takes different forms in different economic systems. Ethiopia’s history of the last three decades clearly shows the validity of this statement.
Under state socialism (1974-91), popularly referred to in Ethiopia as the ‘Derg1 regime’, financial institutions were basically executing the economic plans outlined by the central planning organ. In that period regulation and supervision were not critical because the national plan regulated and directed the activities of financial institutions. Moreover, financial institutions were directed to finance some public projects that may not have passed proper financial appraisal but were simply based on either ideological grounds or ‘merit wants’ arguments.
Following the demise of the Derg regime in 1991, post-1991 economic policy witnessed a marked departure from the previous Socialist system. The main difference lay in openly adopting a market-oriented economic policy. In fact many of the policies adopted by the new government in Addis in 1991 had already been proposed by the defunct Derg regime as it approached the end of its reign. This new change in policy brought about a significant change in the functioning of the financial sector. Not only was the financial sector going to serve the private sector, which had hitherto been demonized, but new private financial institutions were also emerging. At the same time the role of the Ethiopia’s central bank, the National Bank of Ethiopia (NBE), was also reformulated. Thus, financial sector reconstruction was at the top of the government’s agenda.
In undertaking this task the Ethiopian government adopted a strategy of (a) gradualism: gradual opening up of private banks and insurance companies alongside public ones, gradual liberalization of the foreign exchange market, and so on, and (b) strengthening domestic competitive capacity before full liberalization (that is, restricting the sector to domestic investors, strengthening the regulatory and supervision capacity of the NBE, giving the banks autonomy, and opening up the interbank money market). In line with this strategy various proclamations and regulations have been passed since 1992 (Geda and Dendir 2001).
The rest of the chapter is organized as follows. In section 2 a brief overview of Ethiopian banking history is presented. This is followed with an analysis of the financial sector in the pre- and post-reform periods in section 3. Section 4 concludes.
2 A brief history of banking in Ethiopia
The history of the use of modern money in Ethiopia can be traced back more than 2000 years (Pankhrust 1968 cited in Gedey 1990). It flourished in what is called the Axumite era which ran from 1000 BC to around AD 975. Leaving that long history aside, modern banking in Ethiopia started in 1905 with the establishment of Abyssinian Bank which was based on a fifty year agreement with the Anglo-Egyptian National Bank. In 1908 a new development bank (called Societe Nationale d’Ethiope Pour le Development de l’Agriculture et du Commerce) and two other foreign banks (Banque de l’Indochine and the Compagnie de l’Afrique Orientale) were also established (Pankhrust 1968 cited in Degefe 1995). These banks were criticized for being wholly foreign owned. In 1931 the Ethiopian government purchased the Abyssinian Bank, which was the dominant bank, and renamed it the Bank of Ethiopia—the first nationally owned bank on the African continent (Gedey 1990: 83; Degefe 1995: 234).
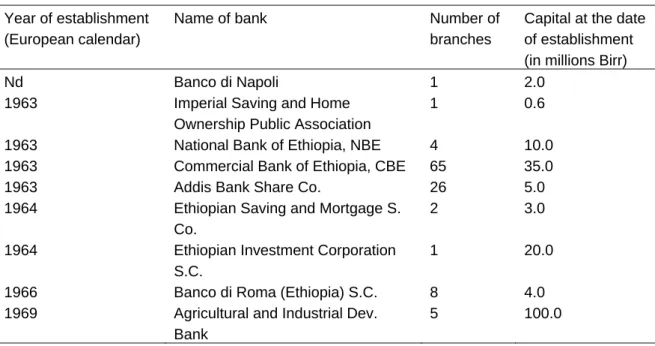
During the five-years of Italian occupation (1936-41) banking activity expanded. The Italian banks were particularly active. Table 1a shows most of the banks that were in operation during this period. After independence from Italy’s brief occupation, where the role of Britain was paramount owing to its strategic planning during the Second World War, Barclays Bank was established and it remained in business in Ethiopia between 1941 and 1943 (Gedey 1990; Degefe 1995). Following this, in 1943 the Ethiopian government established the State Bank of Ethiopia. The establishment of the Bank by Ethiopia was a painful process because Britain was against it (see Degefe 1995 for an interesting neo-colonial story). The Bank of Ethiopia was operating as both a commercial and a central bank until 1963 when it was remodeled into today’s National Bank of Ethiopia (the Central Bank, re-established in 1976) and the Commercial Bank of Ethiopia (CBE). After this period many other banks were established; and just before the 1974 revolution the banks listed in Table 1b were in operation.
All privately owned financial institutions including three commercial banks, thirteen insurance companies, and two non-bank financial intermediaries were nationalized on 1 January 1975.2 The nationalized banks were reorganized and one commercial bank (the Commercial Bank of Ethiopia), a national bank (recreated in 1976), two specialized banks—the Agricultural and Industrial Bank (AIB), renamed recently as the Development Bank of Ethiopia (DBE) and a Housing and Saving Bank (HSB), renamed recently as the Construction and Business Bank (CBB), and one insurance company (Ethiopian Insurance Company)—were formed. Following the regime change in 1991 and the liberalization policy in 1992, these financial institutions were reorganized to
2 The commercial banks were Addis Ababa Bank, Banco di Napoli and Banco di Roma. The insurance companies were African Solidarity, Ethio-American life, Blue Nile, Ethiopian General, Imperial, Afro-Continental, Pan-African, Union, Ras, and Ethiopian Life and Rasi. The non-bank financial intermediaries were the Imperial Saving and Home Ownership Public Association and the Mortgage Corporation (Degefe 1995: 273).
work to a market-oriented policy framework. Moreover, new privately owned financial institutions were also allowed to work alongside the publicly owned ones. The rest of this chapter examines these financial institutions.
Table 1a: Banks in operation during the brief period of Italian occupation (1936-41)
Year of establishment (European calendar)
Name of bank Number of branches
1914* Banco di Italy 9 1914* Banco di Roma 18 1939 Banco di Napoli 4 1939 Banco Nacionale (De’s Voro) 4
1939 Casa de Creito 1
1939 Society Nacionale di Ethiopia 1
Total 37
Source: Gedey (1990). *These two banks of Italian origin were established before the Italian occupation.
Table 1b: Banks in operation before the 1974 revolution
Year of establishment (European calendar)
Name of bank Number of branches
Capital at the date of establishment (in millions Birr)
Nd Banco di Napoli 1 2.0
1963 Imperial Saving and Home Ownership Public Association
1 0.6
1963 National Bank of Ethiopia, NBE 4 10.0 1963 Commercial Bank of Ethiopia, CBE 65 35.0 1963 Addis Bank Share Co. 26 5.0 1964 Ethiopian Saving and Mortgage S.
Co.
2 3.0
1964 Ethiopian Investment Corporation S.C.
1 20.0
1966 Banco di Roma (Ethiopia) S.C. 8 4.0 1969 Agricultural and Industrial Dev.
Bank
5 100.0
Source: Gedey (1990).
3 The structure and performance of the financial sector in the pre- and post-reform periods
Following the McKinnon (1973) and Shaw (1973) paradigm, financial liberalization has been high on the agenda of developing countries. The financial repression school (as it is sometimes referred to) argues that government intervention in the finance sector, in particular through subsidized interest rates and (favoured) credit allocation, not only distorts the financial market but also depresses savings and leads to inefficient investment. The policy prescription that follows is liberalization. This has been endorsed by the international financial and development institutions, such as the World
Bank and the International Monetary Fund (IMF), and was high on the agenda of the reform packages prescribed for most developing countries called Structural Adjustment Programmes (SAPs).
Many of the developing countries, with the exception of a few in Asia, that went through this agonizing reform process have been unable to enjoy the promised benefits in general, and the promised financial sector prosperity in particular. Vos (1993) noted that the major factors which could explain the failure of financial liberalization in Latin America and its success in Asian countries (such as South Korea and Taiwan) were the control and intervention by the state to address structural problems without disregarding market-oriented performance criteria. Thus, for Vos, gradualism and addressing some of the gaps in financial sector reform—such as the lack of sensible prudential supervisory capacity in place before the onset of reform—are crucial.
3.1 The pre-reform financial sector in Ethiopia
The pre-reform period here refers to the period 1974 to 1991 (the Derg regime). During this period all private banks were nationalized. The National Bank of Ethiopia was at the apex of the banking structure and was engaged in all the functions of a central bank. As noted earlier, CBE, AIDB (DBE), HSB (CBB) were in operation during this period. In addition to these banks, there were also two other financial institutions: Ethiopian Insurance Corporation (EIC) and the Pension and Social Security Authority (PSSA). The CBE, followed by the DBE, were and remain the most important banks in the country both before and after reform. Owing to the dominant position of these two banks, their major activities and performance is discussed at length below. This helps to provide a picture of banking activity in the country both before and after the 1992 reform.
The Commercial Bank of Ethiopia
The CBE was established in its present form by a merger of one of the nationalized private bank (Addis Bank) with that of the publicly owned commercial bank by proclamation No. 184 (1980). The CBE is directed by a board and managed by three mangers (one general and two deputies) appointed by the government. The management is supported by detailed monthly and quarterly reports from the bank’s various branches.
Mobilization of deposits
Table 2a shows the mobilization of deposits by the CBE in the pre- and post-reform period. The Table shows that the CBE is the dominant bank accounting for more than 90 per cent of the total deposits mobilized in the country in the pre-reform period. This share is the highest for demand deposits (100 per cent) followed by saving (96 per cent)
Table 2a: Commercial Bank of Ethiopia: deposit mobilization (Birr, millions) Years (Ethiopian calendar) Demand deposits CBE’s share to national total Saving deposits CBE’s share to national total Time deposits CBE's share to national total Total deposits CBE's share to national total Before reform 1979/80 692.8 100.0 442.2 97.7 186.0 51.4 1,321.0 87.6 1980/81 199.3 100.0 47.8 71.8 42.4 76.4 289.5 90.1 1981/82 91.9 100.0 58.3 91.0 20.3 82.9 170.5 94.5 1982/83 169.4 100.0 108.6 92.3 14.5 52.3 292.5 92.9 1983/84 1,258.2 100.0 761.1 95.1 292.1 56.2 2,311.4 89.6 1984/85 1,531.3 100.0 812.8 95.7 340.1 59.0 2,684.2 90.8 1985/86 1,784.7 100.0 939.2 96.5 324.8 56.6 3,048.7 91.5 1986/87 2,029.3 100.0 1,053.2 97.0 182.3 30.3 3,264.8 87.8 1987/88 2,251.1 100.0 1,208.0 95.4 111.8 19.8 3,570.9 87.5 1988/89 2,255.8 100.0 1,367.1 95.4 155.3 23.3 3,778.2 86.8 1989/90 2,496.0 100.0 1,574.5 96.1 130.8 18.2 4,201.3 86.5 1990/91 2,602.9 100.0 1,676.7 95.7 134.8 17.6 4,414.4 86.2 Average (1979/80- 1990/91) 1,446.9 100.0 837.5 93.3 161.3 45.3 2,445.6 89.3 After reform 1991/92 2,869.9 100.0 1,999.1 95.8 152.9 21.4 5,021.9 88.6 1992/93 3,460.7 100.0 2,450.5 95.1 315.6 44.4 6,226.8 92.3 1993/94 4,211.4 100.0 2,844.3 94.6 381.2 49.1 7,436.9 93.0 1994/95 5,503.5 99.8 3,649.3 94.8 445.5 62.6 9,598.3 95.3 1995/96 6,038.2 99.2 4,584.8 95.5 570.6 75.8 11,193.6 96.2 1996/97 7,067.9 96.2 5,090.2 89.5 546.7 64.6 12,704.8 91.5 1997/98 9,197.5 96.3 5,623.1 86.7 697.5 41.6 15,518.1 87.6 1998/99 8,579.5 94.5 6,000.1 84.0 437.3 27.1 15,016.9 84.2 1999/00 9,862.0 94.0 6,648.8 80.2 406.2 26.8 16,917.0 83.3 2000/01 10,857.6 93.2 7,474.5 76.4 490.4 28.6 18,822.5 81.3 2001/02 11,055.8 90.6 8,087.5 73.2 445.5 25.0 19,588.8 78.3 2002/03 12,070.1 88.8 8,685.4 69.5 378.3 20.0 21,133.8 75.5 Average (1991/92- 2002/03) 7,564.5 96.1 5,261.5 86.3 439.0 40.6 13,265.0 87.3
Source: Annual Reports of National Bank of Ethiopia (NBE), various years.
The CBE’s share of total deposits has dropped to an average of 87 per cent in the post-reform period; the figure for 2002/03 was 75.5 per cent. The sharp decline in CBE’s share in total deposits observed in 2002/03 was primarily due to the performance of the new private banks, in particular the Awash and Dashen Banks. The share of the CBB and DBE has also increased (see Table 2a).
Clearly there is an evolving structural shift when deposits are observed by institutions (that is, by type of ownership). In general the trend is to move away from a dominant
public sector towards a financial structure where the role of the private sector is becoming increasingly important. In general, during the two periods (before and after the reform), demand deposits by the private sector and individuals increased; the share of cooperatives declined; and the share of public enterprises and agencies declined. Financial agencies’ share also declined while the central government’s share increased. In terms of saving and time deposits, the private sector had the lion’s share in both periods. This is attributed to the government’s rule restricting public enterprises and agencies from holding such deposits (Geda 1999).
Loans and advances
Tables 2b and 2c show the CBE’s outstanding loans disaggregated by sector and ‘institution’. In the years immediately before reform (1985-91) the CBE’s average outstanding loans were highest in the international trade sector (15 per cent in 1989) followed by housing and construction and domestic trade (about 6 per cent) and industry (5.5 per cent). In the post-reform period, outstanding loans with the international trade sector grew enormously (reaching an average19.3 per cent for the period 1992-2003). This was followed by domestic trade (12.6 per cent), industry (7.2 per cent) and transport and communication (5.4 per cent). Loans to central government, which were about 62 per cent in pre-reform period, declined by nearly half to 36 per cent in the post-reform period. This perhaps indicates the discipline the government was exercising in its fiscal and monetary polices.
When the outstanding loans by institutional are broken down, outstanding loans to public enterprises (which were about 27 per cent in last five years of the pre-reform period) declined to an average of 15 per cent in the post-reform period, the figure for 2002/03 being 5 per cent. The share of the private sector, however, increased from 14 per cent to 47 per cent between the two periods. This is attributed to the liberalization programme which resulted in the increasing exposure of the CBE to competition from the private sector. As for the government, as noted above, the CBE’s outstanding loans to government dropped by nearly half.
Table 2b: Commercial Bank of Ethiopia: loans and advances, by sector (in per cent, unless stated otherwise) Before reform 1985 /86 1986 /87 1987 /88 1988 /89 1989 /90 1990 /91 1985-91 (ave) 1992-03 (ave) Central government 61.7 58.1 53.5 59.7 65.7 70.7 61.6 36.2 Agriculture 1.9 2.7 2.6 1.9 1.5 1.3 2.0 2.6 Industry 4.4 5.0 5.9 6.7 5.6 5.3 5.5 7.2 Domestic trade 5.7 7.2 8.8 5.5 4.7 3.7 5.9 12.6 International trade 14.5 15.9 17.4 16.4 13.8 10.6 14.8 19.3 export 8.9 6.0 5.6 7.5 5.1 5.7 6.5 7.7 imports 5.6 10.0 11.8 8.9 8.7 4.9 8.3 11.7
Housing & construction 7.0 6.3 6.4 6.0 5.7 5.5 6.1 4.1
Transport & communication 3.2 3.0 4.2 2.7 2.0 1.8 2.8 5.4
Hotels and tourism 0.5 0.5 0.4 0.3 0.3 0.4 0.4 1.3
Mines, power & water res. 0.0 0.0 0.0 0.0 0.0 0.0 0.0 0.0
Personal 0.4 0.4 0.4 0.3 0.3 0.4 0.4 0.2
Others 0.7 0.7 0.5 0.4 0.4 0.4 0.5 11.2
Total (Birr, millions) 2,352.7 2,500.0 2,800.0 3,130.4 3,406.2 3,721.1
inter-bank lending 19.4 18.6 17.7 24.2 25.9 25.1
After reform 1992 /93 1993 /94 1994 /95 1995 /96 1996 /97 1997 /98 1998 /99 1999 /00 2000 /01 2001 /02 2002 /03 Central government 52.3 46.8 34.5 32.2 22.0 20.9 22.4 22.1 41.5 47.1 55.9 Agriculture 0.9 1.4 2.2 2.4 3.5 3.4 3.5 3.5 2.4 2.8 2.3 Industry 11.0 8.9 6.1 6.5 7.5 7.5 7.5 7.1 6.4 5.6 5.5 Domestic trade 8.6 14.0 16.7 19.5 20.4 18.3 12.9 12.5 6.9 5.3 3.6 International trade 19.0 18.9 20.8 19.6 25.0 25.3 24.6 21.8 15.5 13.7 8.1 export 8.2 10.1 9.8 7.3 9.8 9.5 9.7 7.4 5.6 4.0 2.7 imports 10.8 8.8 11.0 12.3 15.2 15.9 14.8 14.4 9.9 9.7 5.4
Housing & construction 4.1 4.1 4.1 4.0 4.5 4.0 4.3 4.5 4.0 3.3 3.8
Transport & communication 2.7 4.1 6.6 9.6 10.0 8.3 4.8 5.9 3.4 2.2 1.4
Hotels and tourism 0.9 1.3 2.4 1.8 2.0 1.9 1.2 1.1 0.7 1.0 0.5
Mines, power & water res. 0.0 0.0 0.0 0.0 0.0 0.0 0.0 0.0 0.0 0.0 0.0
Personal 0.3 0.2 0.2 0.2 0.2 0.2 0.1 0.1 0.1 0.1 0.2
Others 0.2 0.5 6.4 4.2 4.9 10.1 18.6 21.4 19.1 18.8 18.7
Total (Birr, millions) 5008.9 5596.5 7450.9 8841.7 9497.1 10486.9 11582.7 12097.9 16620.4 17338.8 17943.3
inter-bank lending 110.6 128 179.5 527.6 540.8 496.7 546.9 676.9 564.3 0 456.6
Grand total (Birr, millions) 5119.5 5724.5 7630.4 9369.3 10037.9 10983.6 12129.6 12774.8 17184.7 17338.8 18399.9
Table 2c: Commercial Bank of Ethiopia: outstanding loans and advances by institutional category
Public sector Private sector
Before reform Central government (1) Total (2=3+4) Financial sector (3) Non-financial sector (4) Private sector (5) Co-operatives (6) Private enterprises and agencies (7=5-6) Total 1985/86 1,451.1 565.8 19.4 546.4 355.2 2.8 352.4 2,372.1 1986/87 1,451.6 655.5 18.6 636.9 411.5 29.8 381.7 2,518.6 1987/88 1,497.8 846.6 17.7 828.9 473.3 20.8 452.5 2,817.7 1988/89 1,868.5 897.8 24.2 873.6 388.3 22.1 366.2 3,154.6 1989/90 2,239.3 812.1 25.9 786.2 380.7 12.7 368.0 3,432.1 Average value (1985/86-89/90) 1,567.3 741.4 20.0 721.5 407.1 18.9 388.2 2,715.8
Average annual share
(1985/86- 89/90) 57.7 27.3 0.7 26.6 15.0 0.7 14.3 100.0 End of period (1988/89) share 59.2 28.5 0.8 27.7 12.3 0.7 11.6 100.0 After reform 1992/93 2,617.4 1,492.6 110.6 1,382.0 1,009.5 33.1 976.4 5,119.5 1993/94 2,617.2 1,616.6 128.0 1,488.6 1,490.7 65.7 1,425.0 5,724.5 1994/95 2,573.7 1,953.1 179.5 1,773.6 0.0 107.7 2,995.9 7,630.4 1995/96 2,847.2 2,403.2 527.6 1,875.6 4,418.9 107.0 4,311.9 9,669.3 1996/97 2,089.8 2,113.6 540.8 1,572.8 5,834.5 122.3 5,712.2 10,037.9 1997/98 2,193.1 1,984.5 496.7 1,487.8 6,806.0 113.0 6,693.0 10,983.6 1998/99 2,599.8 1,740.1 546.9 1,193.2 7,789.7 339.6 7,450.1 12,129.6 1999/2000 2,675.8 2,027.0 676.9 1,350.1 8,072.0 325.1 7,746.9 12,774.8 2000/01 6,901.3 1,733.9 564.3 1,169.6 8,549.7 261.2 8,288.5 17,184.8 2001/02 8,160.7 1,449.5 0.0 0.0 7,728.6 298.4 7,430.2 17,338.8 2002/03 10,038.7 986.5 0.0 0.0 6,917.9 283.9 6,634.0 17,943.1 Average value (1992/93-2002/03) 4,119.5 1,772.8 342.8 1,208.5 5,328.9 187.0 5,424.0 11,503.3 Average share (1992/93-2002/03) 35.8 15.4 3.0 10.5 46.3 1.6 47.2 100.0 End of period (2002/03) share 55.9 5.5 0.0 0.0 38.6 1.6 37.0 100.0
Table 2d: Commercial Bank of Ethiopia: loan collection by institutional disaggregation Before reform Central government State entrprises Financial sector Non-financial sector Private sector Co-peratives Private enterprises and agencies
Total Total less IB lending 1985/86 0.0 117.5 0.9 116.6 206.8 3.6 203.2 324.3 97.6 1986/87 0.0 137.4 0.0 137.4 137.0 9.0 128.0 274.4 0.0 1987/88 0.0 186.0 0.9 185.1 218.8 66.8 152.0 404.8 0.0 1988/89 0.0 143.8 0.9 142.9 174.4 49.1 125.3 318.2 0.0 1989/90 0.0 172.3 0.9 171.4 223.2 30.5 192.7 395.5 0.0 1990/91 0.0 107.1 0.9 106.2 172.8 36.7 136.1 279.9 0.0
Average annual value
(1985/86-90/91) 0.0 151.4 0.7 150.7 192.0 31.8 160.2 343.4 19.5
Average annual share
(1985/86-90/91) 0.0 44.1 0.2 43.9 55.9 9.3 46.7 100.0 5.7 After reform 1992/93 0.0 160.3 1.7 158.6 373.8 49.3 324.5 534.1 0.0 1993/94 0.0 443.1 1.4 441.7 892.4 35.9 856.5 1,335.5 0.0 1994/95 0.0 283.5 1.3 282.2 1,180.0 239.4 1,516.9 2,039.8 2,038.5 1995/96 0.0 303.6 0.0 303.6 2,399.3 292.5 2,106.8 2,702.9 2,703.0 1996/97 0.0 338.7 71.9 266.8 2,418.1 243.9 2,174.2 2,756.8 2,684.9 1997/98 0.0 197.3 44.3 153.0 2,494.1 342.7 2,151.4 2,691.4 2,624.7 1998/99 0.0 187.3 75.9 111.4 2,572.6 294.5 2,278.1 2,759.9 2,684.0 1999/00 0.0 256.6 102.4 154.2 1,916.1 365.7 1,550.4 2,172.8 2,070.3 2000/01 0.0 290.3 146.8 143.5 2,366.2 501.3 1,865.0 2,656.5 2,509.7
2001/02 0.0 93.3 0.0 0.0 2,016.4 481.4 1,535.0 2,109.7 82.7
2002/03 0.0 154.2 0.0 0.0 2,073.4 339.4 1,734.0 2,227.6 59.8
Average annual value
(1992/93-02/03) 0.0 246.2 40.5 183.2 1,882.0 289.6 1,644.8 2,180.6 1,587.1
Average annual share
(1992/93-02/03) 0.0 11.3 1.9 8.4 86.3 13.3 75.4 100.0 72.8
Source: CBE, Annual Reports, Various years and Statistic Review of CBE.
Table 2e: Commercial Bank of Ethiopia: loan collection by sector (% unless otherwise stated)
Before reform 1985/86 1986/87 1987/88 1988/89 1989/90 1990/91 1985-91 (ave) 1992-03 (ave) Central government 0.0 0.0 0.0 0.0 0.0 0.0 0.0 0.0 Agriculture 4.8 3.6 15.4 10.1 5.2 1.5 6.8 14.6 Industry 19.7 12.2 10.9 10.6 16.7 17.7 14.6 12.1 Domestic trade 27.4 33.4 21.2 36.6 26.5 39.5 30.8 35.1 International trade 30.2 30.1 37.0 24.3 31.6 20.2 28.9 14.4 Export 19.3 17.7 12.1 8.6 23.8 8.3 15.0 7.0 Imports 10.9 12.4 24.8 15.7 7.8 11.8 13.9 7.5
Housing and construction 2.0 2.8 4.5 3.4 2.9 1.8 2.9 2.6
Transport and communication 8.7 11.3 5.0 9.5 9.2 7.9 8.6 9.9
Mines, power and water res. 0.0 0.0 0.0 0.0 0.0 0.0 0.0 0.0
Personal 3.8 2.4 2.9 1.8 3.6 5.4 3.3 1.5
Others 1.1 1.2 1.1 1.5 1.7 2.3 1.5 5.8
Grand total (Birr, million) 324.3 274.1 403.9 383.1 400.6 334.9
interbank lending 0.9 0.0 0.9 0.9 0.9 1.8 0.9 45
Total (Birr, million) 325.2 274.1 404.8 384.0 401.5 336.7
After reform 1992/93 1993/94 1994/95 1995/96 1996/97 1997/98 1998/99 1999/2000 2000/01 2001/02 2002/03 Central government 0.0 0.0 0.0 0.0 0.0 0.0 0.0 0.0 0.0 0.0 0.0 Agriculture 0.7 2.4 10.5 12.8 9.6 14.0 17.6 22.3 26.3 24.6 19.7 Industry 25.0 26.7 12.5 8.1 6.9 6.7 8.5 11.6 10.2 9.7 7.3 Domestic trade 40.8 39.2 47.8 35.6 42.2 36.2 35.2 33.2 27.0 25.6 23.9 International trade 15.1 14.5 12.5 17.6 16.8 17.3 11.9 4.6 11.3 17.3 19.8 export 8.8 9.5 4.4 9.1 6.6 6.2 6.5 1.6 4.3 6.2 13.4 imports 6.3 5.1 8.1 8.5 10.2 11.0 5.4 2.9 6.9 11.1 6.4
Housing and construction 1.6 1.4 0.7 0.3 0.8 2.0 2.2 2.7 2.1 4.5 10.1
Transport and communication 4.6 5.1 4.8 7.8 12.5 11.9 13.4 14.7 13.0 11.0 9.9
Hotels and tourism 5.8 4.8 5.0 6.2 3.8 3.8 3.4 3.3 2.7 2.8 2.2
Mines, power and water res. 0.0 0.0 0.0 0.0 0.0 0.0 0.0 0.0 0.0 0.0 0.0
Personal 2.9 2.2 1.6 0.9 1.2 1.4 1.3 1.5 1.3 1.2 1.5
Others 3.6 3.7 4.6 10.7 6.2 6.7 6.6 6.2 6.1 3.3 5.8
Grand total (Birr, million) 532.4 1334.1 2038.5 2702.9 2684.9 2625 2693 2070.5 2393.9 2112.5 2225.86
interbank lending 1.7 1.4 1.2 0.1 71.9 44.2 69.7 102.4 121.1 27.8 56.7
Total (Birr, million) 534.1 1335.5 2039.7 2703 2756.8 2669.2 2762.7 2172.9 2515 2140.3 2282.56
Loan collection
In the pre-reform period the highest loan collection was made from domestic trade, followed by import and exports, and industry (in order of importance). In terms of institutional disaggregation, loan collection from the private sector was significant, constituting nearly 47 per cent in the pre-reform period and reaching an average figure of nearly 75 per cent in the post-reform period. Loan collection from the public sector (state enterprises) had been falling steadily in the pre-reform period. This trend has also continued in the post-reform period (it dropped from 44 per cent to 11 per cent between the two periods). This indicates the bad financial shape the public sector was in (details are given in Tables 2d and 2e). In general, total loan collection has shown a marked improvement in the post-reform period. The growth figure, which was generally negative in the pre-reform period, changed to a positive one in the post-reform period. Thus, the performance of the CBE in this regard is quite commendable. This highlights the important point that existing public banks, with proper regulation and a sound policy environment, can improve their performance enormously. Hence, privatization, as the IMF has argued, may not be the only approach which can bring about efficiency in the banking sector.
Asset quality
Table 2f shows the quality of assets at the CBE. The liquidity ratio in both periods is quite high, being well above the statutory requirement of 20 per cent in all periods. These figures show an increasing trend in the post-reform period. The quality of the bank’s assets can also be inferred from the ‘loan to deposit ratio’ that increasingly shows a declining percentage (notwithstanding the increase in credit) which in turn shows that the bank had a strong resource base. By 1998 the loan to deposit ratio had the lowest figure of 71 per cent. (Note however, that this analysis is based on official figures). Observations and discussions with other researchers showed that non-performing loan figures, which are usually modest in government reports, need to be viewed with caution.3 However, the main conclusion that can be made from the analysis of the bank's asset quality (as reported) is that the CBE has quite an impressive record. This can be contrasted with the IMF’s and World Bank’s recommendation to either privatize or divide the CBE. On asset quality grounds there is no justification for such a policy proposal. The IMF and World Bank argument may stand on competition grounds: which I will return to at the end of this chapter.
3 There are unconfirmed reports that put this figure as high as 40 per cent in the last four to five years and now (at the time of writing) dropping close to 15 per cent.
Table 2f: Commercial Bank of Ethiopia: asset quality of the at the end of the fiscal period, June of each year (Birr, million) Year Liquid assets to net deposits ratio [1] Excess liquidity (over the 20% requirement) Liquidity ratio in % [2] Loan to deposit ratio Loan to deposit ratio (including loans to government) in % Non-performing assets to total assets Credit quality in % [3] Total assets in millions of Birr Annual growth of assets 1988 0.407 723.9 63.87 0.7927 37.51 18.2 4825.72 1989 0.348 539.9 60.26 0.8388 34.65 20.7 5021.4 0.041 1990 0.331 540 63.56 0.8212 29.08 0.04* 23.9 5199.98 0.036 1991 0.298 428.3 50.79 0.8533 26.08 0.39* 27.4 5363.6 0.031 After reform 1992 0.372 854.3 68.42 0.7846 26.29 0.039 26.1 6090.29 0.135 1993 0.423 1334.9 86.37 0.8362 42.07 0.026 15.8 9060.84 0.488 1994 0.534 2319.7 87.86 0.7857 43.75 0.018 14.2 11217.4 0.238 1995 0.514 2842.6 79.68 0.7881 52.15 0.015 25.4 14273.1 0.272 1996 0.358 1668.9 57.59 0.8590 61.92 8.4 15858 0.11 1997 0.4 2938 59.09 0.7982 63.46 12.1 16549.4 0.044 1998 0.44 4286.9 63.11 0.7113 57.14 10.9
Notes: [1] Liquid assets which is {cash (local or foreign) + reserves with NBE + demand balance with other domestic banks + deposits with Eritrea Bank + treasury bills + demand balance with foreign banks}divided by net deposit balance which is {total deposits–uncleared cheques paid (local)–uncleared effects (foreign)}. [2] is{reserves with NBE + cash on hand in local currency + net foreign assets [foreign assets–short term liabilities]} divided by net demand deposit [total demand deposit–uncleared cheques], expressed in per cent. [3] Provision for bad and doubtful debts to total deposits ratio.
Example: 1988 on this table is fiscal year 1987/88 and 1997 is fiscal year 1996/97.
As can be read from Table 2f, the CBE’s total assets showed a modest growth rate before reform. In the post-reform period the bank’s assets grew annually by double digit figures. In particular, the unprecedented growth of nearly 50 per cent in 1993 is clearly associated with the reform process. According to the CBE’s Annual Report, this high growth is attributed to the growth in net loans and advances, customers’ liability for Letter of Credit (LC), cash with foreign banks, and deposits with NBE (in order of importance). In particular loans and advances in 1992/93 increased by nearly 125 percentage points (constituting nearly 25 per cent of the bank’s total assets, for the first time in two decades). This is attributed to the growing demand for credit (and hence the effort to satisfy that demand) owing to liberalization. The availability of foreign exchange and the devaluation that took place during this period (devaluation of 240 per cent in 1992) also contributed to the growth of this figure. Throughout the subsequent years loans and advances to the private sector have shown sustained increments.
In sum, the CBE is the dominant bank in the country. Both the quality and structure of assets and various performance indicators show that the bank is generally in good shape. There are certain areas, such as non-performing loans and failure to adopt new technology to improve the efficiency of its services, where the CBE is weak. The relevant policy prescription would seem to be to intensify the ongoing restructuring and accompany that with prudential regulation. It seems extremely difficult to arrive at a policy prescription of privatization from an examination of the existing data, as the World Bank and IMF have done.
The Development Bank of Ethiopia
The mobilization of deposits by the DBE was fairly stagnant in the five years before reform. However, it dropped sharply just before the reform period and during the first two years of the post-reform period. At the time of writing the DBE’s level is picking up again, and reaching the level registered in the pre-reform period; see Geda (1999) for detail.
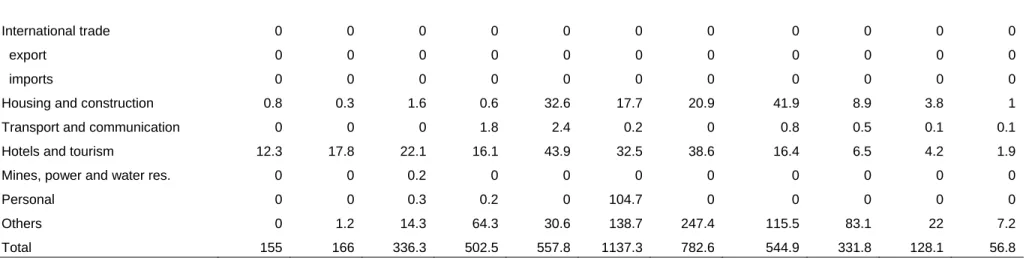
Table 2g shows the DBE’s loan disbursement by sector. Both in the post- and pre-reform periods the highest share of loans disbursed went to the agricultural sector. This is followed by loans disbursed to the industrial sector. In terms of the magnitude of the loans advanced, recent years have seen a marked decline, with total loans advanced by DBE declining from 155 million in 1992/93 to about 57 million in 2002/03 (see Table 2g). In terms of loan by type of ownership, the bias against the private sector witnessed during the pre-reform period is reversed in the post-reform period. This reversal shows the success of redirecting the emphasis from public to private sector.
Table 2g: Development Bank of Ethiopia: loan disbursement by sector (Birr, million) Before reform 1985/86 1986/87 1987/88 1988/89 1989/90 1990/91 Agriculture 267.1 132.3 305.1 238.8 214.2 81 Industry 25.9 38 35.9 110.9 78.9 43.3 Domestic trade 0 0 0 0 0 0 International trade 0 0 0 0 0 0 export 0 0 0 0 0 0 imports 0 0 0 0 0 0
Housing and construction 2.5 0.4 1.4 1.6 1 2.2
Transport and communication 0.4 0 0 2.9 0.7 0
Hotels and tourism 0.5 0 1 1.7 4.7 12.7
Mines, power and water res. 3.9 18 19.8 18.1 19.9 0
Personal 0 0 0 0 0 0 Others 0.2 0.2 0 0 0 0 Total 300.5 188.9 363.2 374 319.4 139.2 After reform 1992/93 1993/94 1994/95 1995/96 1996/97 1997/98 1998/99 1999/2000 2000/01 2001/02 2002/03 Agriculture 117.6 27.8 162.5 266.3 275.4 417.5 284.9 223.9 108.5 60.1 31.7 Industry 24.3 118.9 134.2 153.2 172.9 426 190.8 146.4 124.3 37.9 14.9 Domestic trade 0 0 1.1 0 0 0 0 0 0 0 0
International trade 0 0 0 0 0 0 0 0 0 0 0
export 0 0 0 0 0 0 0 0 0 0 0
imports 0 0 0 0 0 0 0 0 0 0 0
Housing and construction 0.8 0.3 1.6 0.6 32.6 17.7 20.9 41.9 8.9 3.8 1
Transport and communication 0 0 0 1.8 2.4 0.2 0 0.8 0.5 0.1 0.1
Hotels and tourism 12.3 17.8 22.1 16.1 43.9 32.5 38.6 16.4 6.5 4.2 1.9
Mines, power and water res. 0 0 0.2 0 0 0 0 0 0 0 0
Personal 0 0 0.3 0.2 0 104.7 0 0 0 0 0
Others 0 1.2 14.3 64.3 30.6 138.7 247.4 115.5 83.1 22 7.2
Total 155 166 336.3 502.5 557.8 1137.3 782.6 544.9 331.8 128.1 56.8
Source: DBE Annual Report (various years) and DBE (1996).
Table 2h: Development Bank of Ethiopia: outstanding balances of loans and advances by sector (Birr, million)
Before reform
1985/86 1986/87 1987/88 1988/89 1989/90 1990/91
Agriculture 1200.2 1358.3 1582.2 1685.1 1835.2 1887.1
Industry 168.5 170.2 181.2 259.7 328.5 359.2
Housing and construction 23.1 18.8 19.1 19.3 19.7 20.9
Transport and communication 42.7 39.3 39.3 25.5 20.3 17.5
Hotels and tourism 5.8 4.9 5.6 7.2 10.8 20.7
Mines, power and water res. 19 36.9 55.3 75.4 90.2 86.6
Personal 0 0 0 0 0 0
Others 2 0 0 0 0 0
After reform
1992/93 1993/94 1994/95 1995/96 1996/97 1997/98 1998/99 1999/2000 2000/01 2001/02
Agriculture 1966.8 235.2 234.4 475.9 565.9 712.3 897.1 999 1029.8 1052.5
Industry 437.8 530.7 619.7 852.3 959.6 948.1 1126.6 1228.5 1314.4 1358.9
Housing and construction 18.7 18.5 17.8 0 84.7 103.7 130 181.9 204 221.8
Transport and communication 17.5 17.5 15.1 22.9 27.7 26.7 27.5 31.4 33 18.6
Hotels and tourism 38.3 53.1 73.4 111.4 164.9 212 271 179.1 268.4 259.8
Mines, power and water res. 74.8 51 42 36.8 29.9 31.5 23.4 24.5 25.6 26.7
Personal 0 0 2.5 2.5 0 94.6 0 0 0 0
Others 0 2.1 10.4 234.4 104.1 681.1 1020.9 1376.9 1389.7 1503.8
Total 2553.9 908.1 1015.3 1736.2 1936.8 2810 3496.5 4021.3 4264.9 4442.1
Table 2i: Development Bank of Ethiopia: outstanding balances of loans and advances by institutional disaggregation (Birr, million) Before reform 1985/86 1986/87 1987/88 1988/89 1989/90 1990/91 State enterprises 1414.3 1577.3 1811.1 1972.4 2125.2 0 financial sector 0 0 0 0 0 0 non-financial sector 1414.3 1577.3 1811.1 1972.4 2125.2 0 Private sector 47 51.1 71.6 99.8 179.5 0 co-operatives 27.1 29 46.3 69.7 137.2 0
private enterprises and
agencies 19.9 22.1 25.3 30.1 42.3 0 Total 1461.3 1628.4 1882.7 2072.2 2304.7 0 After reform 1992/93 1993/94 1994/95 1995/96 1996/97 1997/98 1998/99 1999/2000 2000/01 2001/02 State enterprises 2,286.0 478.8 477.6 595.7 464.9 405.8 371.8 336.0 321.4 322.7 financial sector 0.0 0.0 0.0 0.0 0.0 0.0 0.0 0.0 0.0 0.0 non-financial sector 2,286.0 478.8 477.6 595.7 464.9 405.8 371.8 336.0 321.4 0.0 Private sector 267.9 429.3 0.0 1,140.5 1,471.9 2,404.2 3,124.7 3,685.3 3,943.4 4,118.5 co-operatives 180.2 210.7 181.5 332.4 322.4 305.7 341.1 368.1 379.5 395.9
private enterprises and
agencies 87.7 218.6 356.2 808.1 1,149.5 2,098.5 2,783.6 3,317.3 3,563.9 3,722.6
Total 2,553.9 908.1 1,015.3 1,736.2 1,936.8 2,810.0 3,496.5 4,021.4 4,264.8 4,441.2
Outstanding loans were a serious problem in the pre-reform period. This problem has eased in the post-reform period, although in 2001/02 their value is estimated to have been 4.4 billion Birr (see Tables 2h and 2i). In terms of sector, the agricultural sector was the most indebted in the pre-reform period. The industrial sector took over from the agricultural sector in the post-reform period, however. In terms of institutional disaggregation, outstanding loans were mainly with the public sector in the pre-reform period. Again the private sector took over from the public sector in this respect in the post-reform period.
The relatively recent phenomenon of high levels of outstanding loans with the private sector needs closer attention. Although complete data on arrears was not available, the level of arrears in the pre-reform period (in particular in the agricultural sector—where the role of state farms was crucial) had reached an alarming level. The arrears which were on average above 75 per cent of total principal outstanding in the pre-reform period declined sharply to nearly 40 per cent in the first two years of the post-reform period owing to the rescue (bailing out) effort by the government (Geda 1999).
In terms of loan collection, the performance of the DBE is not impressive (see Table 2j). However, in the post-reform period the DBE made a good effort to collect its outstanding loans, particularly from the cooperative and private sectors. Other performance indicators of the DBE were not impressive either. For a good part of the period under analysis the DBE was operating at a loss and was in bad financial shape, as can be seen from the change in working capital. The DBE’s total assets were by and large stagnant in the pre-reform period and declined thereafter. In general, since the DBE was operating under the auspices of the central planning organ of the government and relatively exposed to loss making sectors (such as state farms) its performance epitomized the inefficiency in the public sector (Geda 1999). This should be contrasted with CBE, which is a public sector entity, yet performed relatively well—even in financial terms. Thus, the interesting conclusion is that what matters most is probably not ownership but rather exposure (or not) to loss making clients and having (or not) management autonomy.
3.2 The policy regime in the pre-reform period: financial sector and ideology The Derg can be characterized as a controlled regime where all economic activities were based on the directives that came from the central (national) planning organ. To facilitate this, the 1976 reorganization proclamation redefined the role of NBE as a developmental organ, as is clearly emphasized by the infamous Article 6 in the proclamation, which states that the objective of NBE was ‘to foster balanced and accelerated development’. In this period, the NBE was actively involved in the direct control of all financial institutions by (a) fixing both deposit and lending interest rates, (b) directly controlling the foreign exchange and credit allocation which was done in a
Table 2j: Development Bank of Ethiopia: loan collection by sector (Birr, million) Before reform 1985/86 1986/87 1987/88 1988/89 1989/90 1990/91 Agriculture 92.9 64.3 81.2 92 129.4 61.5 Industry 11.7 28.8 28.5 20.8 8.9 17.6 Domestic trade 0 0 0 0 0 0 International trade 0 0 0 0 0 0 export 0 0 0 0 0 0 imports 0 0 0 0 0 0
Housing and construction 0.4 2.3 1.1 1.1 0.7 1.7
Transport and communication 2.7 3.4 0 16.7 6.4 2.8
Hotels and tourism 0.7 0.6 0.9 0.8 0.8 4.2
Mines, power and water res. 0.5 2.5 1.9 2 3.1 3.6
Personal 0 0 0 0 0 0 Others 0.1 0.2 0 0 0 0 Total 109 102.1 113.6 133.4 149.3 91.4 After reform 1992/93 1993/94 1994/95 1995/96 1996/97 1997/98 1998/99 1999/2000 2000/01 2001/02 2002/03 Central government 0 0 0 0 0 0 0 0 0 0 0 Agriculture 39.3 19.6 108.5 162.6 281.3 318.7 200 221.6 162.9 112.6 99 Industry 14.9 31.5 31.6 104 105.3 112 134.1 151 149.2 89.6 114.3 Domestic trade 0 0 0 0 0 0 0 0 0 0 0
International trade 0 0 0 0 0 0 0 0 0 0 0
export 0 0 0 0 0 0 0 0 0 0 0
imports 0 0 0 0 0 0 0 0 0 0 0
Housing and construction 0.5 0.6 0.5 0.3 0.9 4.9 3.7 5.1 6.8 5.7 6.4
Transport and communication 0 0.7 0 2.1 1 0.7 0.9 2 1.9 16.1 0.9
Hotels and tourism 1.7 3.6 3.8 5.7 12.4 15.8 18.9 19.7 23.4 19 15.9
Mines, power and water res. 3.9 4 3.1 13.9 9.3 0 9.3 0 0 0 0
Personal 0 0 0.2 0.2 0 73.2 0 0 0 0 0
Others 0 0 0.4 6.3 14.5 15.2 94.4 58.7 66.2 24.2 54.5
Total 60.3 60 148.1 295.1 424.7 540.5 461.3 458.1 410.4 267.2 291
Table 2k: Interest rate developments in Ethiopia post-1991, %
Deposit rates Lending rates
1 Oct. 1992-31 Aug. 1994
Time deposits
30 days notice
3 months to less than 6 months 6 months to less than 12 months 1 year to less than 2 years 2 years and above Savings deposits 10.5 10.5 11.0 11.5 12.0 10.0 1 Oct. 1992-31 Aug. 1994 Agriculture Industry Domestic trade
Transport and communication Export trade
Import trade (agricultural inputs) Import trade (others)
Hotels and tourism Construction
House: (1) purchase (2) construction Central government
Banks and financial institutions Personal loans 11.0-12.0 13.0-14.0 14.0-15.0 13.0-14.0 13.0-14.0 14.0-15.0 14.0-15.0 14.0-15.0 11.0-12.0 11.0-12.0 11.0-13.0 10.0 14.0-15.0 -
1 Sept. 1994–1 Jan. 1995 1 Sept. 1994–1 Jan. 1995 The same structure as that of
1 Oct. 1992-31 Aug. 1994
Lending to all sectors
Lending to central government NBE lending to:
CB's
other financial institutions international bank lending
14.0-15.0 12.0-13.0
10.5 10.5 10.0 Later developments 2 Jan. 1995 to 30
Nov. 1995 1 Dec. 1995 to 30 May 1996 1 June 1996 to 15 Sept. 1996 16 Sept. 1996 to time of writing* 2002/03 (%)
Minimum interest rate on time and savings deposits
Maximum ( & average) lending rate by commercial banks and other institutions, except for central government
Central government loans
10.0 15.0 12.0 11.0 16.0 12.0 10.0 15.0 12.0 7.0 10.5 12.0 3.56 & 3 13 (10.25)
Note: *since January 1998 the lending rate has been fully liberalized while the deposit rate floor has been set at 6 per cent.
Source: NBE, Quarterly Bulletin 13:1, 1997/98 and NBE Annual Report 2002/03.
discriminatory manner, by favouring the public sector, and (c) directly financing the government deficit (NBE 1998). Bank supervision and regulation was largely limited to the sporadic inspection of a few branches.
The Derg regime is also characterized by an economic policy largely informed by Socialist ideology. The sin qua non of such a set-up is the prominent role accorded to the socialized (public and cooperative) sectors by discriminating against the private sector. During this time indirect ways of regulating the financial sector were not
important because it was directly controlled. The most important financial instruments used to control the sector were (a) the interest rate and (b) discriminatory allocation of foreign exchange and credit. The interest rate was deliberately set at a very low level (repressed). Depending on the degree of socialization, different sectors faced different interest rates. The ruling interest rates for each sector in both (pre- and post-reform) periods are given in Table 2k.
The socialized sectors were accorded priority in credit as well as foreign exchange allocation. All foreign exchange earnings were surrendered to the NBE. The NBE rationed this limited supply of foreign exchange to the sectors that were accorded priority in the national plan. In general the socialized sectors were prioritized—with the private sector the least preferred. Similarly, credit allocation was informed by the same ideological considerations. In consultation with the Ministry of Finance and Planning, the NBE projected the financial planning of the economy. It identified the financial needs of different sectors through surveys and data obtained from credit institutions. Based on such information it determined the distribution of credit, favouring priority investments and aiming to keep the internal and external purchasing power of the national currency unaltered. In credit allocation, financial institutions used credit policy as a factor for strengthening and expanding the socialized sector and encouraging the socialization of others (Di Antonio 1988: 71-72). This favouring of the socialized sector is shown by the fact that a good part of bank resources were directed to the socialized sector (for instance 68 per cent of ADB resources were allocated to state farms) and that collateral was not required from the state farms and cooperatives when they were granted loans (Di Antonio Ibid.: 74). As noted by Di Antonio (Ibid.: 80), this restrictive policy resulted in excess liquidity in the banking sector in the 1980s chiefly because of (a) the biased credit policy, (b) the collateral requirement on the private sector, (c) seasonal trends and the economic conditions prevailing at the time, and (d) the CBE’s inefficiency. The latter two factors were identified by the ‘Liquidity Appraisal Committee’ set-up by the CBE to understand the excess liquidity problem.
4 The structure of the financial system in the post-reform period
Proclamation No. 84/1994 that allowed the private sector (owners have to be Ethiopian nationals, however) to engage in the banking and insurance businesses marked the beginning of a new era in Ethiopia’s financial sector. Following this proclamation the country witnessed a proliferation of private banking and insurance companies. At the time of writing, there were six new private banks (with 115 branches) and eight insurance companies (with 79 branches) in operation. The new private banks account for about a quarter of the total banking capital in the country. This change took place in a matter of ten years. Table 3a gives a list of these financial institutions.
Table 3a: Private banks and insurance companies
Private banks
Date of license No. of branches (2002/03)
Capital (2002/03)* millions of Birr 1. Awash International Bank 10/11/94 26 132 (4.9%) 2. Dashen Bank S.C. 20/09/95 28 122 (4.6%) 3. Bank of Abyssinia 15/02/96 14 141 (5.3%) 4. Wegagen Bank 30/04/97 23 83 (3.1%) 5. United Bank S.C. 10/9/1998 13 91 (3.4%) 6. Nib International 26/5/1999 11 111 (4.2) Private insurance companies
Date of license Number of branches (2002/03) 1. Africa Insurance Co. 22/12/94 9
2. Awash Insurance Co 1/10/94 13
3. Global Insurance 14/1/97 4
4. Nib Insurance 2001/02) 4
5. National Insurance Co. 23/9/94 8
6. Nile Insurance Co. 11/4/95 16
7. Nyala Insurance 27/9/95 11
8. United Insurance Co. 9/11/94 14
Note: *For comparison, the total capital of CBE, DBE and CBB respectively was 1277 (47.7%), 75 (2.8%) and 643 (24%) millions of Birr. Ethiopian Insurance (the only publicly owned one) has 27 branch networks. Source: National Bank of Ethiopia, Annual Report 2002/03 (and various years).
4.1 Performance of the new private banks
Despite the proliferation of privately owned companies, their relative market share was still extremely small. This can be seen from the Tables in this section. Tables 3b and 3c show a summary picture of the share of banks in deposit mobilization (and loan disbursement) in the pre- and post-reform periods. As can be seen from these tables, the dominant position in terms of saving mobilization was held by the public sector in general and the CBE in particular. The public sector’s share did, however, fall from 96 per cent in 1996/97 to 80 per cent in 2002/03. While the share of the private banks rose from 4 per cent to 20 per cent over the two periods. This private sector share was highest for time deposits followed by saving and demand deposits.
A similar pattern is observed in terms of disbursement of loans, loans outstanding, and loan collection. In general, in terms of loan disbursement the share of the public sector (the CBE being the dominant bank, accounting from more than 95 per cent of public banking sector in the figures analyzed in this section, followed by DBE) declined from 93 per cent in 1996/97 to 44 per cent in 2002/03. The share of the private banking sector increased from 7 per cent to 56 per cent. In terms of loan collection the public banks
share declined from 94 per cent to 60 per cent during the two periods, while the share of the private sector increased from 6 per cent to 40 per cent. Outstanding loans were highest in the public sector, being 96 per cent in 1996/97 and declining a little to 82 per cent in 2002/03 (the corresponding figure for the private banks increased from 4 to 18 per cent). In sum, the private banks are catching up relatively quickly with the public banks in almost all banking activities. The disaggregation of disbursed credit by institutional category also shows the increasing role of the private sector which can chiefly be attributed to ongoing liberalization.
A detailed account of each bank reveals that, using the data for the year 2002/03, the most important private banks in terms of deposit mobilization, loan disbursement, and loans outstanding were Dashen Bank, followed by Awash International Bank, placing Abyssinian Bank in the third place (the only exception being that Wegagan Bank is in second place, hence Abyssinia in third, in terms of loan collection and loan disbursement). Clearly the trend of the existing data shows that the share of the private banks—both in terms of deposit mobilization and lending—could increase significantly in the years ahead. It is also worth noting that the share of credit extended to the private sector has increased sharply in the recent past while the public sector’s share has declined (the share of cooperatives remaining fairly stable) (Geda 1999)
Table 3b: Share of deposit mobilization by private and public banks after the establishment of private bank (in per cent)
1996/97 1997/98 1998/99 1999/00 2000/01 2001/02 2002/03 1996/97 -2002/03 Public banks Total deposits 95.8 94.4 91.7 89.4 86.7 83.4 80.4 88.8 demand deposits 97.2 96.9 95.1 94.6 93.6 91.2 89.5 94.0 saving deposits 94.1 90.7 87.7 83.7 79.6 76.5 72.6 83.5 time deposits 95.2 94.5 89.7 84.4 80.2 73.5 66.8 83.5 Private banks Total deposits 4.2 5.6 8.3 10.6 13.3 16.6 19.6 11.2 demand deposits 2.8 3.1 4.9 5.4 6.4 8.8 10.5 6.0 saving deposits 5.9 9.3 12.3 16.3 20.4 23.5 27.4 16.5 time deposits 4.8 5.5 10.3 15.6 19.8 26.5 33.2 16.5
Table 3c: Share of loan disbursed, loan collection, and outstanding balances of banks after the establishment of private banks (%)
1996/97 1997/98 1998/99 1999/2000 2000/01 2001/02 2002/03
Commercial Bank of Ethiopia
loan disbursed 73.4 55.9 57.8 55.7 52.7 48.8 40.6
loan collection 77.7 65.9 65.7 59.8 60.6 57.4 50.4
outstanding 74.0 70.2 67.2 63.9 68.7 66.9 66.8
Development Bank of Ethiopia
loan disbursed 15.0 24.6 19.0 14.2 9.4 3.9 1.4
loan collection 12.3 13.6 11.2 13.2 10.4 7.3 6.6
outstanding 15.1 18.8 20.3 21.2 17.6 17.1 12.9
Construction and Business Bank
loan disbursed 4.8 1.4 0.8 1.0 0.6 1.2 1.7 loan collection 4.0 3.6 4.1 4.1 3.6 3.3 2.7 outstanding 7.3 6.1 5.2 4.2 3.3 2.9 2.7 Public Banks loan disbursed 93.2 81.9 77.6 70.9 62.8 53.9 43.7 loan collection 94.0 83.1 81.0 77.1 74.5 67.9 59.6 outstanding 96.4 95.1 92.7 89.3 89.6 87.0 82.4 Private Banks loan disbursed 6.8 18.1 22.4 29.1 37.2 46.1 56.3 loan collection 6.0 16.9 19.0 22.9 25.5 32.1 40.4 outstanding 3.6 4.9 7.3 10.7 10.4 13.0 17.6
Source: National Bank of Ethiopia, Annual Report 2002/03 (and various years).
Table 3d: Exchange rates (Birr per US$)
Annual average, Birr/US$ 1993/94 1994/95 1995/96 1996/97 1997/98 1998/99 1999/00 2000/01 2001/02 2002/03
1. Official rate 5.09 5.86 6.32 6.47 6.80 8.16 8.26 8.5 8.61 8.64
2. Marginal rate 5.77 6.25 6.32 6.47 6.80
(Sept.)
8.16 8.26 8.5 8.61 8.64
3. Divergence = [1-2] Birr 0.68 Birr. 0.39 unified unified unified unified unified unified unified unified
4. Parallel market 7.05 7.30 7.64 7.16 7.23 8.36 8.79 8.31 8.685 8.71
4.2 Other financial liberalization schemes pursued
Two other important liberalization schemes pursued by the Ethiopian government in the post-reform period were (a) the exchange rate policy, and (b) the introduction of an interbank money market. As discussed in Section 3, the pre-reform period was characterized by discriminatory interest rates and foreign exchange as well as credit allocation policies. At the time of writing the interest rate was fairly liberalized and the NBE has set a floor only for the deposit rate, leaving all other rates to be determined by the market. Banks are now allowed to set any rate within a range. Moreover, pursuant to the strategy of gradualism, the NBE implemented this policy step-by step. Interest rate policy and actual rates at the time of writing, as well as their evolution, are given in Table 2k.
4.3 The exchange rate policy
A related policy of liberalization carried out by the government was the introduction of the ‘auction-based exchange rate’ determination scheme and the introduction of the interbank money market. Again the principle of gradualism (in liberalization) is at the heart of this policy development. The exchange rate reform began by devaluing the currency which was fixed for nearly two decades at Birr 2.07 per US$1 by 140 per cent, to 5 Birr per US$1 in October 1992. Such a massive devaluation was partly justified by the premium on the parallel market that was close to 238 per cent. In 1993 the NBE introduced the auction-based exchange rate system. This used to be conducted on a fortnightly basis and took the form of a ‘Dutch auction’ system (discriminatory price), where the marginal rate, which clears the market, is taken as the ruling rate for the coming two weeks. The supply of funds for this market came from export earnings and loans and grants. The auction-based exchange rate system initially worked side by side with the official exchange rate. The system was overseen by a committee composed of the NBE, Ministry of Finance, Ministry of Economic Development and External Cooperation (MEDaC), and two representatives from the private sector.
In the course of its implementation, an intensification of the liberalization effort— including reducing the bid cover requirement, abolishing of negative import list, and reducing the ceiling on demand for foreign exchange—was made. Moreover, after the 86th auction (in July 1996), the NBE introduced a weekly auction replacing the previous auction system. By August 1995 the official or fixed exchange rate (used for import of fertilizer, petroleum, and pharmaceutical products as well as Ethiopia’s contribution to international organizations and external debt service payments) was also unified with the auction rate. The NBE also replaced the retail auction system by a wholesale auction system where banks are taken as wholesale bidders (discussed below). Table 3d shows the evolution of the official, the parallel, and the auction rates in the recent past.
4.4 The interbank foreign exchange and money markets
The NBE issued directives aimed at establishing interbank foreign exchange and money markets in 1998 (Directives No. IBM/01/1998 and IBM/02/1998). The establishment of this market is primarily motivated by the recognition that the foreign exchange supply by NBE through the auction system is not sufficient to satisfy the demand of banks. The interbank foreign exchange market (IBFEM) is a wholesale market, where the amount traded is large and the spread between buying and selling rates is narrower than the norm for commercial transactions. It is an exclusive market for banks to trade foreign exchange with each other (NBE Directive No. IBM/01/1998). The directive sets various guidelines for the market. For instance, the minimum amount to be traded is US$50,000, banks do not charge each other any fees, and all transactions are conducted in strictest confidentiality. Banks are also required to report their foreign exchange operations to the NBE. Thus, the NBE uses this as one instrument of regulation. It is also gradually liberalizing the market because all these functions used to be handled by the NBE itself. This market is very active, with a volume of daily interbank foreign exchange transactions of around US$160 million in 2002/03.
A related liberalization policy pursued was the establishment of the interbank money market (IBMM). The IBMM describes the borrowing and lending of funds between banks, microfinance institutions, and non-bank financial institutions at interest rates that are freely determined by the borrowers and lenders themselves (NBE Directive No. IBM/02/98). The directive specifies how this market should function. For instance, transactions should be for a minimum of Birr 300,000, there are specific times at which deals and requests for deals should be made, and the nature of collateral required. The directive also requires banks to report all their activities in this market on a daily basis to NBE. The NBE uses this information to regulate and monitor banking activity. Moreover, the NBE has also issued a code of conduct, which has extensive regulatory content (see NBE Code of Conduct for IBMM). Between its establishment in 1998 and the time of writing, only 11 transactions involving 142 million Birr were traded in this market. During this period the average interbank rate stood at 7.8 per cent. According to the NBE Annual Report (2002/03), persistent excess liquidity, lack of collateral, and weak economic activity are given as possible reasons for the poor performance of this market.
5 Concluding remarks
Since 1992, Ethiopia has been gradually liberalizing its financial sector as discussed in this chapter. The hallmark of the strategy is gradualism. This approach, however, is not without problems. The international institutions which sponsor and financially support the liberalization process, especially the IMF, are not satisfied with the pace of liberalization. This has, at times, reached the point where the IMF has temporarily suspended its support.
The various policy framework papers jointly authored by the Ethiopian government and the staff of the two Bretton Woods institutions are quite comprehensive, embracing almost all major polices. Thus, it is difficult to relate any disagreement between Ethiopia and the IMF and World Bank solely to the financial sector. Examination of such policy framework papers reveals that: (a) since the onset of the Structural Adjustment Programme in Ethiopia, the performance has by and large been in line with the target set in the document (there have been occasional years where the performance has been both above and below the target), and (b) when the time schedule set in the policy framework papers and the actual implementation of policies are compared, the Ethiopian government has been behind schedule on many occasions. However, it is interesting to note that this has not usually led to disagreement between the IMF and Ethiopia.
There have been occasions when the IMF has suspended its help. However, an examination of the time schedule set in the policy matrix of the various policy framework papers and the performance of Ethiopia with respect to these targets reveals that if this is the sole cause of disagreement, the IMF should have suspended the programme long ago. This obviously points to the possibility of there being other explanations that are not apparent in the financial data. An informed guess points to at least the following areas of disagreement. First, the World Bank and IMF might disagree with the Ethiopian government’s strategy of gradualism in its reform programme in general, and in reforming the financial sector in particular. Second, the Ethiopian government’s implicit belief in a pragmatic mix between the public and private sectors might have been unacceptable to the IMF and World Bank. Third, the insistence of the IMF and World Bank on the need for competition by addressing the alleged monopoly position of the CBE has been resisted by Ethiopia. This last point is quite sensitive because the Ethiopian banking system may be weakened by any intervention to address the CBE’s supposed monopoly power (such as breaking it up or privatization). This would reduce the Ethiopian banking system’s capacity to compete with foreign banks should they be allowed to enter the market at the same time. Moreover, the CBE’s strong performance does not signal the need for privatization, even unrealistically assuming that privatization is a panacea for such problems (Geda and Addison 2003).
In general, given the nascent level of development in using market mechanisms in Ethiopia, the challenge of transition from the pre-reform period to the post-reform period outlined in this paper, the relatively good shape in which the existing financial institutions find themselves, and the weak supervision and regulation department of the NBE (which is new and lacks skilled human resources), the government’s strategy of gradualism and its overall reform direction need to be appreciated and be supported by World Bank, IMF, and other relevant institutions. The only concession that the government should make is to clearly chart out a time schedule for its financial sector
foreign banks. Obviously the government cannot rationally protect the sector forever, and it is time to recognize this and act accordingly.
References
Degefe, B. (1995) ‘The development of money, monetary institutions and monetary policy (in Ethiopia), 1941-75’, in S. Bekele (ed.) An Economic History of Ethiopia: Volume 1: The Imperial Era 1941-74, Dakar: CODESERIA.
Development Bank of Ethiopia (1996) ‘Credit operation and other activities of DBE: 1970/71-1993/94, condensed statistics’, mimeo, Addis Ababa: Research and Planning Department, Research Division, DBE.
Di Antonio, M. (1988) ‘The excess liquidity of commercial banking in Ethiopia’, African Review of Money Finance and Baking 1/1988: 71-101.
Geda, A. (1999) ‘The structure and performance of Ethiopia’s financial sector in the pre and post reform period: with special focus on banking’, in A. Geda and B. Nega (eds) The Ethiopian Economy: Problem and Prospects, Addis Ababa: Addis Ababa University and Ethiopian Economic Associations.
Geda, A. and Addison, T. (2003) ‘The new financial sector and its regulation: the case of Ethiopia’, in T. Addison (ed.) From Conflict to Reconstruction in Africa, Oxford: Oxford University Press for UNU-WIDER.
Geda, A. and Dendir, S. (2001) ‘Banking Sector Regulation and Performance in Post-Reform Ethiopia’, paper presented at the International Conference on Finance and Development: Evidence and Policy Issues, 10-11 July, Nairobi.
Gedey, B. (1990) Money, Banking and Insurance in Ethiopia, Addis Ababa: Berhanena Selam Printing Press (in Amharic).
McKinnon, R.I. (1973). Money and Capital in Economic Development, Washington DC: Brookings Institute.
National Bank of Ethiopia (1996) Manual for Bank Licensing and Supervision (Unpublished document, April).
National Bank of Ethiopia (1998) ‘Review of the Evolution and functions of Financial Institutions in Ethiopia’, mimeo (Economic Research Department, Money and Banking Division).
Shaw, E.S. (1973) Financial Deepening in Economic Development, New York: Oxford University Press.
Vos, R. (1993) ‘Financial liberalization, growth and adjustment: some lessons for developing countries’, in S. Griffith-Jones (ed.) Financial Policies and Macroeconomic Policies in Transition Economies, London: Macmillan.


![Table 2f: Commercial Bank of Ethiopia: asset quality of the at the end of the fiscal period, June of each year (Birr, million) Year Liquid assets to net deposits ratio [1] Excess liquidity (over the 20% requirement) Liquidity ratio in % [2] Loan t](https://thumb-us.123doks.com/thumbv2/123dok_us/194703.2517717/16.1263.107.1047.213.557/commercial-ethiopia-quality-million-deposits-liquidity-requirement-liquidity.webp)