RFFlow
Professional Flowcharting
5
User’s Guide
© Copyright 1989-2004 by RFF Electronics All Rights Reserved
If you have any questions about the RFFlow software, RFFlow License Agreement, or the Disclaimer of Warranty, contact:
RFF Electronics P.O. Box 1244 Loveland, CO 80539-1244 USA Telephone: 970-663-5767 Fax: 970-669-4889 E-mail: [email protected]
Printed in the United States of America.
The Sentry Spelling-Checker Engine © Copyright 1993-2004 Wintertree Software.
Microsoft, Paint, Word, and Windows are registered trademarks of Microsoft Corporation. Save As GIF and HTML licensed under U.S. Patent No. 4,558,302 and foreign
counterparts. Adobe Acrobat and Adobe PDF are the registered trademarks of Adobe Systems Incorporated.
RFFlow License Agreement
This is a legal agreement between RFF Electronics and you, as the individual, the company, or the legal entity that will be utilizing the RFFlow software. By using the full version of the RFFlow software, you are bound by the terms and conditions of this agreement. If you do not accept these terms and conditions, remove RFFlow from your computer system and return any physical material to the place where you purchased it.
I. GRANT OF LICENSE
When you purchase the RFFlow software, RFF Electronics grants you the right to use the RFFlow software in the manner provided below:
• The RFFlow software is licensed according to the number of concurrent users. This means that the number of licenses purchased allows that number of people to use RFFlow at the same time. For example, the purchase of 6 licenses allows up to 6 people to use the software at the same time.
• The RFFlow software can be installed on individual computers or on a network. The number of installations can exceed the number of licenses owned as long as the number of people using RFFlow at the same time does not exceed the number of licenses owned. For example, you would be allowed to install RFFlow on 20 computers or on a network serving 20 workstations when you own 12 licenses of RFFlow as long as no more than 12 people are using RFFlow at the same time. If your network can monitor concurrent users, then you should check that the number of concurrent users does not exceed the number of licenses owned. If your network does not provide a monitoring capability, then you should periodically estimate the number of concurrent users and purchase additional licenses of RFFlow if necessary.
• A user owning one RFFlow license is allowed to install the software at home, at work, and on a portable computer, as long as only that person uses RFFlow on these computers.
You are in violation of the RFFlow License Agreement if, at any time, the number of people using the RFFlow software exceeds the number of licenses owned. If this occurs, you are obligated to purchase more licenses or to correct the problem immediately.
II. COPYRIGHT
The RFFlow software is the property of RFF Electronics and is protected by United States copyright laws and international treaty provisions. You may be held legally responsible for any copyright infringement that is caused or encouraged by your failure to abide by the terms of this RFFlow License Agreement.
The only times you are allowed to copy the RFFlow software is for installation, backup, or archival purposes. You may not copy the RFFlow software to give to another person or to sell to another person. You may not copy the RFFlow software to any computer bulletin board.
RFFlow is a commercial software program. RFFlow is NOT freeware. RFFlow is NOT shareware.
III. OTHER RESTRICTIONS
You may not loan, rent, or lease the RFFlow software. However, you may transfer your license of the RFFlow software, the media, and any printed materials to another person on a permanent basis provided you retain no copies and the recipient agrees to the terms of this License Agreement. If the RFFlow software is an upgrade, the transfer must include the upgrade and all prior versions.
IV. MEDIA
You may have purchased the RFFlow software on a CD-ROM or by downloading it. You may also have received upgrades to the RFFlow program on CD-ROMs or by downloading. The number of copies or media you have containing the RFFlow program does NOT affect the number of licenses you own. You may not loan, rent, lease, or transfer any extra media to another person except as part of the permanent transfer (as provided above) of your RFFlow software and printed materials.
DISCLAIMER OF WARRANTY
The RFFlow software is sold "as is" and without warranties as to performance or merchantability. Because of the diversity of conditions and hardware under which this program may be used, no warranty of fitness for a particular purpose is offered. Any liability of seller or manufacturer with respect to the function or performance of the RFFlow software will be limited exclusively to product replacement or refund of the purchase price.
Contents
1 Getting Started ... 1
2 Setting Up Stencils... 4
3 Drawing Objects... 12
4 Adding Text ... 17
5 Changing Shape Properties ... 26
6 Viewing Your Chart ... 45
7 Editing Your Chart... 50
8 Using RFFlow with Other Applications ... 59
9 Printing Your Chart... 63
10 Keyboard Shortcuts... 64
1
Getting Started
RFFlow is a graphics program that allows you to easily draw flowcharts, organization charts, and many other kinds of diagrams. You will quickly create professional-looking charts for documents, presentations, or the Web. Sample charts and more information about RFFlow can be found at the Web site www.rff.com.
Registering RFFlow
To register as an RFFlow user, go to www.rff.com/register. Registered RFFlow users are notified via e-mail about upgrades. A small version upgrade (e.g. from 5.00 to 5.01) is free; a large version upgrade (e.g. from 5 to 6) can be purchased at a special upgrade price. The information you give when you register is used solely by RFF Electronics and is never released or sold to others. See our statement on privacy and security at www.rff.com/privacy.htm.
System Requirements
RFFlow Version 5 requires that your system is running Windows 95, 98, 2000, Windows Me, Windows NT 4.0, Windows XP, or any more recent version of Windows. A mouse or similar pointing device is needed. All printers and plotters supported by Windows will work with RFFlow.
Free Technical Support
Technical support for RFFlow is free and unlimited. It is available weekdays during regular business hours. If you have any questions about RFFlow or need assistance, please contact RFF Electronics by one of these methods:
Telephone: 970-663-5767 Fax: 970-669-4889
E-mail: [email protected]
Installing RFFlow
Load the RFFlow CD into your CD-ROM drive. On most systems, RFFlow setup will run automatically. If it does not, click the Start button and then click Run. Next,
type X:\setup.exe into the text box where X is the letter for your particular CD-ROM drive. Your drive may be letter D, E, or F. Click the OK button. The RFFlow setup program will run and it will step you through the installation process. The RFFlow setup program allows you to install RFFlow on a local hard drive or on a network. If you want to remove RFFlow from your computer, run the Control Panel. Then double-click the Add/RemovePrograms icon. Find RFFlow in the list and click on it. Then click the button to remove programs. RFFlow setup will run and you can choose the option to remove RFFlow from your computer.
Running RFFlow
To run RFFlow, click the Start button, AllPrograms, and RFFlow. If you let the RFFlow setup program put a shortcut to RFFlow on your desktop, you can just double-click the RFFlow icon to run the program.
Using RFFlow Help
RFFlow has a complete in-program reference manual, RFFlow Help. It contains the most complete and current information about RFFlow. Click Help in the main menu and RFFlow Help in the drop-down menu. The dialog box that appears has three tabs:
Contents
When you click the Contents tab you see the major topics covered in RFFlow Help. Each major topic is in a book. Double-click a book to see the subtopics. Click a subtopic and click the Display button.
Index
The Index tab lists all the keywords in RFFlow Help. These keywords will assist you in finding the information you need. You can type the first few letters of the word you are looking for, or you can scroll through the alphabetical list of keywords. Once you have found the word, click the Display button at the bottom to read the information.
Find
If you cannot find the information you are looking for using the Index tab, then click the Find tab. The first time you use the Find tab, a word list of all the words in RFFlow Help will be created. Then follow the numbered steps.
Chapter 1. Getting Started 3
There is also a Help item at the bottom of each drop-down menu, and a Help button in each dialog box. These take you directly to a Help topic.
The prompt line , located beneath the toolbars, is helpful to remind you what to do next as you are drawing charts.
Tutorial
For step-by-step instructions on drawing a chart, see the tutorial inside RFFlow Help. Click Help in the main menu of RFFlow and RFFlow Help. Then click the Contents
tab and double-click either Tutorial: Drawing a Flowchart or Tutorial: Drawing an Organization Chart. Click Step 1 and the Display button. The bottom of each step has a link to the next step. The Help text is displayed on the right side of the screen so you can click on the RFFlow buttons and try things out as you read each step.
Free Upgrades
Users of RFFlow 5 can upgrade to the most recent version of RFFlow 5 for free by downloading the upgrade from www.rff.com/upgrade.htm. For example, if you purchased RFFlow 5.00, you can upgrade to 5.01, 5.02, etc. from our Web site as these upgrades become available. The upgrades require that RFFlow 5 is already installed on your hard disk. If you have a network installation, contact RFF Electronics for instructions to download the most recent version.
www.rff.com
RFF Electronics’ Web site, www.rff.com, provides extensive and up-to-date information about the RFFlow software including sample charts, free upgrades, additional shapes, and instructional material on drawing different kinds of charts and diagrams. You can view and print the RFFlow documentation at
Setting Up Stencils
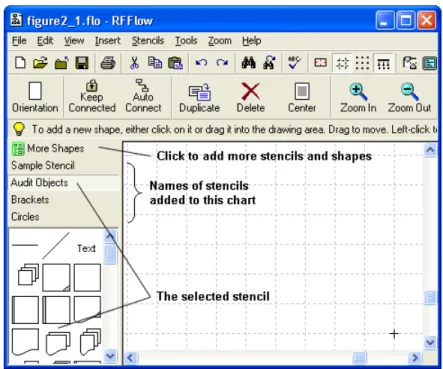
Stencils are groups of related objects that appear on the left side of the RFFlow window. They contain the shapes, lines, curves, and stand-alone text you use in drawing charts. All of the objects included in the RFFlow program can be viewed by clicking the More Shapes
button . They are also illustrated in RFFlow Shapes that can be viewed and printed from www.rff.com/documentation. Its index will help you find specific shapes.
This chapter explains how stencils and their shapes are set up in RFFlow.
Chapter 2. Setting Up Stencils 5
Adding Stencils and Shapes to a Chart
Click the More Shapes button to add stencils and shapes to
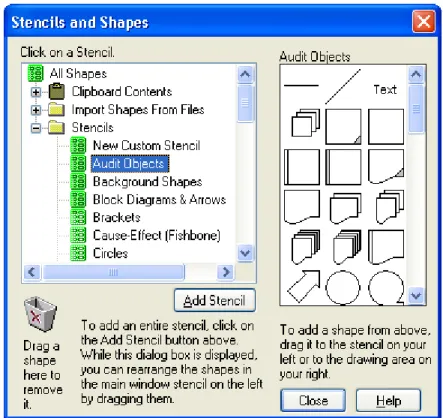
your chart. It is located at the top of the list of stencils. See Figure 2-1. You can also click Stencils in the main menu and Add Stencils and Shapes. Both commands cause the Stencils and Shapes dialog box to appear as shown in Figure 2-2.
Figure 2-2. The Stencils and Shapes dialog box.
First, scroll through the list of stencils on the left to find the name of the stencil or category you want. Items that can be expanded have a plus sign in the box to their left. A minus sign indicates the contents are being displayed. For example, for transistor shapes, click the plus next to Electrical/Electronics to see the Transistor/Diodes
stencil. Once you find the stencil you want, click on it and the shapes in that stencil will appear on the right. In Figure 2-2 above, we clicked on Audit Objects and the shapes in the Audit Objects stencil are displayed. Lines with arrows are in the Lines
The next step is to add the entire stencil or just some of its shapes to your chart. • To add the entire stencil, click the Add Stencil button. The stencil being
displayed will be added to the stencils in the main window of RFFlow.
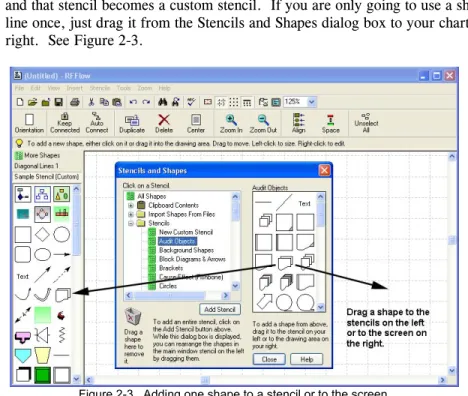
• To add just one shape or line from a stencil, drag it from the stencil on the right in the Stencils and Shapes dialog box to the stencil on the left in the main window of RFFlow. See Figure 2-3. The shape is added to the stencil in the main window and that stencil becomes a custom stencil. If you are only going to use a shape or line once, just drag it from the Stencils and Shapes dialog box to your chart on the right. See Figure 2-3.
Figure 2-3. Adding one shape to a stencil or to the screen.
The stencils and shapes you add to your chart become part of that RFFlow file. After adding the stencils or shapes you want, click the Close button.
Changing the Properties of the Shapes in a Stencil
You can easily change the line width, color, or other properties of shapes in a stencil. To change the properties of one shape in a stencil, right-click on the shape, left-click
Properties in the menu that appears, and make the change. Each time that shape is used in your chart, it will have the new properties.
Chapter 2. Setting Up Stencils 7
To change the properties of all the shapes in a stencil, right-click on the stencil name and then click Properties from the menu that appears. Alternatively, you could left-click on the stencil name to make that stencil the selected stencil, left-click Stencils in the main menu, and Properties of Selected Stencil. These properties include line color, line width, line style (dotted, dashed, etc.), text color, text background, interior fill color, and others. See Chapter 5 for more information about the properties of a shape.
Adding Text of a Certain Font to a Stencil
Most of the stencils have a Text object that is used to add stand-alone text to your chart. You click on the Text object, enter your text, and click the OK button. The default font for this object is the main font. If you use another font often, you can add that font to a stencil. This is useful for setting up large fonts used for titles, or small fonts used for notes.
Suppose you have set the main font to Arial 10-point and you want to type text in Times New Roman 20-point bold for several titles in your chart. Follow these steps: 1. Right-click on the Text object in a stencil and left-click Duplicate in the menu that
appears. You have now added a new Text object to your stencil.
2. Right-click on the new Text object in your stencil and left-click Edit Text. 3. The Edit Text dialog box will now be shown. See Figure 4.1.
4. To describe how this text will be used, change the word “Text” to “Title.” 5. Select the characters you have typed and then change the font and font size to
Times New Roman 20-point. Make the word bold.
6. Click the OK buttonin the Edit Text dialog box or press CTRL + ENTER. Now, each time you click on the new Title object, you will be typing in Times New Roman 20-point bold text.
You can also use this method to set up the font that will be used when you click on a line or shape.
Making a Shape in a Stencil a Fixed Size
If you want to click on a shape in a stencil and have it always be a fixed size, regardless of the amount of text entered, follow these steps:
1. Right-click on the shape in the stencil and left-click Properties in the menu that appears. The Shape Properties dialog box will be displayed.
2. Go to the Shape tab and click Display the shape in a fixed size.
3. Click on the Width and Height up-down controls to choose the size you want. Each unit is one grid point or the average width of a character in the main font. 4. If you want to enter text into this shape each time you click on it, make sure there
is a check mark on Show the Edit Text dialog box. 5. Click the OK button.
Now when you click on this shape, or drag it into your chart, it will always remain the size you set up. You can only set the size of shapes to be fixed, not lines or curves.
Deleting Stencils and Shapes
To delete a stencil from your chart, right-click on its name and left-click Delete this Stencil in the menu that appears. Figure 2-1 shows where the names of the stencils in the RFFlow window are located. You can delete all the stencils at once by clicking on
Stencils in the main menu and Delete All Stencils. Deleting stencils removes them from your RFFlow file.
To delete an individual shape from a stencil, right-click on the shape and choose Delete
in the pop-up menu.
If you just want to hide your stencils temporarily, click Stencils in the main menu and remove the check mark from Show Stencil Window. You can also press the F10 key.
Chapter 2. Setting Up Stencils 9
Rearranging Shapes in a Stencil
To rearrange shapes in a stencil, click the More Shapes button
to bring up the Stencils and Shapes dialog box. You can only move shapes around in stencils with this dialog box displayed. Just drag the shapes to move them around in the stencil. There is no way to rearrange the order of the stencil names, short of deleting them and adding them in a certain order.
Making a Custom Stencil
To make a custom stencil, first click the More Shapes button . The Stencils and Shapes dialog box shown in Figure 2-2 will appear. Click New Custom Stencil at the top of the list of stencils and then click the Add Stencil button. You will be asked to give your stencil a name. Now you can add shapes and lines to your stencil. If you want a circle in your custom stencil, click the Circles stencil and drag a circle from the right side of the Stencils and Shapes dialog box to your new stencil on the left of the RFFlow window. You can add any of the RFFlow shapes to your new stencil. You can also add clip art from the Windows Clipboard or from files. The shapes can be rearranged in your custom stencil by dragging them to a new
position. Click Close in the Stencils and Shapes dialog box when you have loaded all the shapes and lines you need.
Pasting Clip Art into an RFFlow Stencil
If you want to include a clip art picture in RFFlow from another Windows application, first copy the artwork to the Windows Clipboard in the other application. This is usually done by selecting the picture and clicking Edit and Copy. Now, if you want the picture to be part of your chart, and don’t need to use it over and over, you can just paste it into your chart. Simply click Edit and Paste in RFFlow. However, if you are going to use the picture often, you should put it into a stencil. First click on the stencil's name to make it the selected stencil. Then click the More Shapes button
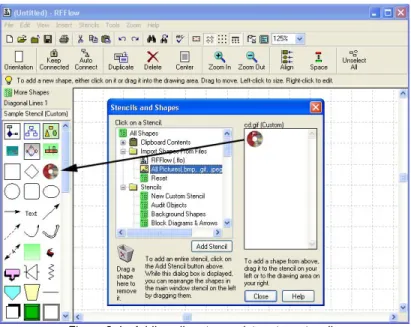
. The Stencils and Shapes dialog box shown in Figure 2-2 will appear. Double-click Clipboard Contents. Finally, click Bitmap, Metafile Picture, or Text, depending on which form you want the Clipboard data. The clip art will show up in the right side of the Stencils and Shapes dialog box. Drag it into your stencil on the left of the RFFlow window. Figure 2-4 shows where the clip art will appear and where you will drag it.
Adding Pictures from Files to a Stencil
Picture files in several formats can be added to a stencil. RFFlow imports JPEG, GIF, BMP, WMF, and EMF files. First click the More Shapes button
. In the Stencils and Shapes dialog box that appears, double-click Import Shapes From Files and click All Pictures (.bmp, .gif, .jpeg, .wmf, etc.). Next you will be shown the Open dialog box that allows you to browse and find the file you want. After finding the file, click the Open button. The contents of the picture file will be displayed in the right side of the Stencils and Shapes dialog box. Drag the shape into your stencil on the left of the RFFlow window. If you are adding several pictures, one after the other, you have to click the Reset item
between each picture. See Figure 2-4.
Figure 2-4. Adding clip art or a picture to a stencil.
Another way to add pictures is to click Insert in the main menu of RFFlow and
Picture From File. You will be asked if you want the picture placed in a stencil or in your chart. If you put it into a stencil, it will end up at the bottom of the selected stencil.
Chapter 2. Setting Up Stencils 11
Adding a Stencil from another RFFlow File to a Chart
If you want to take a stencil from an RFFlow file and add it to your chart, click the
More Shapes button . Then double-click Import Shapes From Files and click RFFlow (.flo). The Open dialog box will appear and you can browse to find the RFFlow file that has the stencil you want. After finding the file, click the
Open button and select the stencil. Clicking the OK button loads the stencil to the Stencils and Shapes dialog box. To add it to your chart, click the Add Stencil button. If you are adding several stencils from another RFFlow file, you have to click the
Reset item between each stencil added.
Temporarily Hiding the Stencil Window
Since the stencils take up space on the left side of the screen, you may want to hide them momentarily to view more of your chart. You can do this by clicking Stencils in the main menu and removing the check mark from Show Stencil Window. You can also press the F10 key to show or hide the stencil window.
Changing the Number of Columns in the Stencil Window
When you first run RFFlow, it will display stencils with three columns of shapes. You may want only one column if your stencil only has a few shapes. Click Stencils in the main menu and Change Number of Columns Displayed.
Loading a Default Set of Stencils
You can choose which stencils are displayed when RFFlow runs. First, you need to set up the stencils the way you want them. The stencils are saved with every RFFlow file so you may be able to open an existing file to get the desired stencils. Or, you can follow the instructions in this chapter for adding stencils to your chart. When you have your stencils set up, click Stencils in the main menu and Make the Current Stencils the Default Stencils for New Charts. Every time RFFlow runs or after clicking on
File and Close, these stencils will be loaded. You can also load these default stencils by clicking Stencils in the main menu and Load the Default Stencils. Doing this will overwrite your current stencils.
Renaming a Stencil
The names of the stencils you are using are listed on the left of the RFFlow window. See Figure 2-1. To change the name, right-click on the stencil name and then click
Drawing Objects
The word object is the collective name for any shape, line, curve, or stand-alone text. All the RFFlow objects are organized in stencils. The previous chapter explains how to set up the stencils. This chapter tells you how to use the stencils to add objects to your chart.
Drawing Shapes
It is very easy to add shapes to your chart. You can click on shapes or drag them into your chart. The prompt line tells you what to do at each step.
Clicking:
1. Click on the shape in a stencil.
2. Type your text in the Edit Text dialog box and click OK.
3. The shape will appear in the center of the screen and will be selected. Drag it to move it. Click outside any shape to unselect all shapes.
Dragging:
1. Drag a shape from the stencil to the drawing area. 2. Type your text in the Edit Text dialog box and click OK.
3. Drag the shape to a new location if needed. Click outside any shape to unselect them all.
You may want to enter text in some objects and not in others. You can change the property of an object that controls whether the Edit Text dialog box appears by right-clicking on the object in the stencil. Click Properties in the pop-up menu. The Shape Properties dialog box will appear. At the bottom left of the Shape tab, there are three check boxes that control how a shape acts when you click on it in a stencil. The Show the Edit Text dialog box check box determines if the Edit Text dialog box appears. In general, it pays to set up the shapes in your stencils with the properties you want before starting a chart.
The Shape Properties dialog box has other tabs that allow you to change the characteristics of objects. These are discussed in Chapter 5.
Chapter 3. Drawing Objects 13
Adding Stand-alone Text
Each stencil includes a text object near the top shown with the word Text. It is used for adding text to your chart that is not inside any shape. Just click on Text, type your words, and click OK. This text can be placed anywhere on the chart. It can even overlap other objects.
Drawing Lines
In RFFlow, straight lines that are horizontal or vertical are represented in a stencil by a horizontal line . Diagonal lines are represented in a stencil by a diagonal line
. To draw a line, you can either click on the line or drag it.
Clicking:
1. Click on the line in a stencil.
2. Move the mouse pointer to where you want the line to start in your chart and press down on the left mouse button.
3. Drag the mouse pointer to the end of the line and release the left mouse button.
4. Repeat steps 2 and 3 to draw more lines.
5. When you are finished drawing lines, click the button Click here when you are finished drawing lines.
Dragging:
1. Drag the line from the stencil into your chart.
2. For straight lines that are vertical or horizontal, you decide the direction of the line by clicking in the picture that appears. For diagonal lines, drag the handles to change the direction.
3. Drag the handles to change the line's length. Drag the center of the line to move it.
Clicking on a line in a stencil puts you into line drawing mode, so you can keep drawing a lot of lines. If you choose to draw lines this way it is advantageous to place all your shapes first, and then draw all the lines at once. Dragging lets you add just one line at a time, but allows for quick editing of the line. With dragging, you can draw a shape and then a line, and so forth. The prompt line beneath the toolbars will remind you what to do next.
Normally, the grid will be enabled so that the starting and ending points of the line will jump to the nearest grid point. This makes it easier to draw lines, since you don’t have to point the cursor precisely. You just have to be within a grid point away. Click
Zoom In to make the objects and grid distance appear larger. If you need to shorten or lengthen a line, get out of line drawing mode and left-click on the line. Then drag the handles to change the line's length. The length of the line in grid units is displayed in the prompt line. You can move a line by dragging the center of the line to a new position.
To add text to a line or change its properties, right-click on the line. If you find yourself changing the properties of lines often, you should right-click on the line in the stencil and change the properties there.
RFFlow includes many lines with different arrow styles. These are located in the
Lines stencils. Click the More Shapes button and then scroll and open the Lines item. The stencils are arranged in alphabetical order.
Drawing Curves
Clicking:
1. Click on the curve in a stencil.
2. The curve appears in the center of the screen. Drag the middle of the curve to move it. Drag the handles to change the curvature or length of the curve.
Dragging:
1. Drag the curve from the stencil to where you want it in your chart. 2. Drag the center of the curve to move it. Drag the handles to change the
curvature or length of the curve.
To change the curvature or length of a curve, left-click on it and drag the handles. To move a curve, drag the middle of the curve to a new position. To edit the properties of a curve or to add text to the curve, right-click on it. If you find yourself changing the properties of curves often, you should right-click on the curve in the stencil and change the properties there.
Chapter 3. Drawing Objects 15
Automatically Connecting Two Shapes
Instead of drawing lines yourself, you can have the RFFlow program automatically connect two shapes.
1. Click the Auto Connect button . The Auto Connection dialog box will appear at the top of the screen.
2. Make sure that Shape to Shape is chosen. 3. Click on the first shape. It will be selected.
4. Click on the second shape. A line will be drawn to connect the two shapes. 5. Repeat steps 3 and 4 until all shapes are connected.
Basically, once you have clicked the Auto Connect button, you can click on any two shapes and they will be connected. This is a fast way to draw a flowchart.
With Shape to Shape checked, you can click anywhere inside the shapes. The program will determine the route the line takes. This is handy for flowcharts, but sometimes you need to have more control over where the lines start and end. If you choose Side to Side in the Auto Connection dialog box, then you can click where the line should start on the first shape and where the line should end on the second shape. Of course, you can always draw your own lines and that gives you the most control.
Changing the Auto Connector
Before connecting two shapes automatically, you may want to change the automatic connector. Click Tools in the main menu, Auto Connect, and Change the Auto Connector. The Select a New Line or Curve dialog box appears. Click on a stencil, click on a line or curve, and click OK. You will then see another dialog box where you can choose the line’s color, width, and style. This line will now be used in auto connection. You can also change the auto connector by clicking the Change Auto Connector button in the Auto Connection dialog box. You can have only one automatic connector at a time. It can be any line or curve. The auto connector is saved with the file. After changing the auto connector, you have the opportunity to make the new auto connector the default auto connector when RFFlow first runs.
Drawing Custom Shapes
There are two ways to make custom shapes for RFFlow. One way is to use the
about RFShape, click Help in the main menu of RFFlow and RFFlow Help. Choose the Index tab, type in RFShape, and click Display. The second way to make a custom shape is to combine the shapes, lines, and curves of RFFlow. Follow these steps:
1. Draw the shape using the shapes, lines, and curves in RFFlow. If you need to draw lines and curves that do not end on grid points, disable Snap to Grid
.
2. Select the objects you have drawn. Either click Edit, Select All or drag the mouse drawing a selection rectangle around the objects.
3. Right-click on any of the selected objects. In the pop-up menu that appears, click Add to Stencil.
4. A dialog box will ask you to name your custom shape.
5. After typing the shape's name, click the OK button and the shape will appear at the bottom of the currently selected stencil.
6. You can now click on your custom shape or drag the custom shape to your chart. The objects will be selected so you can move them into position. After placing the custom shape, click outside of any object to unselect all objects. Your custom shape is really composed of a combination of shape and line objects. These objects remain selected as a group when you move your custom shape to its final location in your chart. When you unselect them, the custom shape reverts back to its individual object components. If you draw a custom shape using RFShape, your custom shape is a true shape. It will stay connected and can be filled and rotated. Stencils are always saved with an RFFlow file. If you want this stencil with the custom shape to show up when RFFlow first runs, click Stencils in the main menu and Make the Current Stencils the Default Stencils for New Charts in the drop-down menu.
4
Adding Text
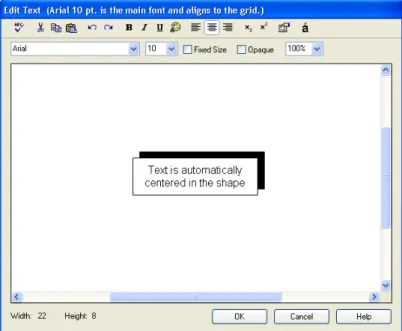
In RFFlow, all text is entered and edited through the Edit Text dialog box. This dialog box functions like a word processor. It allows you to choose fonts, change character formatting (bold, italic, underline, subscript, superscript, tabs, text color), use special characters, align lines of text, check spelling, and do Clipboard operations. This chapter explains how to use the Edit Text dialog box.
Figure 4-1. The Edit Text dialog box.
There are three ways to display the Edit Text dialog box:
• Right-click on an object and choose Edit Text in the pop-up menu. • Double-click on an object.
• Click on any object in a stencil. In this case, the Edit Text dialog box is only displayed if the shape in the stencil has the Show the Edit Text dialog box item checked in the Shape tab of its Shape Properties dialog box. You can change the
properties of a shape by clicking on it with the right mouse button and choosing
Properties. The Shape Properties dialog box is discussed in the next chapter. When the Edit Text dialog box appears, simply type your text and click the OK button. Pressing CTRL + ENTER is equivalent to clicking the OK button. As you type the text, the shape is redrawn around the text and the text is centered in the shape. Numerous editing capabilities are possible and are explained in the following sections.
Selecting Text
To change the properties of text, you must first select it. Selected text is shown in inverse video.
The word sky is selected.
Ways to select text:
• SHIFT + arrow keys to select characters • Drag the mouse over the text
• Click the mouse to the left of a line of text to select the line • Drag the mouse to the left of some lines to select those lines • Double-click on a word to select the word
• SHIFT + END to select the text from the cursor to the end of the line • SHIFT + HOME to select the text from the cursor to the start of the line
Fonts and Font Size
In the upper left of the Edit Text dialog box, a drop-down list box lists all of the TrueType fonts installed in Windows. The Edit Text dialog box works like a word processor. To change the font you have already typed, first select the text and then click on another font. To start typing in a different font, first click on that font. To
Chapter 4. Adding Text 19
the right of the font list is a drop-down list box with point sizes. Point sizes are changed in the same way as fonts.
Each chart you draw has one main font. The main font is noted in the very top line of the Edit Text dialog box. The width of this main font determines the size of the grid in RFFlow and the size of the entire chart. If your main font is a 10-point font and you change it to 20-point, the entire chart will double in size. To change the main font, click Tools, Font, and Change Main Font. You cannot change the main font in the Edit Text dialog box. The main font is the only font that aligns to the grid. You should use the main font if you want to draw lines pointing to your text.
Fixed Size
As shapes size around the text being entered, they increase in fixed units. These units are roughly the width of one character in the main font. The width of this character determines the grid. A shape will always be an integral number of grid units high or wide. The width and height of a shape is displayed in the lower left corner of the Edit Text dialog box. See Figure 4-1.
When you type more text into a shape, the shape gets bigger. If you want a shape to remain a certain size and no longer increase in size, click the Fixed Size check box. Now when you type more text, the shape will not increase in size.
It is possible to adjust the properties of a shape in a stencil so that when you click on it, it will always be a fixed size. First, right-click on the shape in a stencil and click
Properties in the pop-up menu. Go to the Shape tab. Click Display the shape in a fixed size so it has a check mark. Then click on the Width and Height to set the width and height of this shape. Click OK. Now when you click on this shape, it will always be the size you set up.
If you are drawing a lot of charts that use fixed size objects, it pays to spend the time to set up the stencils first. This saves you from repeating the same steps over and over.
Opaque
If the Opaque item is checked, then the area between characters of text is filled with a white color. If the Opaque item is not checked, then the area between characters of text is transparent and shows whatever is behind it. Opaque text is usually used in drawing lines as shown in the example below. This property affects the entire text in the object.
Opaque Transparent
Check Spelling
After typing the text in your object, you can check the spelling by clicking the Spelling
button . If there are any spelling errors, a dialog box will appear to help you correct the spelling. All the text inside this object is checked. To check the spelling of the entire chart, you need to get out of the Edit Text dialog box and click Tools in the main menu and Spelling. Or, click the Spelling button in the main screen toolbar.
Chapter 4. Adding Text 21
Clipboard Cut, Copy, and Paste
The RFFlow Edit Text dialog box supports the basic Clipboard operations of cut, copy, and paste. You may have typed several lines and want to copy them instead of typing them again. Or, you may wish to move text from your object into a word processor document. To copy text, first select it either with the mouse or SHIFT + arrow keys. Then click Copy . The text is placed on the Windows Clipboard. Then move the cursor to the destination location and click the Paste button . The text will be pasted into the new location. Cut works like copy except the text is removed from one place and added to another.
You can use these commands to copy text from your word processor and paste it into a shape. However, the formatting of your word processor will not be transferred. RFFlow takes only ASCII text from the Clipboard and you will need to format it again.
Undo and Redo
If you want to go back to the way the text was before you edited it, click the Undo
button . You can undo the last five changes. If you decide to make the changes again, click the Redo button . Undo moves you back through your changes. Redo moves you forward.
Bold, Italic, and Underline
The Edit Text dialog box has three buttons that control the bold, italic, and underline properties of the text. To change these properties in text you have already typed, select the text either with the mouse or SHIFT + arrow keys. Then click Bold , Italic
, or Underline and the text will change. You can also use CTRL + B for bold, CTRL + I for italic and CTRL + U for underline. To assign these properties to new text, click the buttons before typing the text. These buttons are depressed when enabled, so you can see if they are turned on or not.
Text Color
In RFFlow, you can make words or characters different colors. You can click the
Text Color button and choose a color before typing your text, or you can select existing text and click the Text Color button. See Choosing Colors in Chapter 5 of this user's guide. After changing the color of selected text, you need to click on the text to unselect it and then you will see the color.
Chapter 4. Adding Text 23
Left Aligned, Centered, and Right Aligned Text
Text can be left aligned, centered, or right aligned. Text alignment applies to the entire line of text. To change the alignment of text already typed, first click to the left of the line to select it. To select multiple lines of text, drag the mouse to the left of all the lines. Then click on one of the buttons to set the alignment. To designate
alignment for text that you will type, click on one of the buttons first. The following picture shows the different alignment possibilities.
left centered
right
Text alignment
Subscripts and Superscripts
It is easy to add subscripts and superscripts in RFFlow. In an expression you have already typed, select the character you want to subscript or superscript and click on the appropriate button. If you prefer, you can first click the Subscript or Superscript
Shape Properties
While you are entering and editing text through the Edit Text dialog box, you may want to change the properties of the object. Clicking the Shape Properties button brings up the Shape Properties dialog box. Through it you can change the line width, line style (dotted or dashed), line color, interior fill color, etc. of the object. Chapter 5 covers changing the properties of a shape.
Zoom
If the text you are typing is difficult to see, you can change the zoom. Either click on the zoom box, type a number, and press ENTER on the keyboard, or choose one of the percentages in the drop-down list. Zooming is useful when you are working with very small or very large text.
Chapter 4. Adding Text 25
Special Characters
To type a degree symbol, copyright symbol, or some other special character, click the button. All the characters in the font you are currently using will be displayed in the dialog box that appears. Click on the character you want and click the Add Character button. The special character will be added to the right of the cursor. To see the characters of a different font, click on the font list box, choose a different font, and then click on the character set button. The Symbol font and Wingdings font have a variety of bullets and pictures that you may find useful.
Tabs
You can use tabs to make columns of words in your shape. First make the text left-aligned. Each tab is about two characters in width and cannot be changed.
Tabs help in aligning columns A step 1 text B step 2 text C step 3 text
Changing Shape Properties
Line color, fill color, line thickness, rotation, etc. are all properties of a shape. This chapter explains how to change the properties of shapes, lines, and curves. It goes through each tab in the Shape Properties dialog box. This dialog box is displayed when you right-click on a shape or a group of selected shapes and left-right-click Properties.
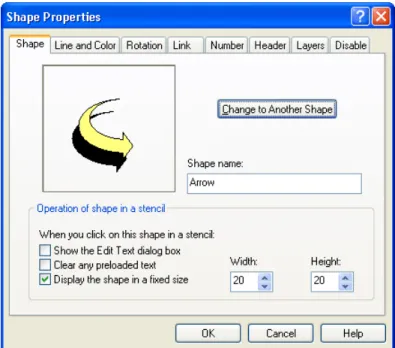
Shape Tab
Right-click on a shape or group of selected shapes, left-click Properties in the pop-up menu, and the Shape Properties dialog box will appear. The leftmost tab is the Shape
tab.
Chapter 5. Changing Shape Properties 27
To change a shape into another shape, click the Change to Another Shape button. To give a shape a different tooltip name, type the new name in the text box beneath the words Shape name:.
The Shape tab of the Shape Properties dialog box allows you to control how a shape acts when you click on it in a stencil. There are three items in the Operation of shape in a stencil section of this dialog box:
Show the Edit Text dialog box
If you want to click on a shape in a stencil and add text to that shape, the Show the Edit Text dialog box item should be checked. This item should be unchecked if you do not want to add text to a shape when you click on it in a stencil. For example, an electronic shape of a transistor would be used without adding text.
Clear any preloaded text
A shape in a stencil can contain text. You may or may not want that text to remain in the shape when it is placed in your chart. For example, you could set up a circle in a stencil that contains the word "Process” and you want this word to remain in the shape when you place the shape in your chart. The Clear any preloaded text item would be unchecked. When this item is checked, the text would be cleared when the shape is put into a chart. There are many instances where you may want this. You may have set up a rectangle with left-aligned text in a stencil and put the word "left" inside this rectangle to remind you that this rectangle is set up for left-aligned text. If Clear any preloaded text is checked, then when you click on this rectangle in the stencil, the word "left" is removed and the text you enter will be left-aligned. As another example, most stencils in RFFlow have a Text object that you click on to type stand-alone text. This object has a check mark on Clear any preloaded text so that when you click on the object Text in a stencil, the word "Text" is cleared for you to type your stand-alone text.
Display the shape in a fixed size
To set up a shape in a stencil to be a fixed size, check the Display the shape in a fixed size item. Then click on the Width and Height up-down controls to set the size of the shape. Each unit is one grid point or the average width of a character in the main font. Each time the fixed size shape is used in your chart, it will be the same size regardless of what text is entered into the shape.
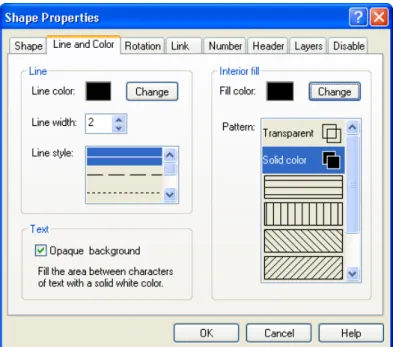
Line and Color Tab
To change the lines and colors of a shape or group of selected shapes, right-click on the shape, choose Properties in the pop-up menu, and click the Line and Color tab.
Figure 5-2. The Line and Color tab of the Shape Properties dialog box.
The Line section of this tab, shown in Figure 5-2, allows you to specify the color, width, and style of the lines in objects. The default width is 2 and the units are in .1 millimeters. A printed line of width 2 would be .2 mm wide. This line width looks good when printed on laser printers. It is best to print a few lines of different widths on your printer to determine the optimum width.
Line width of 2 Line width of 8 Dashed line
A basic rectangle using different line widths and styles.
On the right side of the Line and Color tab in Figure 5-2 is the Interior fill. Shapes can be transparent, filled with a solid color, or filled with several hatched patterns.
Chapter 5. Changing Shape Properties 29
Shapes filled with a solid color allow you to stack them so they appear to be in front of each other. Transparent shapes let the background show through.
Solid Yellow
TransparentTransparent
Rectangles with different fills.
The lower left item in Figure 5-2 controls whether the space between characters of text in your shape is transparent or opaque. This is important for putting text on top of lines. A check mark on Opaque background means the space between characters is opaque and the line behind the text will not show through. The color of the opaque area is white.
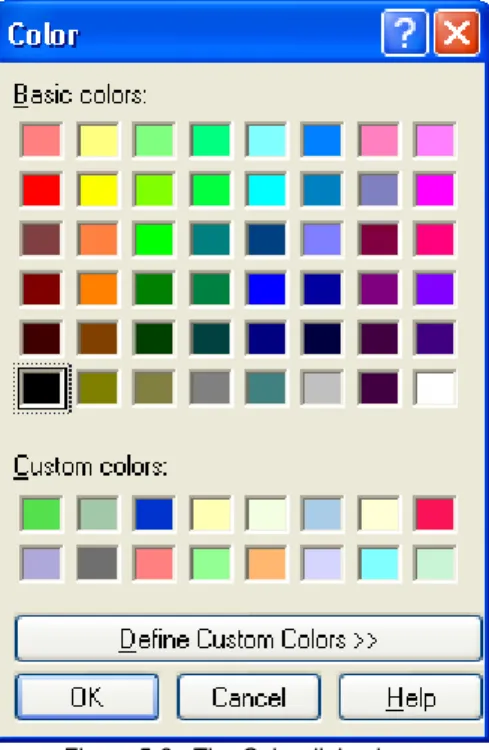
Choosing Colors
Figure 5-3. The Color dialog box.
Choosing a new line color, interior fill color, or text color brings up the Color dialog box shown in Figure 5-3. You simply click on the color you want and click the OK
button.
You can create your own custom colors and shades of gray. Click the Define Custom Colors button and the dialog box of Figure 5-3 will expand. You can move the two cursors to make a custom color. Then click the Add to CustomColors button. In this way you can make up 16 custom colors in addition to the 48 basic colors. You can also type in the numbers directly if you know which numbers are needed for a specific color. The custom colors you make are saved so each time you run RFFlow they will still be present.
Chapter 5. Changing Shape Properties 31
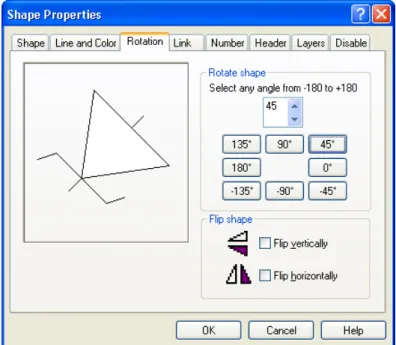
Rotation Tab
Right-click on a shape or group of selected shapes, choose Properties in the pop-up menu, and the Shape Properties dialog box will appear. The Rotation tab shown below allows you to rotate and flip a shape.
Figure 5-4. The Rotation tab of the Shape Properties dialog box.
To rotate a shape, you can choose any angle by clicking on the up-down control in the dialog box in Figure 5-4. Angles range from –180 to +180 degrees. You can also click on one of the buttons if the angle you want is a multiple of 45 degrees. To flip a shape, check the Flip vertically or Flip horizontally items.
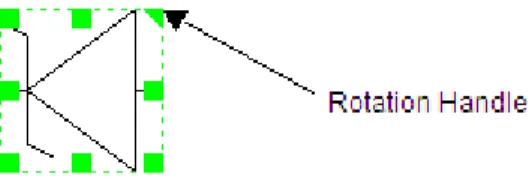
Shapes can also be rotated on the drawing area. Left-click on a shape and the handles will be shown. The upper right handle allows you to rotate a shape. The rotation angle is displayed in the prompt line.
Drag the rotation handle to rotate a shape.
It should be noted that imported bitmaps and metafiles do not rotate. Custom shapes created with RFShape do rotate.
Link Tab
Right-click on a shape, choose Properties in the pop-up menu, and the Shape
Properties dialog box appears. The Link tab shown in Figure 5-5 lets you link a shape to a file or Web page. Then when you click on this shape, it will bring up another chart, document, or Web page.
Chapter 5. Changing Shape Properties 33
Link to File
Each shape can be connected to another chart that has more details of your design. This allows you to build a design hierarchy where more and more details are available. Another use of linking is to have a large amount of text associated with each shape. In that case, you would probably link to Microsoft Word or Notepad. Each shape in RFFlow can be connected to a Windows application and a data file. The Windows application to which you connect a shape can be RFFlow or any other Windows application. The data file must be a file the application understands. When linking a shape to RFFlow, the data file will be a .flo file. If you link to Notepad, then the data file will be a .txt file.
To link a shape to a file, you have to specify the name of the Windows application and the data file. The Windows application is the .exe file. For example, suppose you have a rectangle in a chart that has the text “Fill out order form.” You can link this rectangle to the flowchart that illustrates the steps taken in filling out an order form. Suppose this flowchart is in the file C:\My Flowcharts\Fill Order Form.flo. And suppose RFFlow is installed in C:\Program Files\RFFlow\RFFlow.exe. Box 1 in the dialog box of Figure 5-5 would then read:
C:\Program Files\RFFlow\RFFlow.exe
In box 2, you would type:
C:\My Flowcharts\Fill Order Form.flo
To avoid typing, you can click the Browse button and search for the application you want to run and the data file you want to open. If you have already linked a shape to a file and want to use the last values, there are buttons to use the last executable and last data file.
What you are doing is choosing two files, the executable that you want to run when the shape is clicked on, and the data file which this executable must load when the shape is clicked. You can set up this link while you are creating the shape or later when you edit the shape. If you linked a shape to a text file in Windows Notepad, the executable file would be Notepad.exe and the data file could be Somefile.txt.
You can specify only the executable if you want it to run and not load any data file. You can also specify only the data file, like D:\My Documents\Somefile.doc and let Windows figure out which executable to run.
Making Web Pages with Hyperlinks
1. Leave the top box 1 blank because you cannot predict what browser someone will use to view your Web pages.
2. Type the full URL or an HTML file name into box 2. For example, you could type http://www.rff.com or yourfilename.htm into box 2.
3. Do this for every shape in your chart that you want to link to some Web page. Then click File and Save As in RFFlow and choose HTML. This will create both an HTML file and a GIF file.
4. Upload the HTML and GIF file to your Web site. For more information, click
Help in the main menu of RFFlow and RFFlow Help. Search for .htm in the
Index tab of the RFFlow in-program help.
Window Size
You can also specify how the application window should appear when the linked shape is clicked. When you click on a linked shape, the sub-chart can show up as a full screen, partial screen, or as an icon. Click Normal, Maximum, or Iconic in the
Window size group box of Figure 5-5.
Marking Linked Objects
You can mark which shapes have linked files by clicking the Mark linked objects box. Each linked shape will then have a colored letter L for link in its upper left corner. The color used can be specified by clicking the Change Color button. This colored L shows on the display, but is not printed. All the linked shapes will have the same link color. Even if you don't mark the linked object, the L will show up when you left-click on the object. A marked shape is shown next.
Chapter 5. Changing Shape Properties 35
Opening the Linked File
When the cursor moves over the L in a marked shape, it will change to a hand . If you left-click on the L, the new file or Web page will be opened. If you don’t mark the linked shape so the L is not displayed, you have to click on the object to show the L.
The last item in the Link tab of the Shapes Properties dialog box is the Open the file
check box. If this is checked, the linked file will be opened immediately after you click the OK button.
Numbering Shapes
RFFlow can automatically number shapes in your chart as you draw them. You can choose the font and position of the numbers and decide whether each shape will show its number. The next two sections give details about numbering shapes in your chart.
Shape Numbers for the Entire Chart
To set properties that apply to all the numbered shapes that appear in your chart, you click Tools in the main window of RFFlow and Number Shapes. The dialog box of Figure 5-6 will appear.
Figure 5-6. The Number Shapes dialog box.
This dialog box allows you to set the starting number, renumber the shapes, and choose the font used to display the numbers.
There must be a check mark in Enable numbering for the entire chart for numbers to be displayed. This check box enables or disables the numbering feature. This value is saved in each file. To have numbers enabled when RFFlow first runs, check this item and click Make these settings the default for new charts.
If you click the Renumber All Shapes button, the shapes will be renumbered starting at the starting number specified in this dialog box. The order of numbering is
unchanged. This is helpful to eliminate unused numbers. Suppose you have only three remaining shapes numbered 1, 4, and 7. If you renumber them, with a starting number of 1, the shapes would be numbered 1, 2, and 3.
You can choose the font that will be used for the numbers in your shapes by clicking the Select Font button. The font you choose is saved in the file with the chart. To establish a default font, you need to click Make these settings the default for new charts.
Chapter 5. Changing Shape Properties 37
Number Tab
The Number tab in the Shape Properties dialog box lets you choose the properties of a number in a single shape. Click on a shape with the right mouse button and click
Properties. In the Shape Properties dialog box that appears, click the Number tab as shown in Figure 5-7.
Figure 5-7. The Number tab of the Shape Properties dialog box.
To be able to show numbers on any of the shapes in your chart, you must have a check mark in Enable numbering for the entire chart. If this item is not checked, no shapes will have numbers. This value is saved in the file.
Once you have turned on the showing of numbers, you can decide on a shape-by-shape basis whether a shape should show its number. To show a number in a shape, put a check mark in Show the number of this shape.
The number that will be assigned to a shape is displayed to the right of the words
Shape number:. Each shape is assigned a number one greater than the last number used. You can change this value and choose any number you want. There is no
checking, so you can have two shapes with the same number if you start modifying numbers.
You can display the number in different parts of the shape.
top left top middle top right bottom
left bottommiddle bottomright
1 2
4 5
3
6
For some shapes, you will need to offset the number slightly. This is done in the
Adjust number position box. It lets you move the number small increments horizontally or vertically.
The other way to number shapes is just to type them in yourself like any other text. If you need to have special formatted numbers, like 2.1.2, then you should just enter the numbers as you enter the text. You can make the numbers a smaller font and position them anywhere in the shape.
Header Tab
The Header tab of the Shapes Properties dialog box lets you make any object or group of selected objects in RFFlow a header or footer. The header/footer object can be placed anywhere on page 1 of your chart. Since RFFlow does not differentiate between headers and footers, the word “header” is used in the instructions below.
Any shape, line, or curve in RFFlow can be a header. To make an object a header, right-click on the object on page 1 of your chart, click Properties in the pop-up menu, and go to the Header tab in the Shape Properties dialog box. See Figure 5-8. Then put a check mark in Make this object a header/footer.
Chapter 5. Changing Shape Properties 39
Figure 5-8. The Header tab of the Shape Properties dialog box.
The object that you make a header must be on page 1. Page 1 is the upper left page of a multi-page file. As soon as an object becomes a header on page 1, an image of that object is drawn on all the other pages. Figure 5-9 shows this. When you move the object on page 1, the images move too. You can only edit the header object on page 1. The images on the other pages cannot be edited.
Image
Header Image
Image Image Image Image
Page 1 Image Page 2 Page 3 Page 4 Page 5 Page 6 Page 7 Page 8
Since lines as well as shapes can be headers, you can create your own templates that will be reproduced on each page. You can have as many headers as you like. The text in header objects has some special features. If you type (date), including the parentheses, the phrase (date) will be replaced with the current date. Here are examples of the five words in parentheses that behave this way:
(date) becomes Monday, September 20, 2007
(file) becomes Flowchart.flo
(time) becomes 12:38 PM
(page) becomes 3
(filedate) becomes the date the file was last modified
You must type the words in lower case and include the parentheses. The replacement is only made when the object is displayed on the drawing area or printed.
You can choose to have the header printed on the first page or not. You can display the date in a long format or short format. See Figure 5-8. Windows controls the actual style of the long or short date format. You can change it by running the Control Panel and choosing Regional Settings or Regional and Language Options.
The date format in your chart is saved in each file. If you want RFFlow to start with a certain date format, click Make these settings the default for new charts in the
Header tab. See Figure 5-8.
Layers
Some drawings require shapes to be drawn on separate layers. Then you can show each layer individually or together with other layers. For example, in an industrial drawing, you could assign the structure to one layer, the electrical wiring to a second layer, and the plumbing to a third layer. Then if you want to show the structure with just the electrical wiring, you can enable just the first and second layers. The Layers feature allows you to show some objects and not others.
Layers for the Entire Chart
In the main window of RFFlow, click View and Layers. The dialog box shown in Figure 5-10 will appear.
Chapter 5. Changing Shape Properties 41
Figure 5-10. The Layers dialog box.
The Layers dialog box allows you to choose which layers should be displayed and printed in your chart. If box 2 is checked, then objects on layer 2 will be displayed and printed. When you draw new objects, they are placed on all the checked layers. Layers has nothing to do with objects being in front or behind other objects. The section on stacking order gives information about that. Layers only controls whether objects are displayed and printed or not.
The layers being displayed are saved in each file. If you want RFFlow to start up with designated layers being displayed, click Make these settings the default for new charts in the Layers dialog box of Figure 5-10.
Assigning Objects to Layers
To choose on which layers a shape or group of selected shapes will be appear, right-click on the shape and left-right-click Properties. In the Shape Properties dialog box, click the Layers tab. In the top part of the Layers tab, check the layer(s) on which you want the object to be displayed. See Figure 5-11.
Figure 5-11. The Layers tab of Shape Properties.
When you add a new object to your chart, it is placed on all the layers that are
currently being displayed. The layers being displayed is set up by clicking View in the main menu and Layers.
Stacking Order
Positioning Objects in Front or Back of Others
RFFlow allows you to overlap shapes by positioning shapes in front or behind other shapes. Stacking shapes only applies to shapes that are filled with an interior color. With transparent shapes, it doesn't matter which is in front since you can see through them. To fill a shape with an interior color, right-click on the shape, left-click
Properties in the pop-up menu, and go to the Line and Color tab of the Shape Properties dialog box. Choose an interior color and choose a solid pattern. Now the shape can be stacked.
One way to stack one shape in front of another is to move or edit it. It will be displayed and printed in front of the other objects in the chart. The last object moved or edited shows up in front.
Chapter 5. Changing Shape Properties 43
If you want to make sure that certain objects stay in front of others, you need to set their stacking order. Click on a shape or group of selected shapes with the right mouse button and choose Properties in the pop-up menu. In the Shape Properties dialog box that appears, click the Layers tab. The bottom part of this dialog box, shown in Figure 5-11, controls the stacking order. To change it, simply click on one of the round buttons numbered from 1 to 8. Objects with stacking order 1 are in front. Objects with stacking order 8 are in the very back. The other numbers lie in between. For example, if you have three objects, A, B, and C, and you want A in front, B next, and C behind them all, choose stacking order 1 for A, 2 for B, and 3 for C.
C B
A
Disable Selecting or Printing
At times it is helpful to disable selecting and moving of an object or disable printing of certain objects.
Background Shapes
You may want to make a large background rectangle filled with color and then draw a chart on top of that rectangle. The large background rectangle should be placed on a stacking order of 8 so it is behind all other objects. This works fine until you try to draw a selection rectangle around some shapes. When you click down in the background rectangle to draw the selection rectangle, you end up moving the background rectangle. To avoid this, move the background rectangle into position, then right-click on it, click Properties in the pop-up menu, and go to the Disable tab. See Figure 5-12. Check Disable selecting and moving of this object. Now you can draw a selection rectangle around shapes without moving the background rectangle. If you need to edit the large background rectangle later, right-click on it and remove the checkmark.
Guidelines
You can draw long vertical or horizontal lines on your chart to help in aligning objects. These guidelines are usually made a unique color and style that distinguishes them from the lines in your chart. Guidelines can also be diagonal lines or shapes. You can create as many guidelines as you want. They are like custom grid lines. Guidelines remain in place and cannot be moved the way you move other shapes and lines. They are not printed. To create a guideline, follow these steps:
1. Draw the line.
2. Adjust its position and length.
3. Right-click on the line and click Properties to show the Shape Properties dialog box and choose the Line and Color tab. Make the line a unique color and style. 4. Switch to the Disable tab and click Disable selecting and moving of this object
and Disable printing of this object. See Figure 5-12.
Figure 5-12. Disabling moving or printing.
If you need to temporarily edit a guideline, right-click on it, click Properties and go to the Disable tab. Remove the check marks.
6
Viewing Your Chart
You can show, hide, or customize the components of the RFFlow window. This is done in the View menu of RFFlow.
RFFlow Window Appearance
Figure 6-1. The RFFlow Window Appearance dialog box.
The RFFlow Window Appearance dialog box, shown in Figure 6-1, allows you to quickly show or hide many screen elements. This dialog box is displayed by clicking
View and RFFlow Window Appearance. Checking or unchecking the items will show or hide the toolbars, prompt line, stencil window, center of the page cross, center of the drawing cross, and scroll bars.
Grids and Alignment Marks
To change alignment marks or grids, click View in the main menu and Grids and Alignment Marks.
Alignment Marks
Alignment marks are small red lines on the left, right, top, and bottom of a shape. These marks aid in positioning shapes and lines. They show you the midpoint of each side of a shape. The small marks appear only on the screen and are never printed.
You can also turn alignment marks on or off with the Alignment Marks button .
Grid Lines
You can display a grid of dotted lines on the drawing area to help you line objects up as you draw a chart. Click View in the main menu and Grids and Alignment Marks. Put a check mark next to Show a grid of lines. You can specify the spacing of the lines and the color. Your choice of color will depend on the color of the lines in your chart and the background window color. In general, you want the grid lines to be a light or muted color so they don’t stand out too much. A white screen with light gray grid lines works well. Once you have set up the color and spacing of the grid lines, you can quickly turn them on or off by clicking the Grid Lines button in the toolbar.
Grid Points
Instead of grid lines, you can display grid points to help you align objects as you draw a chart. Click View in the main menu and Grids and Alignment Marks. Then click the Show a grid of points check box. You can specify the spacing between the points that are displayed. This command makes all or some of the grid points visible. When drawing a line in RFFlow, the start and end of the line will always lie on the nearest grid point, even if that grid point is not displayed. The only time this is not the case is when you have disabled Snap to Grid that is discussed in the next section. You can also choose the color of the grid points. Once you have set up the grid point spacing and color, you can turn the grid on and off by clicking the Grid Points button in the toolbar.