University of Cape Town
i
Are South African Directors Able to Earn Abnormal Returns
by Trading In Their Companies Shares?
AMEERA ISMAIL
Prepared under the supervision of Dr Ryan Kruger in fulfilment of the
requirements for the degree of:
MASTER OF COMMERCE IN FINANCIAL MANAGEMENT
University of Cape Town © February 2016
The copyright of this thesis vests in the author. No
quotation from it or information derived from it is to be
published without full acknowledgement of the source.
The thesis is to be used for private study or
non-commercial research purposes only.
Published by the University of Cape Town (UCT) in terms
of the non-exclusive license granted to UCT by the author.
ii
PLAGIARISM DECLARATION
I know that plagiarism is wrong. Plagiarism is to use another’s work and pretend that it is one’s own.
I have used a recognised convention for citation and referencing. Each significant contribution and quotation from the works of other people has been attributed, cited and referenced.
I certify that this submission is my own work.
I have not allowed and will not allow anyone to copy this essay with the intention of passing it off as his or her own work
iii
ABSTRACT
This paper investigates whether South African directors are able to earn abnormal returns by trading in their companies’ shares. An event study methodology was used based on the Capital Asset Pricing Model for director’s trades during the period 2009 to 2012. The results suggest sales transactions are associated with a greater market reaction than purchases. A better market indication is received from indirectly beneficial trades than directly beneficial, specifically for sales. Upon further analysis, we find significantly higher abnormal returns for larger value trades. For purchases, single director trades provide a stronger market reaction than multiple director trades. In contrast, sales transactions provide a stronger signal when they are from multiple directors than single directors.
iv
ACKNOWLEDGEMENTS
I would like to acknowledge the guidance of my supervisor, Dr Ryan Kruger. Your assistance and patience is much appreciated and my submission of this paper is largely owed to you. Thank you to my husband for your understanding and encouragement. I am also deeply grateful to my family for your support throughout my career.
v
TABLE OF CONTENTS
PLAGIARISM DECLARATION ... ii ABSTRACT ... iii ACKNOWLEDGEMENTS ... iv TABLE OF CONTENTS ... vLIST OF FIGURES ... vii
LIST OF TABLES ... vii
1. INTRODUCTION ... 1
2. LITERATURE REVIEW ... 3
2.1 Introduction ... 3
2.2 Market Efficiency ... 3
2.3 International Studies on Directors’ Trading ... 5
2.4 South African Studies on Directors’ Trading ... 11
2.5 Conclusion ... 13
3. DATA ... 15
3.1 Data Sample ... 15
4. METHODOLOGY ... 18
4.1 The Event Study Window Period ... 18
4.2 Estimating Returns Using the Market Model... 19
4.3 Tests of Significance ... 21
4. 4 Data Sub - Samples ... 21
4.4.1 Purchases and Sales ... 21
4.4.2 Direct and Indirect Beneficial Trades ... 22
4.4.3 Transaction Size ... 22
4.4.4 Single and Multiple Transactions ... 22
4. 5 Shortcomings of Event Studies ... 23
5. RESULTS... 25
5.1 Purchases vs. Sales ... 25
5.1.1 Purchases ... 25
5.1.2 Sales ... 26
vi
5.2.1 Purchases ... 28
5.2.2 Sales ... 29
5.3 Transaction Size – Low vs. High ... 30
5.3.1 Purchases ... 30
5.3.2 Sales ... 32
5.4 Single vs. Multiple Transactions ... 33
5.4.1 Purchases ... 33 5.4.2 Sales ... 34 5.5 Summary ... 35 6. CONCLUSION ... 38 6.1 Major Findings ... 38 6.2 Limitations of Study ... 39 BIBLIOGRAPHY ... 41 APPENDIX A ... 45 APPENDIX B ... 56
vii
LIST OF FIGURES
Figure 1: CAARs for Purchases ... 25
Figure 2: CAARs for Sales ... 26
Figure 3: CAARs –Direct vs Indirect Purchases ... 28
Figure 4: CAARs –Direct vs Indirect Sales ... 29
Figure 5: CAARs –High vs Low Transaction Size Purchases ... 30
Figure 6: CAARs – High vs Low Transaction Size Sales ... 32
Figure 7: CAARs –Single vs Multiple Transactions Purchases ... 33
Figure 8: CAARs –Single vs Multiple Sales ... 34
LIST OF TABLES
Table 2.1: Summary of Previous Studies on Directors’ Dealings ... 14Table 3.1: Summary of Directors' Dealings Data..………..16
Table 4.1: Breakdown of SampleSelection….………22
Table 5.1: Director Purchase and Sales - Significance of CAARs ……… 26
Table 5.2: Directly and Indirectly Beneficial Purchases - Significance of CAARs ... 29
Table 5.3: Directly and Indirectly Beneficial Sales - Significance of CAARs ... 30
Table 5.4: High Value vs Low Value Purchases - Significance of CAARs ... 30
Table 5.5: High Value vs Low Value Sales - Significance of CAARs ... 32
Table 5.6: Single vs Multiple Purchases - Significance of CAARs ... 34
Table 5.7: Single vs Multiple Sales - Significance of CAARs ... 35
Table 5.8: Comparison of Market Reaction to Sample Selections ... 35
1
1.
INTRODUCTION
Corporate insiders are assumed to know the most about their company as they are likely to be more aware of when profits are declining, costs increasing etc. (Lakonishok and Lee , 2001). They have intimate knowledge of the operations of a company and have easy access to financial performance data (Hotson, Kaur and Singh, 2007). As a result of their supposed informational advantage, it has been hypothesised that insiders can earn abnormal returns by trading on their knowledge. The public are aware of this and tend to monitor insider trades closely for any hope of also earning an abnormal return. Abnormal returns are measured as the difference between a stock’s performance and the expected return of its benchmark over a certain holding period.
Jeng, Metrick and Zeckhauser (1999) outline three reasons why corporate insider profits should be studied i.e. implications for market efficiency, developing optimal trading strategies and effects of insider profits on fairness and market performance.There have been numerous studies done on abnormal profits earned by corporate insiders and abnormal profits earned by outsiders who imitate insider trades. Most of this research has been done outside South Africa, predominantly in the United States of America (USA) and many in the United Kingdom (UK) and Germany. Insiders are classified differently across countries but all are prohibited from trading on non-disclosed material information. Directors, shareholders holding more than 10% of any equity class and other key employees make up the insider definition in the USA (Lakonishok and Lee, 2001). The slightly more restrictive definition in the UK includes executive and non-executive directors and excludes large shareholders and other key employees (Fidrmuc, Goergen and Renneboog, 2006). In terms of the South African Insider Trading Act, 1998 (South African Government Gazette, 1998), an insider is a director, employee or shareholder who has access to insider information. In South Africa, insider trades refer to the illegal buying or selling of a security by someone that has material non-public information about the security. This study uses the international definition which refers more generally to directors trading in their own companies. This paper investigates whether abnormal profits are earned by directors of South African companies trading in their company’s shares. Johannesburg Stock Exchange (JSE) top 100 companies’ director trades over the period 1 January 2009 to 31 December 2012 were used in this study. The CAPM
2
model was used to estimate the expected returns of the shares over the period. We conducted an event study examining insider trading activity over the period to work out the cumulative average abnormal return for purchases and sales separately. We also split the data by direct/indirectly beneficial trades, high/low transaction size and single/multiple directors’ trades to see if this has any impact on the returns. The CAARs were also tested to see if they were significantly different from zero.
The rest of the study is structured as follows: Chapter 2 reviews the relevant local and international literature on this topic. Thereafter, the data and methodology is discussed in Chapters 3 and 4. A discussion of the results is provided in Chapter 5, after which the conclusion is presented in Chapter 6.
3
2.
LITERATURE REVIEW
2.1 Introduction
The literature review begins by providing an overview of market efficiency and its implications. It is then further divided into studies on director trading done locally and internationally. The majority of studies occurred internationally, predominantly in the United States, as there is limited research on the topic for the South African market.
2.2 Market Efficiency
The random walk hypothesis was developed by Kendall (1953), who proposed that share prices were random and unpredictable. This theory was further enhanced by Fama (1965 b) who developed the Efficient Market Hypothesis (EMH), suggesting that in an efficient market prices reflect all available information. As new information becomes available, the security’s price adjusts immediately to reflect the market’s perception of the securities value. As a result, no under-priced or overpriced securities should exist. Mispriced securities are identified through active investment management. However, if stock markets are efficient then passive active management would be the logical alternative as there will be no need to pay any fees for identifying mispricing when stock prices always reflect the available information.
Fama (1970) alluded to three forms of market efficiency i.e. strong form, semi-strong form and weak form efficiency. Weak form efficiency suggests that current stock prices reflect past prices, whereas semi-strong-form efficiency depicts stock prices to reflect currently available public information in addition to past data (Fama, 1970). Fama then extends strong-form efficiency to include all public and non-public information in stock prices.
The Capital Asset Pricing Model (CAPM), first proposed by Sharpe (1964), embodies the theories of EMH. Portfolios are exposed to systematic and unsystematic risk, whereby unsystematic risk can be diversified away and as systematic risk affects all assets in the market, it can’t be diversified away. If markets are efficient then additional returns can only be earned through undiversifiable risk. Beta measures volatility of a security in comparison to
4
the market as a whole. The CAPM thus states that beta is the only relevant measure of risk and as a result investors can only outperform the market by being exposed to more systematic risk. The CAPM model uses the risk free rate and a market premium for bearing risk, based on the systematic risk exposed to. If all investors have homogenous expectations, Sharpe (1964) showed that all investors will hold a portfolio consisting of a risky asset and risk free assets. The risky asset will be the same for all investors, i.e. the market portfolio. The risk free rate is determined by the investor’s level of risk aversion.
Efficient market theory assumes investors are rational and that a security’s market price reflects all information as it is released. This contradicts with behavioural finance which states that investors frequently behave irrationally. There have been various contributors to behavioural financial theory proposing cognitive biases that restrict investor rationality. Various anomalies have been identified which allows investors to earn abnormal returns. However, supporters of the CAPM have claimed that these abnormal returns are not profitable as one has to still take into account transaction costs.
Strong form market efficiency is inconsistent with the existence of insider profits and it assumes that monopolistic access to information does not cause an individual to have higher trading profits than others (Finnerty, 1976). To test for strong form efficiency, insider profits earned from their transactions need to be compared to that of the general market. Abnormal profits earned by outsiders who mimic insiders’ trades are a violation of the semi-strong form market efficiency. This is considered the “insider trading anomaly” by Dickgiesser and Kaserer (2010). Finnerty (1976) suggested that insiders buy securities of smaller sized companies with larger earnings and larger dividends as abnormal returns are higher for these companies. The cause of the insider trading anomaly could thus be the incorrect estimation of abnormal returns due to the size and earnings/price ratio effects (Rozeff and Zaman ,1988). Non zero abnormal returns that remain after a corporate event are thus considered inconsistent with market efficiency at the semi-strong form level. If markets are efficient in responding to insiders supposed informative trades, then we expect a significant market response around reporting dates (Lakonishok and Lee, 2001).
The analysis of post-event returns provides information on market efficiency. Event studies analyse the behaviour of companies’ stock prices around corporate events (Kothari,2006). Now that a foundation has been provided to illustrate the fundamentals of market efficiency
5
and how event study methodologies can be used to test semi-strong form efficiency, we examine the primary area of the study – director’s trading.
2.3 International Studies on Directors’ Trading
Lakonishok and Lee (2001) examined over one million insider trades on the NYSE, AMEX and Nasdaq during the 1975-1995 period and surprisingly observed little stock price changes around the trade date and even less around the reporting dates. They found that smaller companies are priced less efficiently than large companies and it is thus easier to exploit the insider trading activity. They found abnormal returns were dependent on size for trade dates but not around reporting dates. After adjusting for size and B/M, they found that abnormal returns decreased. Seyhun (1986), who examined 1975 to 1981 US trades, found that directors of small firms earn greater returns than those of large firms. A later study by Dardas and Guttler (2011), found the same result for the 2003-2009 period for various European trades. Hotson, Kaur and Singh (2007) also found abnormal returns for purchases and sales for directors of small companies. Using the Capital Asset Pricing Model (CAPM) to estimate abnormal returns to securities, may lead to biases in abnormal return estimation. Therefore, they use the market model to measure the expected returns as this avoids the CAPM bias.
If small companies see a concentration of abnormal returns, it may be due to the small firm effect (Fama and French, 1992). When companies with small market capitalisation outperformthose with a large market capitalisation after adjusting for risk, this is known as the small firm effect (Banz, 1981). Gregory, Matatko, Tonks and Purkis (1994) examined UK data over the period 1984 to 1986 and found significant abnormal returns in smaller firms. However, over the period investigated, small firms generally outperformed the market index and therefore the size effect could be the reason for the abnormal returns. They foundthat abnormal returns from buy signals become less significant and from sell signals become insignificant after the size effect is allowed for. Contrary to the studies above, in Germany, firms with a larger market capitalisation seem to provide a bigger signal and have lower levels of information asymmetry (Klinge, Seifert and Stehle, 2005).
6
Lakonishok and Lee (2001) discovered higher abnormal returns for purchases than sales and Bettis, Vickrey and Vickrey (1997) found the same, excluding transaction costs, for their 1985 to 1990 US sample. Rozeff and Zaman (1988) found that purchases tend to be concentrated in small stocks and insider sales in large stocks in their 1973-1982 US data. Dardas and Guttler (2011) find that the extent of the announcement effect is higher for purchases than for sales. If stock prices are already overvalued, they are less sensitive to insider trading signals (Dickgiesser and Kaserer, 2010). Rozeff and Zaman (1998) investigated investor overreaction based on US growth and value stock categories over the 1978 to 1991 period. If insiders then do have an informational advantage, they would want to take advantage of mispricing by buying more value stocks and selling more growth stocks. They discover that insiders buy more than sell as more stocks become value stocks. A second finding was that as single securities change from the growth to the value categories, insiders buy more value stocks. Additionally, after stocks experience high returns, insiders sell more. Their findings are in line with an overreaction hypothesis which depicts that prices of value stocks are inclined to lie below fundamental values, and prices of growth stocks likely lie above fundamental values. Interpretations of these findings are that insiders sell to diversify their portfolio because as prices increase more of their capital is tied up in a single share. They suggest insiders hold a greater percentage of growth stocks which is why there is more selling in growth stocks. Their findings propose that insiders are most likely to sell growth stocks as they are less risky and buy value stocks which are more risky.Lakonishok and Lee (2001) suggest that insiders are contrarian and prefer to buy historically good performing value stocks.
Some insiders trade to merely rearrange or diversify their portfolios (Rozeff and Zaman, 1988). Insider purchases are generally made to earn profits, whereas sales could be for many reasons i.e. portfolio reallocation, option exercises, liquidity or because they feel the share price over-values the firm (Nair, 2008). Hamill, Mcilkenny and Opong (2002) investigate the price reactions to insider trades of U.K. small capitalised stocks during the period 1994- 1997. They propose that directors of small companies may be the founders and thus may still have a substantial shareholding compared to the directors of large companies. When they trade it is assumed that it is for the expectation of a positive return in the future and to mitigate future loss. When directors purchase shares it could be seen as confidence in their company’s future
7
as they are unlikely to invest more money if they have negative expectations about the company.
Dickgiesser and Kaserer (2010) and Dardas and Guttler (2011) suggest that larger price reactions are caused by bigger trades. Contrary to their study, Klinge, Seifert and Stehle (2005) found bigger transaction values showed a lower quality of signal. Ajlouni and Toms (2008) examined FTSE100 companies over the 1999-2000 period and found transaction sizes did not increase the signal. Small transactions might be for liquidity needs whereas larger transactions could be the result of analysing a company’s performance (Givoly and Palmon, 1985).They examined a shorter period of US data i.e. 1973-1975.
Multiple trades are found to be a more credible signal to the market, as the price reaction seems stronger when many directors trade on the same day (Fidrmuc, Goergen and Renneboog, 2006) and (Dardas and Guttler, 2011). Ajlouni and Toms (2008) found multiple buy transactions do not make a bigger difference to the signal than does an individual buy transaction. However, for sell transactions they found that multiple transactions increase the signal sent and abnormal return earned. The reason for the difference was suggested as being due to the market being unsure of an individual sale being for personal liquidity needs or for price expectations of the stock. Therefore, subsequent sell trades add some credibility to the motivation behind the sale. Buy transactions do not need the same kind of reassurance as they are usually done with the intention to make a profit.
Lakonishok and Lee (2001) found that trading by managers proved to be more informative than that of large shareholders and they also seemed to be more contrarian than the latter i.e. theypurchase shares when they are being sold by the market and sell shares when they are being bought by the market.They suggest that often executives invest in their companies’ stocks as their compensation schemes are linked to company share performance. Executive compensation structures changed during the period of their study and thus more emphasis was placed on aligning managers and shareholders’ interests. Over time, more of managers’ wealth is likely be in their own stocks and they will have an incentive to diversify their portfolios which will result in sales increases. They find that markets generally do well when they sense positive expectations through directors buying and generally do poorly when they suspect doubt through directors selling. Directors also tend to buy cheap stocks and sell stocks
8
that are not performing well. They conclude that the market under reacts to directors signals. Seyhun (1986) proposed the information hierarchy hypothesis, which states that the information content of the transactions depends on the type of director who trades. Each insider has a different quality of information. They went further to suggest that insiders who are more involved in daily decision-making, such as directors, trade on more valuable information than shareholders. They seem to be more successful in predicting the future stock prices. Further to that, insiders will wait to buy stock until the release of unfavourable information and will sell stock only after favourable information is released. A later study by Dickgiesser and Kaserer (2010) found smaller abnormal returns by the supervisory board and management than directors. Contrary to this, Klinge, Seifert and Stehle (2005) found that trades of members of the supervisory board seem to give a stronger signal than those of directors. Fidrmuc, Goergen and Renneboog (2006) report that in the UK, CEO transactions also result in lower CAARs than transactions made by other insiders. Large firms generally include more non-executive directors which could be a reason why their directors are not as closely involved with the firm and, because large firms are also more public, the share price reaction could also be faster (Gregory, Matatko, Tonks and Purkis, 1994). Top level executives have been found to have a lower abnormal return than other directors (Dardas and Guttler, 2011). A suggested reason for this could be because top insiders are closely watched by regulatory authorities and the public and, as a result, they do not want to attract attention by gaining big returns on their company’s shares. As a disguise they could use multiple small transactions to attract less attention (Givoly and Palmon, 1985). Insiders may also intentionally trade on no information in order to disguise their trading on special information (Jaffe, 1974).
Rozeff and Zaman (1988) assumed a two month reporting delay in their study as information usually takes some time to reach the market. They found that insiders are able to generate an average abnormal return of 3%-3.5% per annum after a 2% transaction cost is imposed. However, any profits earned by outsiders are non-existent after transaction costs. The assumption of 2% transaction costs are relatively low and should it be higher, the abnormal return will be even less. Dickgiesser and Kaserer (2010) examined the German market during the 2002- 2007 period; only since 2002 did it become mandatory to report insider trades in this market. They found that markets adjusted slowly to insider trades which are as a result
9
of high arbitrage risk causing prices to adjust steadily if there are weak arbitrage forces. Their results also show that transaction costs decrease abnormal returns earned. Ben David and Roulstone (2010) in their US study of covering the period 1986 to 2006 and Dickgiesser and Kaserer (2010), found that stocks with high idiosyncratic risk have a bigger abnormal return than stocks with low arbitrage risk. A study by Bettis, Vickrey and Vickrey (1997) reported an abnormal return to outsiders of 6% for a holding period of 26 weeks. Givoly and Palmon (1985) estimated abnormal returns of 8.0% over an 8-month holding period to outsiders. The greater abnormal returns found in their study could be partially due to the fact that their sample consisted of fairly small AMEX-listed companies. They suggest that exploitation by insiders is more likely when disclosure is optional such as management forecasts, disclosure of future plans, etc. than when disclosure is more obligatory e.g., earnings reports or dividends announcement. Gu and Li (2007) found that voluntary disclosure by managers proved to be a useful sign of credibility to outsiders in the US during the 1992 to 1994 period they studied.
Hotson, Kaur and Singh (2007) find that directors’ trades are less profitable in the short run, e.g. one month than over the longer term i.e. in 90 or 160 days in their study of the Australian market during July to December 2005. Dardas and Guttler (2011) and Fidrmuc et al (2006) only examine abnormal returns over short holding periods of 20 days and 5 days respectively. The rest of the prior studies examined both short and long holding period returns. Fidrmuc et al (2006) found abnormal returns of 1.65% and – 0.49% for buys and sales respectively after a 5 day holding period. Ajlouni and Toms (2008) examine abnormal returns with a holding period up to 60 days and found that after 12 days, abnormal returns of 2.84 % could be earned for purchases and -3.43% for sales. After a 52 week holding period, Bettis, Vickrey and Vickrey (1997) found abnormal returns for buy transactions were 11.67% and sale transactions were 8.52%. Klinge, Seifert and Stehle (2005) studied German trades during the 2000-2002 period with holding periods of up to 100 days and found bigger abnormal returns when considering non-overlapping observations.
When companies are in financial distress, their insider sales are seen as an added negative signalDickgiesser and Kaserer (2010). Fidrmuc et al (2006) suggest that insider trading signals are less sensitive to firms in a stronger financial condition. Fidrmuc et al. (2010) also found that market reaction to insider purchases is larger in countries with good corporate
10
governance. Their study covered the 2002 to 2007 period and drew on data from the US and various European countries.
Rozeff and Zaman (1998) propose a few hypotheses. When market prices deviate from fundamental values randomly across all types of stocks, this phenomenon is called the random hypothesis. The overreaction hypothesis is where outsiders overvalue growth stocks and undervalue value stocks.The holdings hypothesis proposes that executives in low CF/P firms generally have larger share holdings which results in more stock sales than in high CF/P categories. They find that insider transactions are not random across growth and value stocks. Their results show that insider buying increases as stocks change from growth to value categories. Insider buying is also shown to be higher after low stock returns, and lower after high stock returns.Eckbo and Smith (1998) estimated returns of insider trades on the Oslo Stock Exchange over the period 1985 to 1992 and found negative abnormal performance and show that on average insiders do not outperform the average mutual fund.
Seyhun (1992) examined US data covering 1975 to 1989 and defined aggregate insider trading as the sum of insider transactions at each point in time across all firms. If the mispricing is across the market, then aggregate insider trading will predict future market profits. They found that insiders in aggregate will buy stock when current prices are too low. On the other hand, when current prices are too high, insiders in aggregate will sell stock. However, if mispricing is firm specific, then each company’s insider transactions will cancel out, and aggregate insider trading should not predict future market returns. Their evidence suggests that changes in business circumstances and movements away from fundamentals add to the information content of aggregate insider trading.
Fidrmuc et al (2006) found differences in regulation between the UK and US. The larger abnormal returns in the UK could be due to the speedier reporting of trades. Directors’ trades in the UK are seen to be more informative and thus may result in bigger market reactions than in the US. In the US, insiders only have to report their trades within the first 10 days of the month afterthe month of the trade (Fidrmuc et al, 2006). In the UK, however, directors must report their trades as soon as possible and by the fifth business day after their own transaction or on behalf of their spouses and children. Given the shorter period for announcement of trades in the UK they expect insider trades in the UK to be more informative compared to the stale information received in the US.
11
Hsieh, Ng and Wang (2005) compared US insider trades to financial analyst recommendations over the 1994 to 2003 period and found that insiders’ trading activities and financial analysts’ recommendations had opposing information signals. They found that insiders trade against the analyst recommendations.When analysts have a negative view of a share, insiders tend to buy more of it than when they are recommended. Surprisingly, they found that analyst’s recommendations were not revised after insider trades.
Many prior studies including Jaffe (1974) analysed intensive trading months, which is the difference between the number of buyers and sellers. Rozeff and Zaman (1988) use an intensive trading criterion which only classifies a buy if at least three insiders buy the stock in that month and if no insiders sell it. The criterion for a sell is if at least three insiders sell the stock and no insiders buy it. This is an attempt to isolate trades truly based on insider information as opposed to other reasons such as diversification.
2.4 South African Studies on Directors’ Trading
Directors of South African companies were only required to disclose their company dealings from 2 October 2002 (JSE Securities Listing Requirements, 2000). As a result there were not many studies done on this topic until more recent years. In South Africa, insider trades become public only once it has been announced on SENS. Directors can only trade in their company’s securities once it has been cleared by the chairperson or other director (JSE Securities Listing Requirements, 2000). They are also not allowed to trade during certain closed periods and when there is material unpublished information available. Directors have to disclose their trades to the JSE within 24 hours. In comparison to the UK and US, insider trading in South Africa can thus be seen to be more informative and likely to trigger a bigger market reaction as the information is reported fresh after the trade date.
Nair (2010) examined JSE data from 2002 to 2008 and found that South African directors earn much lower abnormal returns than international counterparts. Although Nair looked at the top 100 ALSI companies, a few exclusions were taken into account which reduced the sample to 72 companies. Exclusions included amongst others, option trades, restructuring transactions, sales followed by purchase of single stock futures, sale and purchase transactions that had a net effect of zero and only the first trading day of each week was considered (Nair,2010). Nair’s study consisted of 1439 transactions which resulted in
12
significant abnormal returns for purchase and sale transactions. Purchase transactions resulted in immediate positive abnormal returns before going into a negative return until the end of the holding period. This was in contrast to international studies which showed a positive abnormal return. A reason for this difference could be due to Nair only using the first trading day of the week, which might be an opposite direction to trades in the rest of the week. Abnormal returns for sales were negative for the first 47 days before they became positive until the end of the holding period. Although this result is similar to international studies, the magnitude of abnormal returns is much lower. Single director transactions were found to be mostly positive returns throughout the event period. Multiple buy transactions showed negative returns in the first few days, positive in the middle period and a strong negative abnormal return throughout most of the holding period. Multiple sales, however, had a few days of positive returns and a consistent negative return until the end of the event window.
Moodley (2013) used a portfolio time series approach to study director dealings on the JSE between 2002 to 2013. An experimental approach using a style engine was used to find the optimal buy and sell investment style. This optimal style was then tested to see if the returns were larger than the benchmark. The results suggest that outsiders should buy when directors buy and also buy when directors sell.
Mordant and Muller (2003) examined JSE data over the 2000 to 2002 period and found that directors can earn significant abnormal returns by trading in their companies’ shares. Most of the abnormal returns earned by directors were due to market effects such as size, value and resources. When these effects are removed, abnormal returns become fairly insignificant. They discovered that directors earn greater abnormal returns from their sales than buy purchases. This differs to the international studies, which could possibly be due to fewer sales through share option purchase transactions in their sample. Their study also differs in that returns are weighted by initial purchase or sale value as opposed to equally weighted, although the authors indicate that they are uncertain of the full implications of this adjustment on the robustness of the analysis The value of sales transactions were higher than purchases and therefore a greater weighting was placed on sales trades and their performance would be higher. They found no evidence that outsiders can earn abnormal returns by copying directors’ trades. Their study started in 2000 which was when directors
13
were required to start disclosing their dealings, therefore it could be possible that in the first few months not all trades were disclosed due to the newness of the process.
Mordant and Muller (2003) and Nair (2010) both examined directors trades with holding periods from 1 day to 1 year. After 5 days, Mordant and Muller (2003) discovered abnormal returns of 0.6% for buys, compared to 0.33% by Nair (2010). For sales, Mordant and Muller (2003) found abnormal returns of 1.99% and Nair (2010) calculated - 0.11% to be the abnormal return after 5 days.
2.5 Conclusion
Below is a summary of the prior research investigated. All the studies show significant abnormal returns by directors, besides the study by Eckbo and Smith (1998).
Generally, purchases produced a greater abnormal return than sales and higher transaction sizes also resulted in a higher abnormal return. The consensus suggests that multiple buys makes no difference compared to single buys, but multiple sales resulted in higher abnormal returns than single sales.
14 Ta b le 2.1: Su m m a ry o f Pr evi o u s Stu d ies o n Di rec to rs ’ D ea lin gs A ut hor Ye ar C ount ry Sam pl e P e ri od H ol di ng P e ri od M e tho d A bno rm al r e tur n Ins ide r A bno rm al R e tur n Si gni fi cant Re sul ts A jlo un i M . M . and T o m s S. 2008 UK 1999 -2000 up t o 60 da ys Ev ent St ud y M et ho do lo gy C A A R B uy s: 2.84 % C A A R Sal e: -3.43 % af te r 12 da ys Ye s N o d if fe re nc e b et we en m ul ti p le a nd s ing le f o r b uy s, o nl y f o r s al es. Tr an sa ct io n si ze d o es no t m at te r. B et ti s C. , Vi ck re y D a nd Vi ck re y D .W 1997 US 1985 -1990 2 -52 we ek s Ev ent St ud y M et ho do lo gy C A A R B uy s: 11.6 7% C A A R Sal e: 8. 52% af te r 52 we ek s Ye s B uy r et u rns g re at er t ha n fo r s al es D ar da s K. , and G üt tl er A . 2011 Eur o pe 2003 -2009 20 d ay s Ev ent St ud y M et ho do lo gy D if fe rs pe r c o u nt ry exam ine d Ye s La rg er t rad es ha ve b ig ge r r et ur ns Ec kbo and S m it h 1998 G er m an y 1985 -1992 1 -4 m o nt hs C o nd it io na l p o rt fo lio be nc hm ar k a pp ro ac h Ze ro /N eg at iv e No The a ve rag e m ut ua l f un d o ut pe rf o rm s the ins id er po rt fo lio Fi dr m uc J . P ., G o er ge n M . and R enn ebo o g L. 2006 UK 1991 -1998 5 d ay s Ev ent St ud y M et ho do lo gy C A A R B uy s: 1.65 % C A A R Sal e: -0.49 % af te r 5 da ys Ye s M ul ti pl e t ran sa ct io ns m ak e n o d if fe re nc e f o r b u ys bu t fo r s al es the y a re h ig he r G iv o ly D a nd P al m o n D 1985 US 1973 -1975 0 -239 d ay s Ev ent St ud y M et ho do lo gy 8% o ve r 8 m o nt h ho ldi ng p er io d Ye s Tr an sa ct io n si ze d o es no t m at te r Jaf fe J . F . 1974 US 1962 -1968 1, 2 a nd 8 m o nt hs Equ ili br ium p ri ci ng m o de l 8.7% o ve r 1 m o nt h ho ldi ng p er io d Ye s A ft er a dju st ing f o r t ran sa ct io ns c o st , o nl y t he int ens iv e tr ad ing s am pl es wi th 8 -m o nt h ho ldi n g p er io ds h ad a st at ist ic al ly lar ge r e tur n Jo se f L ak o ni sh o k and Inm o o L ee 2001 US 1975 -1995 1, 3, 6 and 1 2 m o nt hs N P R m eas ur e D if fe rs pe r c at eg o ry exam ine d Ye s Sm al l f ir m s g re at er a bn o rm al r et ur n t ha n lar ge f ir m s B uy r et u rns g re at er t ha n fo r s al es M an ag er s re tur n gr eat er t ha n lar ge s ha re ho lde rs Kl ing e , S ei fe rt a nd St ehl e 2005 G er m an y 2000 -2002 up t o 100 d ay s Ev ent St ud y M et ho do lo gy C A A R B uy s: 1.09 % C A A R Sal e: -0.7 % af te r 5 da ys Ye s B ig ge r a bn o rm al r et ur ns f o un d whe n us ing n o n -o ve rl ap pi ng t ran sa ct io ns M o o dl ey 2013 SA 2002 -2013 3 -4 m o nt hs C A G R C A G R B uy : 29.5% C A G R Se ll: 27.8% Ye s O ut si de rs sh o ul d bu y wh en d ir ec to rs bu y a nd b uy whe n di re ct o rs se ll. N M o rda nt a nd C M ul le r 2003 SA 2000 -2002 1 d ay t o 1 ye ar Ev ent St ud y M et ho do lo gy C A A R B uy s: 0.6% C A A R Sal e: 1. 99% af te r 5 da ys Ye s R et ur ns in si gni fi can t a ft er a dju st ing f o r m ar ke t ef fe ct s Sal es gr eat er r e tur ns t ha n pu rc ha se s N ai r D . 2010 SA 2002 -2008 1 d ay t o 1 ye ar Ev ent St ud y M et ho do lo gy C A A R B uy s: 0.33 % C A A R Sal e: 0. 29% af te r 252 d ay s A bn o rm al R et ur ns lo we r tha n int er na ti o na l s tud ie s. R o ze ff M .S and M .A Z am an 1988 US 1973 -1982 1, 3, 6 and 1 2 m o nt hs Ev ent St ud y M et ho do lo gy A ve rag e 8.64% o ve r 12 m o nt hs Ye s P ur cha se s gr eat er r e tur ns in sm al l s to ck s an d sa le s gr eat er r et u rns in la rg e s to ck s Se yhu n H .N 1986 US 1975 -1981 0 -300 d ay s Ev ent St ud y M et ho do lo gy C A A R B uy s: 4.3% CAAR S al e: -2.2 % af te r 300 d ay s Ye s Sm al l f ir m s g re at er a bn o rm al r et ur n t ha n lar ge f ir m s
15
3.
DATA
The following section describes the collection of data, sample selection and sorting criteria implemented.
3.1 Data Sample
The sample used consisted of Johannesburg Stock Exchange (JSE) top 100 share data over the period 1 January 2009 to 31 December 2012. This was taken from a complete list of directors’ trades available on SENS from January 2007 to December 2012. Previous South African studies on directors trading all examined earlier data sets. We decided to exclude the 2007 to 2008 period as this period’s returns would likely be skewed due to the effects of the financial crisis. The reason for the choice of top 100 companies by market capitalisation is that smaller companies have much lower market values and any big trades by directors cause a significant impact on results. In addition, smaller companies on the exchange are plagued by thin trading issues. Since the event study methodology applied for this study relies on daily data returns series, the presence of thin trading could significantly skew the analysis.
Only ordinary shares were used. This study analyses actual purchases and shares by directors based on their expectation of future profits. Options were therefore excluded, as this would usually be for liquidity or diversification needs. Similarly, linked units transactions were excluded from consideration.
Our initial sample consisted of 590 transactions. We then removed any overlapping transactions, consistent with the majority of previous studies done. The use of overlapping data results in biases in CAAR calculations and thus test statistics. Single shares will be correlated if event windows are allowed to overlap, which affects the variance of the CAAR. However, if non-overlapping data is used, then there will be zero covariance between shares and the CAAR calculations won’t have any correlation concerns (Dardas and Güttler, 2011). We employed a 31-day window period representing 10 days prior to the transaction and 20 days post the transaction. Any share transaction that fell within 20 days of the window period of another transaction for the same share was therefore excluded. Our final sample, after removing overlapping transactions, consisted of 436 transactions. Data regarding the
16
transaction date, nature of the transaction (purchase vs. sale and direct beneficial vs. indirect beneficial) and value were all sourced. The sample was made up of 181 purchases and 255 sale transactions. This sample size is considerably smaller than the study by Nair(2008), who had 315 purchases and 1124 sales. In comparison, Mordant and Muller (2003) had a total of 2549 combined purchases and sales transactions. However, these studies did not exclude overlapping transactions.
In South Africa, directors need to disclose the type of share dealing that they trade on. Direct beneficial trades are those where the security is registered in the name of the director and the director has voting rights over the security or the right to receive the dividends in respect thereof (JSE Securities Listing Requirements, 2000).
Indirect beneficial trades are those where the security is not registered in the name of the director but rather through a trust or an investment holding company in which the director holds any or all of the voting rights and/or is a beneficiary of the trust (JSE Securities Listing Requirements, 2000).
Any non-beneficial transactions in the sample were removed from this specific test as it was not felt that they would provide a definite signal to the market regarding a director’s intentions with regard to the transaction.
The relevant data is summarized in the table below.
Table 3.1: Summary of Directors Dealings Data Type of Transaction Total Direct Beneficial Indirect Beneficial Average Transaction Size Single Director Transactions Multiple Director Transactions Purchases 181 120 601 R 4 622 818.77 145 36 Sales 255 207 48 R 5 762 719.95 220 35 Total 436 327 108 365 71
Sample data comprising of the daily total returns (comprising both dividends and price changes) of the top 100 companies listed on the JSE and daily total return index values of the All Share Index (ALSI) were also found. It should be noted that the constituents of the top 100 companies are fluid as the JSE rebalances its indices on a quarterly basis. As such, any share
17
that fell in the top 100 at any point over the sample period (even for just one quarter) was included in the data sample.
18
4.
METHODOLOGY
The aim of this paper is to determine whether buy and sell transactions by corporate insiders send signals which could indicate expectations regarding company performance. As event studies determine the behaviour of firms share prices around corporate events, this method was chosen as the most appropriate. Event studies are a way of testing for market inefficiency as abnormal returns that continue after a corporate event are not consistent with market efficiency (Kothari and Warner, 2006). The size of abnormal performance at the time of an event provides a measure of the impact of the event studied on the wealth of the company’s claimholders (Kothari and Warner, 2006). Short horizon event studies also provide evidence required for understanding corporate policy decisions.
In order to perform an event study, the following steps are required:
Select a window period
Estimate a market model
Calculate the abnormal returns for each share in the sample using the market model
Aggregate these abnormal returns by finding an average for each day across all shares in the sample
Calculate a cumulative average abnormal return in order to measure the incremental abnormal return across the sample for all events of that type
Test if the cumulative average abnormal return is significantly different from zero 4.1 The Event Study Window Period
We conducted an event study using a 31 day window period (days -10 to +20). The directors’ transaction date (time t) is specified as day 0, with the event window extending 10 days prior to announcement (-10) and 20 days post announcement (+20).
The window periods were chosen to allow for examination of the impact of the transactions both prior to and post the event. Short –horizon window periods have been shown to be more reliable as they are well specified, are a powerful method if the abnormal performance is concentrated in the event window and the test statistic is not very sensitive to the
19
assumptions about the return generating process as can be found with long horizon methods (Kothari and Warner, 2006).
4.2 Estimating Returns Using the Market Model
The market model was used to estimate the expected returns of the shares over a certain period. The CAPM, is an equilibrium model stating that the expected returns on an asset are linearly related to the assets exposure to market risk, as measured by beta.
Jaffe (1974) and Finnerty (1976) use variants of the CAPM to estimate abnormal returns to securities. Banz (1981) and Reinganum (1981) found that CAPM based residuals were on average positive for small firms, and negative for large firms. This leads to biases in estimating abnormal returns due to the bias in CAPM residuals. Thus many later studies used the APT model to avoid the CAPM biases.
In unreported results, it was found that there was little significant difference in the results from our analysis when using the CAPM and APT models. This is consistent with the findings for an unrelated event study using JSE data conducted by Kruger and Toerien (2014). For purposes of brevity and simplicity, we therefore work with and report on only the CAPM results.
The market model uses an estimation period, which is the period before the event window that is used to estimate the parameters for calculation of the normal returns. An estimation period of 220 days was used to estimate the market model for each share in the sample. Most prior studies used an estimation window of between 180 to 250 days and this period ensured that there would be no overlap with window periods
The CAPM model is given by:
20 Where:
Ri,t : the daily price returns of share i at time t
RALSI: the daily price returns of the ALSI at time t
αi,t : the alpha for share i,
βi,t : the beta for share i,
εi,t: the abnormal return
The above model was used to regress each share during the estimation period to find the expected return equation for that share. We then used this equation to estimate what the normal return should be during the event window period. The abnormal return was then calculated as the difference between the actual return and the normal return for each share.
The abnormal returns for each share were then averaged across each time period.
AARt = ∑ 𝐴𝑅𝑖,𝑡
𝑁 𝑖=1
𝑁 (1.2)
where AARt denotes the average abnormal return at time t, N indicates the number of
director transactions in the sample and ARi,t is the abnormal return for share i at time t. This
was done to average out the firm-specific elements of return that may still be present in the abnormal return. What should remain is the element that is common to all share windows – the event in question.
Cumulative average abnormal returns (CAARs) are calculated over the event window for both directors’ purchase and sales transactions.
21
where CAAR i (0,t)is the cumulative average abnormal return for each share i included in the
sample over t days of trade. 4.3 Tests of Significance
The statistical significance of the CAARs for each share is computed using a t-test with the following test statistic:
𝑡𝐶𝐴𝐴𝑅 = 𝑁−1∑ 𝐶𝐴𝐴𝑅𝑖 𝑠(𝐶𝐴𝐴𝑅)
√𝑁
⁄
𝑁
𝑖=1 (1.4)
where s(CAAR) is the standard deviation of the cumulative average abnormal returns and N is the number of director transactions in the sample.
The null hypothesis for each test states that the cumulative average abnormal return (CAAR) of directors trades is not significantly different from zero. The alternative hypothesis thus states that the CAAR of directors’ trades is significantly different from zero. A two sided t-test was done at the 5% significance level, as we were interested in any positive or negative abnormal returns.
H0 : CAARt = 0
H1 : CAARt ≠ 0
In order to isolate the impact of various factors on the director’s transactions, the sample was split according to various criteria and the above methodology applied to each sub-sample as discussed below.
4. 4 Data Sub - Samples
Transactions were split and sorted into the following categories: 4.4.1 Purchases and Sales
In order to examine the differences in the impact of purchases and sales transactions on abnormal returns for shares in the sample, the full data sample was first split into purchases
22
and sales transactions. A number of events in the sample comprised multiple transactions by more than one director on the same day and there was a concern that including all such transactions in the analysis would skew the results towards such events. In order to avoid multiple director’s transactions on the same event day skewing the analysis, only the first transaction for each company on a given event day was included in the samples in question. 4.4.2 Direct and Indirect Beneficial Trades
Transactions were then split into direct and indirect beneficial trades for each of the purchases and sales. This resulted in four additional samples for testing – Direct Beneficial Purchases, Indirect Beneficial Purchases, Direct Beneficial Sales and Indirect Beneficial Sales. 4.4.3 Transaction Size
The original sales and purchases samples were then divided into the top, middle and lower third transactions according to size. Anything that fell in the top third category was considered high value and anything that fell into the lower third of transaction values was considered low value. Thus all values in the middle category were excluded. The high and low values were separately tested for abnormal returns, for both purchases and sales, resulting in four more samples – High Value Purchases, Low Value Purchases, High Value Sales and Low Value Sales. 4.4.4 Single and Multiple Transactions
Finally, the original transactions samples were split into single and multiple transactions. Single transactions occurred where only one director traded on each share’s trade date in our sample. Multiple transactions occurred where more than one director traded. This was done for purchases and sales separately, as above, resulting in four samples – Single Purchases, Multiple Purchases, Single Sales and Multiple Sales.
23 Table 4.1: Breakdown of Sample Selection
Year Transactions Purchases Sales Direct Beneficial
Indirect Beneficial
Avg. Purchase
Size Avg. Sale Size
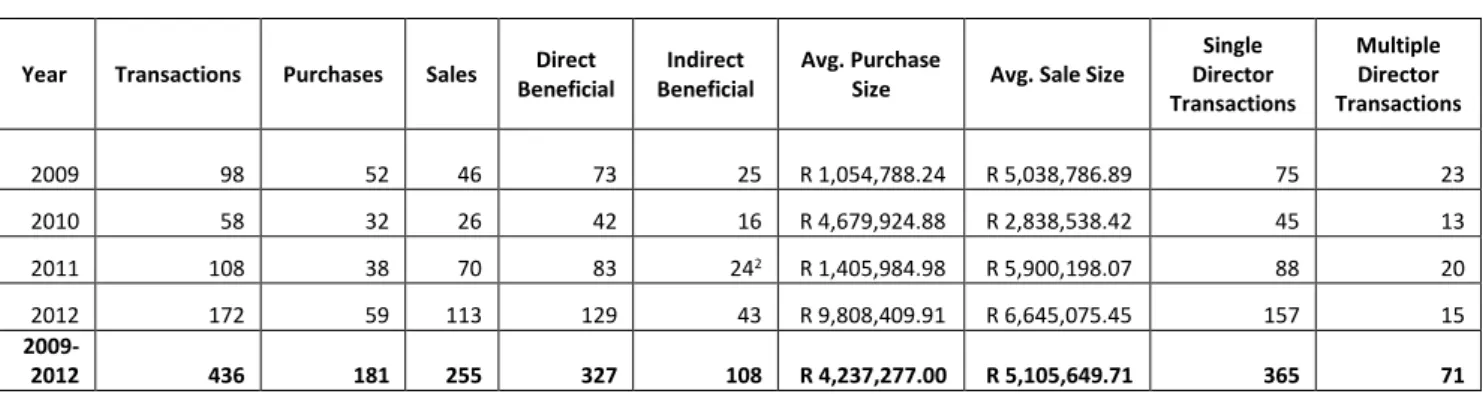
Single Director Transactions Multiple Director Transactions 2009 98 52 46 73 25 R 1,054,788.24 R 5,038,786.89 75 23 2010 58 32 26 42 16 R 4,679,924.88 R 2,838,538.42 45 13 2011 108 38 70 83 242 R 1,405,984.98 R 5,900,198.07 88 20 2012 172 59 113 129 43 R 9,808,409.91 R 6,645,075.45 157 15 2009-2012 436 181 255 327 108 R 4,237,277.00 R 5,105,649.71 365 71
From Table 4.1 above it can be seen that over the four year period there were generally more sales than buy transactions and the average transaction size was also higher for sales. The South African study by Nair (2008) also consisted of more sales transactions than purchases, with sales accounting for 78% of the sample. However, most of the international studies had a higher number of purchases to sales, but the average transaction size for sales was higher. Directors have a really good reason when they sell, and if due to poor expectation, they would withdraw as much of their investment as possible to avoid losses. Most of the transactions were directly beneficial as expected, because directors are more actively involved in the company. There was a huge spike in transaction volume and average purchases size in 2012. During 2012, the JSE was on a rise, which could explain the higher volume, particularly for purchases. Lastly, the majority of the trades on a given day were by a single director as shown by Nair (2008) as well. Single director transactions are thus more evident as, for sale trades, reasons for selling are usually director specific. Multiple transactions will be more prevalent when a clear consensus on expectation is found.
4. 5 Shortcomings of Event Studies
Although the event study methodology is the most appropriate for the nature of this study, it has a few limitations.
Firstly, there is the problem of the joint test for event studies whether abnormal returns are
24
zero and if the market model used is correct. The choice of market model used is therefore an important consideration. This study used the CAPM model as was used by many of the earlier studies.
Secondly, long horizon returns tend to be right-skewed. This creates skewness in the bias of the test statistic. Therefore, this study used a short horizon event window. Thirdly,
specification bias from cross-correlation in returns remains a serious issue. We overcame this bias by using a short horizon as this bias is more evident in long horizon event studies.
25
5.
RESULTS
This chapter discusses the empirical findings of the study. Results are summarised for each of the sub-samples the data was sorted into, as per Section 4.4.
5.1 Purchases vs. Sales
CAARs for the sample of purchases and sales are graphically depicted below in Figures 1 and 2.
5.1.1 Purchases
Figure 1: CAARs for Purchases
CAARs for purchases decline and remain negative from 10 days before the event until event day, reaching -0.6% on event day. They then start increasing and reach a maximum of 0.51% on day 9 after which they start decreasing. By day 20 they have stabilised close to 0. Directors seem to purchase shares at very low values on day 0, which then climbs steeply suggesting that they purchase stock before the release of favourable information. The negative returns prior to the event, suggests that they tend to refrain from purchasing stock until after unfavourable information is released. Abnormal returns are high post event date, possibly due to an increase in market sentiment as a result of directors apparent faith in future
-0.80% -0.60% -0.40% -0.20% 0.00% 0.20% 0.40% 0.60% -10 -8 -6 -4 -2 0 2 4 6 8 10 12 14 16 18 20 CAA R 's Days
CAAR's - Purchases
26
earnings of their company. This positive sentiment persists for almost two weeks following the trades before the markets start adjusting back to normality and abnormal returns become closer to 0. As the SENS announcement is usually a few days after the event date, abnormal returns only become positive from day 3 onwards. Possible reasons for insiders buying are because they see great future potential, the share is undervalued or possible M&A activity. The CAARs for purchases are slightly higher than those found by Nair (2010). From the above graph, a CAAR of 0.49% is found after 10 days, whereas Nair (2010) found 0.28%.
5.1.2 Sales
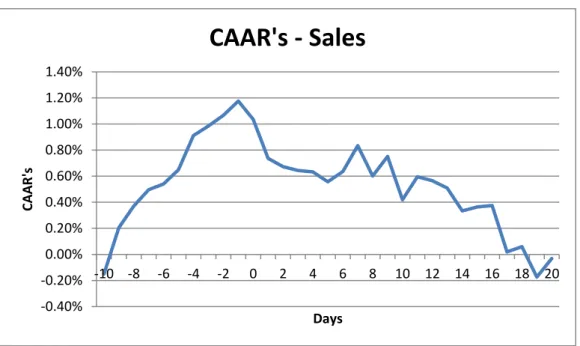
Figure 2: CAARs for Sales
For the sales transactions, abnormal returns are mostly positive throughout the event window although there is a clear negative trend after the event day. We see a sharp increase in CAARs over the 10 days prior to the event, reaching a maximum of 1.18% the day before the event. From day -1 returns start declining until the end of the event window where it approaches 0. Directors thus sell at the highest value prior to the release of unfavourable information. They also refrain from selling until after favourable information is released. The sharp increase before event day suggests directors had insightful information prior to their trade as they traded when share prices were at their highest. The decline after event day can
-0.40% -0.20% 0.00% 0.20% 0.40% 0.60% 0.80% 1.00% 1.20% 1.40% -10 -8 -6 -4 -2 0 2 4 6 8 10 12 14 16 18 20 CAA R 's Days
CAAR's - Sales
27
be explained by the negative market sentiment by investors after seeing directors sell shares in their company which they could see as a distress signal. This brings prices down. It must be remembered that the data sample was filtered to exclude inconsequential transactions such as director’s reorganising their portfolios or exercising options and so these sales transactions are likely to send a strong signal to the market.
For sales, abnormal returns decrease after the event day, compared to the increase seen by purchases. Contrary to expectations, director sales cause a higher market reaction than purchases. We expect sales to have a lower reaction because of the various reasons directors sell other than just expectation of poor future earnings. However, CAARs are much higher for sales than purchases during the event period. Directors are rational investors who sell at what they believe to be the highest share value. They are thus selling strategically to avoid future losses when the share price declines. The CAARs for sales are higher than those found by Nair (2010). After 10 days, a CAAR of 0.42% is found above and Nair (2010) found 0.31% when their sales multiplication by -1 is ignored.
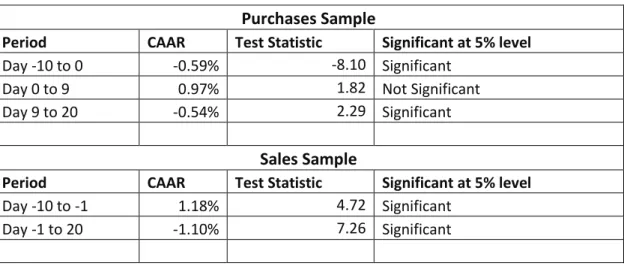
Table 5.1: Director Purchases and Sales - Significance of CAARs Purchases Sample
Period CAAR Test Statistic Significant at 5% level
Day -10 to 0 -0.59% -8.10 Significant
Day 0 to 9 0.97% 1.82 Not Significant
Day 9 to 20 -0.54% 2.29 Significant
Sales Sample
Period CAAR Test Statistic Significant at 5% level
Day -10 to -1 1.18% 4.72 Significant
Day -1 to 20 -1.10% 7.26 Significant
CAARs for director purchases are not significant for the 9 days after the event. From days 9 to 20 the decline in CAARs are significant. Returns for director sales are highly significant at the 5% significant level throughout the event period.
28 5.2 Direct vs. Indirect Beneficial Trades 5.2.1 Purchases
Figure 3: CAARs –Direct vs Indirect Purchases
The graphs of the CAARs for both directly and indirectly beneficial purchases largely mirror the graph for the combined sample of all purchase transactions. Abnormal returns are negative for the 10 days prior to the event for both directly and indirectly beneficial purchases. For directly beneficial purchases, a sharp increase is seen on day -1, whereas for indirect beneficial, a sharp increase is seen on day +2. Returns for indirectly beneficial purchases increase till about day 6 when they reach their maximum and then start stabilising before decreasing again. Returns for directly beneficial trades flatten out at about day 4, which might be due to new market information and thus the reaction of the director’s trade phasing out. From day 13, returns start their decline back to zero. Abnormal returns of indirect beneficial trades are generally larger which is contradictory to our expectation of greater reaction to directly beneficial trades which are done for the director’s personal benefit. A reason for the lower returns of directly beneficial trades could be due to the awareness that directors have of their trades being closely watched, thus they are cautious in their insider trades.
-1.50% -1.00% -0.50% 0.00% 0.50% 1.00% -10 -8 -6 -4 -2 0 2 4 6 8 10 12 14 16 18 20 CAA R 's Days
CAAR's - Direct vs Indirect Purchases
Direct Beneficial Indirect Beneficial
29
Table 5.2: Directly and Indirectly Beneficial Purchases - Significance of CAARs Directly Beneficial Purchases
Period CAAR Test Statistic Significant at 5% level
Day -10 to -1 -0.59% -5.51 Significant
Day -1 to 5 0.79% 0.02 Not Significant
Day 5 to 20 -0.45% 5.51 Significant
Indirectly Beneficial Purchases
Period CAAR Test Statistic Significant at 5% level
Day -10 to 2 -0.60% -5.79 Significant
Day 2 to 6 1.01% 1.03 Not Significant
Day 6 to 20 -0.95% 1.56 Not Significant
No meaningful deductions can be made for directly beneficial returns immediately after the event date as the results are insignificant. The market assumes less insider knowledge associated with the director’s purchase. However, returns are significant from day 5 to 20. Abnormal returns of indirect beneficial trades are more volatile, with the only significant return being on days -10 to 2.
5.2.2 Sales
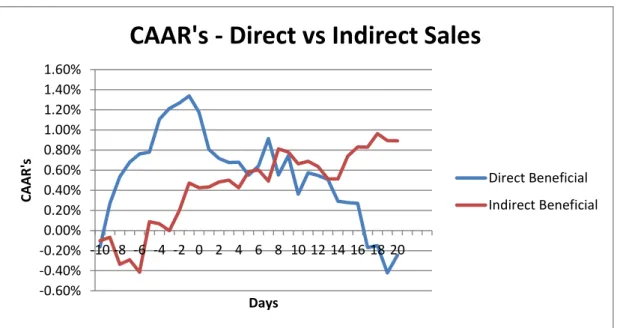
Figure 4: CAARs –Direct vs Indirect Sales
Interestingly, only the directly beneficial sales sample demonstrates CAARs similar to that of the overall sales sample. The indirectly beneficial sales sample has a markedly different CAAR
-0.60% -0.40% -0.20% 0.00% 0.20% 0.40% 0.60% 0.80% 1.00% 1.20% 1.40% 1.60% -10 -8 -6 -4 -2 0 2 4 6 8 10 12 14 16 18 20 CAA R 's Days
CAAR's - Direct vs Indirect Sales
Direct Beneficial Indirect Beneficial
30
profile. Direct beneficial sales’ abnormal returns increase from days -10 until -1 and then start decreasing from day -1 until the end of the event window. Abnormal returns from indirect beneficial sales remain negative until day -6 when they start increasing until the end of the event window. Day -1 is when abnormal returns of directly beneficial trades are the highest at 1.34% and start their decline throughout the rest of the event window. Prior to this, CAARs experience a sharp increase from day -10. There is no clear trend in the indirectly beneficial graph as returns seem to increase and decrease randomly. Indirectly beneficial shares are being sold when the stock market is on the rise, which is irrational and could indicate that these trades are not executed with sufficient knowledge to be able to time the trades. From days -10 to 0, there is an increasing positive return on direct sales, which is as a result of the share price increasing. Directors thus wait till the share price is at its highest on day -1 before selling.
Table 5.3: Directly and Indirectly Beneficial Sales - Significance of CAARs Directly Beneficial Sales
Period CAAR Test Statistic Significant at 5% level
Day -10 to 0 1.18% 5.75 Significant
Day 0 to 20 -1.58% 5.00 Significant
Indirectly Beneficial Sales
Period CAAR Test Statistic Significant at 5% level
Day -10 to 0 0.43% 0.96 Not Significant
Day 0 to 20 0.42% 0.00 Significant
Returns for directly beneficial sales trades are highly significant at the 5% significant level throughout the event period.
Indirect sales do not directly involve the director and thus less market emphasis is placed on these trades, resulting in no significant effect during days -10 to 0. However, results for indirectly beneficial sales are significant from day 0 to 20.
5.3 Transaction Size – Low vs. High 5.3.1 Purchases
31 Figure 5: CAARs –High vs Low Transaction Size Purchases
Abnormal returns for high purchase values remain positive and stable until event day when they start increasing. For low transaction values, however, the abnormal returns are negative and start decreasing from the event day. Low transaction values seem to have a converse effect, by incurring a decreasing negative abnormal return after the event day. The market thus has a negative market reaction to low valued purchases. The market sees large buys as a credible signal, resulting in positive abnormal returns. We expect the market to have a strong reaction to higher valued purchases as the more capital directors are committing, the greater risk they are taking on which means they should be expecting substantial reward to compensate for this.
Table 5.4: High Value vs Low Value Purchases - Significance of CAARs High Value Purchases
Period CAAR Test Statistic Significant at 5% level
Day -10 to 1 0.19% 7.71 Significant
Day 1 to 7 1.51% 5.58 Significant
Day 7 to 20 -0.22% 30.52 Significant
Low Value Purchases
Period CAAR Test Statistic Significant at 5% level
Day -10 to 0 -1.23% -5.46 Significant
Day 0 to 20 -0.41% -23.94 Significant
High and low sized purchases results are statistically significant throughout the event period. -2.00% -1.00% 0.00% 1.00% 2.00% 3.00% -10 -8 -6 -4 -2 0 2 4 6 8 10 12 14 16 18 20 CAA R 's Days
CAAR's - High vs Low Transaction Size
Purchases
High Low
32 5.3.2 Sales
Figure 6: CAARs – High vs Low Transaction Size Sales
Low transaction valued sales increase from days -10 to -1 and they then start decreasing. They experience a sharp decrease from day -1 to +1. High transaction values increase until the event day when they start slightly stabilising.
If directors are selling due to company performance, they could disguise this by having a few smaller transactions as opposed to one big transaction which might be an alarm signal to the market. Therefore, this will be classified as low transaction values, but will in fact be one large trade by a director. As discussed by Givoly and Palmon (1985), low value transactions could merely be for liquidity needs whereas large values could be based on company performance expectations.
Table 5.5: High Value vs Low Value Sales - Significance of CAARs High Value Sales
Period CAAR Test Statistic Significant at 5% level
Day -10 to 0 1.10% 3.92 Significant
Day 0 to 20 -0.38% 17.98 Significant
Low Value Sales
Period CAAR Test Statistic Significant at 5% level
Day -10 to 1 0.37% 5.83 Significant
Day 1 to 20 -1.38% 1.64 Not Significant
-1.00% -0.50% 0.00% 0.50% 1.00% 1.50% 2.00% -10 -8 -6 -4 -2 0 2 4 6 8 10 12 14 16 18 20 CAA R 's Days
CAAR's- High vs Low Transaction Size
Sales
High Low