The Effect of Voluntary Environmental
Disclosure on Firm Value
-
A Study of Nordic Listed Firms
By Henriette Schiager and Guro Dingsør Haukvik
Advisor Francisco Santos
Bergen, June 15
th2012
Master Thesis in Financial Economics
N
ORWEGIAN
S
CHOOL OF
E
CONOMICS
This thesis was written as a part of the Master of Science in Economics and Business Administration at NHH. Neither the institution, the advisor, nor the sensors are - through the approval of this thesis - responsible for neither the theories and methods used, nor results and conclusions drawn in this work.
Abstract
This paper empirically investigates the relationship between voluntary environmental disclosure and firm value. The analysis is based on a sample consisting of Nordic listed firms disclosing environmental information to the Carbon Disclosure Project in 2007 -2011. We investigate the impact of disclosure on firm value from both an accounting and a market perspective. We provide evidence of a significant, positive association between the level of voluntary environmental disclosure and Tobin’s Q. Furthermore, we find that firms with improved disclosure from one year to the next experience abnormal excess return. Firms with stable or aggravated disclosure do not yield the same result. This implies that voluntary environmental disclosure is value-relevant for stakeholders, and has a positive impact on firm value.
Keywords: Carbon Disclosure Project, Voluntary Environmental Disclosure, Firm Value, Stock Returns, Tobin’s Q, Fama/French Benchmark Factors
Preface
This paper concludes our major in financial economics at the Norwegian School of Economics. The project gave us an opportunity to work in depth on a topic of our choice over a full semester; a process which have been both challenging and rewarding.
Embarking on this thesis, we were motivated by the on-going debate on the value relevance of corporate social responsibility, and ended up examining the relation between voluntary disclosure of such activities and firm value. Settling on the final hypotheses was a long and dwelling process due to obstacles and uncertainties connected to obtaining data. Finding comparable measures for disclosure proved challenging, and we had to restrict our scope to only environmental disclosure. The subject of research is fairly new, and we hope that this thesis may provide insight in this relationship in the context of Nordic listed firms.
We would like to thank our supervisor Francisco Santos (NHH) for valuable comments and discussions. He has given us freedom and flexibility to define our own thesis and provided helpful guiding along the way. While thankful for all the help we have received, all remaining errors are our own.
This thesis is the final part of our Master of Science in Economics and Business Administration. We would like to take this opportunity to express gratitude for five outstanding years at NHH, and we want to thank friends and family for great support throughout the years.
Bergen, June 15th 2012
Contents
ABSTRACT ... 2 PREFACE ... 3 CONTENTS ... 4 1. INTRODUCTION ... 6 2. LITERATURE REVIEW ... 10 3. HYPOTHESIS DEVELOPMENT ... 15 4. METHODOLOGY ... 17 4.1 ANALYTICAL APPROACH ... 174.2 ENVIRONMENTAL DISCLOSURE AND FIRM VALUE ... 18
4.2.1 Pooled OLS regression... 18
4.2.2 Fixed effects model ... 19
4.3 ENVIRONMENTAL DISCLOSURE AND STOCK RETURNS ... 20
4.3.1 Portfolio returns ... 20
4.3.2 Factor model regression ... 21
4.4 DATASET ... 24
4.4.1 Carbon Disclosure Project ... 24
4.4.2 Data description and sample selection ... 25
4.4.3 Data adjustments ... 26 4.4.4 Portfolio construction ... 27 4.4.5 Variable description ... 30 4.4.6 Factor construction ... 34 5. EMPIRICAL ANALYSIS ... 38 5.1 SUMMARY STATISTICS ... 38
5.2 POOLED OLS REGRESSION ... 40
5.2.1 Effect of disclosure initiative on firm value ... 40
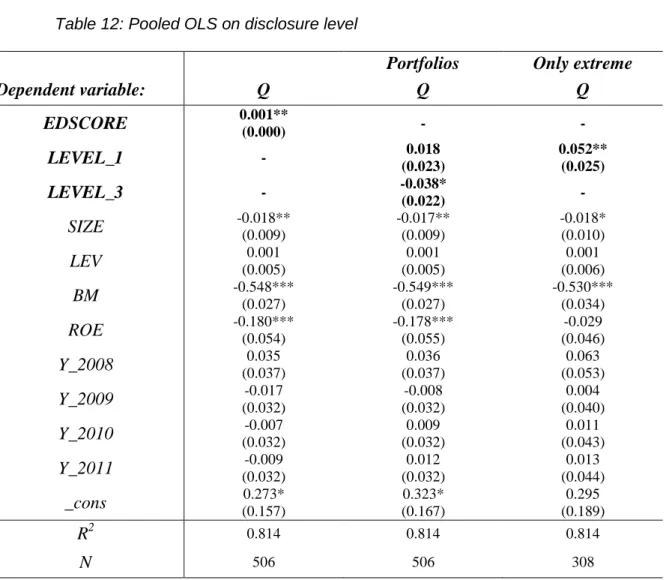
5.2.2 Effects of disclosure level on firm value ... 41
5.2.3 Effects of changes in disclosure on firm value ... 45
5.3 FIXED EFFECTS REGRESSION ... 48
5.3.1 Fixed effects on absolute disclosure level ... 48
5.3.2 Fixed effects on disclosure changes ... 50
5.4 PORTFOLIO RETURNS ... 53
5.4.1 Disclosure level portfolios ... 53
5.4.2 Disclosure change portfolios ... 54
5.5 FACTOR MODEL REGRESSIONS ... 56
5.5.1 Disclosure level and stock returns ... 56
5.5.2 Disclosure change and stock returns ... 58
6. RESULTS AND DISCUSSIONS ... 62
6.1 ENVIRONMENTAL DISCLOSURE AND FIRM VALUE ... 62
6.2 ENVIRONMENTAL DISCLOSURE AND STOCK RETURNS ... 63
6.3 LIMITATIONS AND SUGGESTIONS FOR FURTHER RESEARCH ... 65
7. CONCLUSION ... 66
REFERENCES ... 67
APPENDIX 1: LIST OF CDP NORDIC SCORES ... 70
APPENDIX 2: OUTLYING OBSERVATIONS ... 72
APPENDIX 3: LIST OF SUSTAINABILITY WEBSITES ... 73
TABLES
TABLE 1:SAMPLE DESCRIPTION ... 26
TABLE 2:NORDIC SAMPLE DISTRIBUTION... 27
TABLE 3:DISCLOSURE SAMPLE DISTRIBUTION ... 27
TABLE 4:DISCLOSURE LEVEL PORTFOLIOS ... 29
TABLE 5:DISCLOSURE CHANGE PORTFOLIOS ... 30
TABLE 6:FIRM VALUE VARIABLES ... 31
TABLE 7:DISCLOSURE VARIABLES ... 32
TABLE 8:CONTROL VARIABLES ... 33
TABLE 9:CORRELATION BETWEEN NORDIC AND EUROPEAN FACTORS ... 37
TABLE 10:SUMMARY STATISTICS ... 39
TABLE 11:POOLED OLS ON DISCLOSURE INITIATIVE IN NORDIC SAMPLE ... 41
TABLE 12:POOLED OLS ON DISCLOSURE LEVEL ... 42
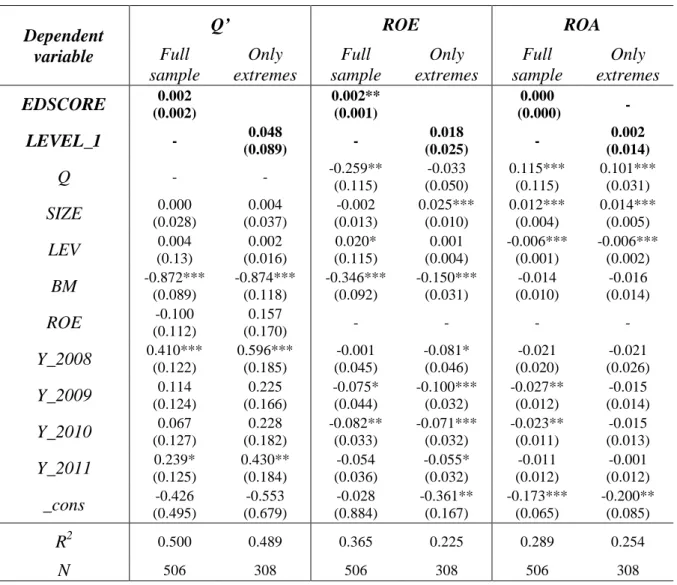
TABLE 13:DISCLOSURE LEVEL -ALTERNATIVE PROXIES FOR FIRM VALUE ... 44
TABLE 14:POOLED OLS ON DISCLOSURE CHANGE ... 45
TABLE 15:DISCLOSURE CHANGE -ALTERNATIVE PROXIES FOR FIRM VALUE ... 47
TABLE 16:FIXED EFFECTS OF DISCLOSURE LEVEL ... 48
TABLE 17:FIXED EFFECTS OF DISCLOSURE LEVEL ON ALTERNATIVE VALUE PROXIES ... 50
TABLE 18:FIXED EFFECTS ON DISCLOSURE CHANGE ... 51
TABLE 19:FIXED EFFECTS OF DISCLOSURE CHANGE ON ALTERNATIVE VALUE PROXIES ... 52
TABLE 20:THREE-FACTOR MODEL OF DISCLOSURE LEVEL PORTFOLIOS ... 57
TABLE 21:FOUR-FACTOR MODEL OF DISCLOSURE LEVEL PORTFOLIOS ... 58
TABLE 22:THREE-FACTOR MODEL WITH DISCLOSURE CHANGE PORTFOLIOS ... 59
TABLE 23:FOUR-FACTOR MODEL WITH DISCLOSURE CHANGE PORTFOLIOS ... 60
TABLE 24:GLOBAL INDUSTRY CLASSIFICATION STANDARD ... 75
FIGURES FIGURE 1:SMB/HMLPORTFOLIOS ... 35
FIGURE 2:MOMPORTFOLIOS ... 36
FIGURE 3:VALUE-WEIGHTED RETURNS OF LEVEL PORTFOLIOS ... 53
FIGURE 4:EQUAL-WEIGHTED RETURNS OF LEVEL PORTFOLIOS ... 54
FIGURE 5:VALUE-WEIGHTED RETURNS OF CHANGE PORTFOLIOS ... 55
FIGURE 6:EQUAL-WEIGHTED RETURNS OF CHANGE PORTFOLIOS ... 55
1. Introduction
The Nobel Peace Prize winner and former U.S. Vice President, Al Gore, claims that “integrating issues such as climate change into investment analysis is simply common sense”. He is a leading advocate for sustainable capitalism; sustainable long-term value maximization through integrating environmental, social and governance issues into investment decisions (Generation Investment Management 2012). Al Gore calls it common sense, but is it so for all rational, wealth-maximizing investors? Does the management decision on whether to communicate environmental performance or not have an impact on the valuation of the firm?
In this paper we investigate the effects of voluntary environmental disclosure on the value of Nordic listed firms. Blowfield and Murray (2011) define corporate social reporting as accounting for non-financial aspects of a firm’s performance, and extending the firm’s accountability to a wide range of stakeholders within the society. Corporate social accounting consists of both environmental and social disclosure, and is a way for stakeholders to assess whether firm lives up to value expectations (Pruzan 2009). Non-financial disclosure allows investors to evaluate firms on ethical dimensions, compare performance and track development.
While third party organizations, like MSCI and Oecom, analyze and rank firms based on their social and environmental performance, it has become increasingly common for firms to initiate voluntary communication of their corporate social responsibility. According to the KPMG International Survey of Corporate Responsibility Reporting 2011, there is an increased willingness to report on corporate social issues amongst the largest companies across the globe. The emphasis on “softer” key performance indicators has increased, both as a result of government regulations and as a consequence of transformations in firm values. The financial consequences of voluntary environmental disclosure are of potential interest for investors, firms and governments. For profit-maximizing investors, the impact of environmental disclosure is of value in investment analysis and in the decision between different investment strategies. Over the past years, there are indications of a shift in investor preferences. Sustainable capitalism, or social responsible investments, has gained momentum. The Carbon Disclosure Project (CDP) publishes Nordic reports on behalf of
signatory investors. Since the first publication in 2007, the number of signatory investors has increased from 315 with assets of US$41 trillion to 551 with assets of US$71 trillion (Carbon Disclosure Project 2007; 2011). Disclosure of social and environmental issues is an important factor when evaluating the sustainability of investment opportunities, and disclosure might affect the capital allocation of social responsible investors.
The financial effects of voluntary environmental disclosure are of interest to firms and managers in their strategic decision-making. Identifying the activities that affect the environmental performance of a firm is often costly, and firms with high environmental accounting have high corresponding disclosure costs. Disclosure can be an instrument in a differentiation strategy, aiming to develop a reputation of high environmental consciousness. The documentation of potential gains from voluntary environmental disclosure is value relevant to firms in their cost-benefit analyses, since firms will choose to disclose information until the marginal disclosure costs equals the marginal disclosure benefits (Orlitzky and Whelan 2007).
The effect of disclosure might affect government decisions. In 2010, The Norwegian Ministry of Finance presented a hearing proposal suggesting to implement requirements of social accounting for firms legally bound to maintain accounting records. Sweden and Denmark have already implemented similar regulations (KPMG 2011). If the potential benefit from environmental disclosure is greater than the subsequent costs, firms have an incentive to disclose environmental information voluntarily. Based on this incentive line of thought, one could argue that a documentation of financial benefits would lead to the need for less extensive government regulations on social accounting.
In our study, we examine the value effect of voluntary environmental disclosure on Nordic listed firms. These countries are examples of markets where there has been a striking rise in corporate social reporting the recent years (KPMG 2011). We restrict our focus to voluntary environmental disclosure, mainly because of limitations in available data on corporate social reporting. We base our measure of environmental disclosure on the carbon disclosure score given to firms reporting to the Carbon Disclosure Project1. This organization provides a
1
Alternatively, we considered analysing corporate social reporting based on data from the Global Reporting Initiative (GRI). This would have allowed us to analyse corporate social reporting as a whole, but the data material is less extensive. In order to ensure the quality of our analysis, we choose to look at only environmental disclosure.
global standard for measurement and disclosure of information on climate change, and holds the largest collection of self-reported climate change data in the world (Carbon Disclosure Project, 2012).
To our knowledge, we are the first to investigate this topic in the Nordic capital markets. We use performance measures as proxies for firm value, and focus primarily on Tobin’s Q and stock returns. Previous literature on the subject use other measures for firm value, like cost of capital or free cash flow (Plumlee et al. 2010; Clarkson et al. 2010; Dhaliwal et al. 2011). Our paper contributes to the area of research by looking at a different market and applying other firm value measures than earlier studies.
We look at the effects of different disclosure characteristics to analyze which aspects of voluntary environmental disclosure are relevant for valuation purposes. We do a preliminary test of the entire Nordic population to examine whether firms that initiate voluntary environmental disclosure experience higher firm value that the non-disclosing firms. We find a positive association between disclosure initiative and Tobin’s Q, but due to endogeneity, the results suffer from estimation bias. To overcome the endogeneity problem, we include only disclosing firms in the regression sample. This enables us to test for firm value differences due to differences in disclosure policy.
Within the sample of firms reporting environmental information, we construct portfolios based on their disclosure characteristics. Using scores from the Carbon Disclosure Project, we assign the firms to an environmental disclosure index. From this index, we create three portfolios, and compare the firms with the highest, midrange and lowest levels of disclosure. To investigate the effect of changes in environmental disclosure, we create portfolios based on changes in the disclosure index. Firms are allocated to portfolios based on changes in disclosure score from last year, and we analyze differences among firms with improved, stable and aggravated disclosure.
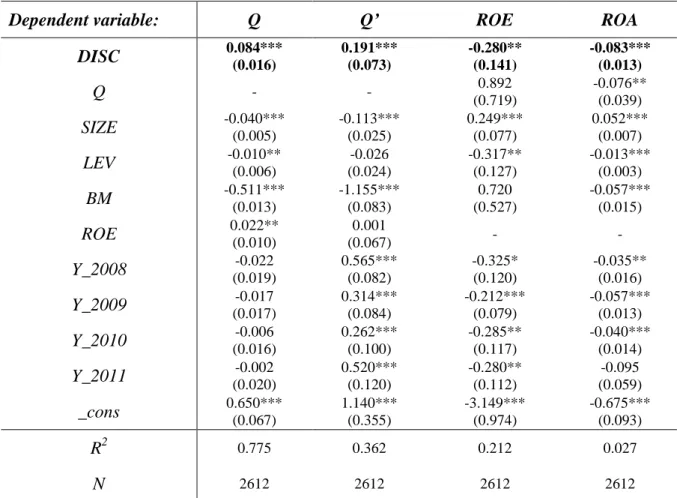
In the first part of the analysis, we test how environmental disclosure is related to accounting measures. We use Tobin’s Q as a valuation measure, and use proxies for environmental disclosure level as key independent variables. Regression results suggest that the level of disclosure is positively associated with firm value. We do not observe the same relation while looking at the impact of changes in disclosure level. In addition, we perform similar analyses with the operating measures ROE and ROA as dependent variables. On these
measures, the results of disclosure level effects are inconclusive, but we find an indication of a significant negative impact of disclosure change.
In the second part of the paper, we look at firm value from a market perspective, and investigate differences in stock returns between the constructed portfolios. We apply the three-factor model of Fama and French (1993); and then augment it with the momentum factor proposed by Carhart (1997). We understand that this is a joint test of the efficient market hypothesis and the value relevance of environmental disclosure. To be specific, the alpha in a strategy of going long in the high and selling short in the low portfolio is expected to be zero if markets are efficient, irrespective of the relevancy of disclosure policy. However, a positive alpha implies that disclosure is important for firm valuation, and that markets react slowly to this information.
First, we look at return differences between the portfolios based on level of disclosure. The results show that the quantity of disclosed information seems to be already incorporated in the market price. We find no evidence of a positive alpha in a strategy that buys the high disclosure portfolio and sells the low disclosure portfolio.
Finally, we look at the portfolios based on changes in disclosure level, and evaluate a strategy of buying the improvement portfolio and selling the aggravation portfolio. The improved disclosure portfolio experiences a higher alpha than the stable portfolio. The portfolio with aggravated disclosure experiences the poorest alpha of the three. This implies that improvements or aggravations in disclosure level appear to be relevant for firm valuation, but the market adjusts the stock price slowly. This finding indicates that firms benefit from improved environmental disclosure, in the form of higher stock returns.
The paper is structured as follows. Chapter 2 provides a review of the previous literature relevant for the topic. In chapter 3, we develop our hypotheses. Chapter 4 describes the dataset, research design and the methodology used in the empirical analysis. Chapter 5 presents the empirical findings from the hypotheses analysis. Chapter 6 provides a discussion of our results and findings, and in chapter 7 we will offer concluding remarks.
2. Literature review
The relationship between financial disclosure and firm value has been extensively analyzed in previous disclosure literature. Research on the impact of non-financial disclosure on firm value is less developed. With increasing focus on environmental and social consciousness and greater demand for documentation and reporting on these issues, the relationship between non-financial reporting and firm value is more relevant than ever.
Most previous literature on disclosure and firm valuation focuses on financial or mandatory disclosure (Healy and Palepu 2001; Leuz and Wysocki 2008). The consensus in most of this literature is that there is a negative association between increased disclosure and cost of capital. Assuming an inverse relationship between cost of capital and stock prices (Bodie et al. 2009), increased disclosure may lead to increased firm value. While economics-based models of disclosure establish a link between financial, mandatory reporting and subsequent economic effects, discretionary disclosure theories describe the relationship between voluntary disclosure and consequences of such activities (Verrecchia 2001). For the purpose of our thesis, we divide the relevant discretionary theories into two branches.
The first line of arguments presents models where firms are more likely to reveal favorable than unfavorable information to the market. The “good-news” theory of Verrecchia (1983) predicts managers to exercise discretion in disclosure decisions when investors have rational expectations about managerial actions. The decision to disclose or not is perceived as a signal indicating whether the information would have a positive or negative effect on the market price. A negative effect is either due to bad news or disclosure costs greater than the potential gains of disclosure. Managers decide the quantity of disclosed information based on predicted market reaction. This level of disclosure constitutes a disclosure threshold for the firm. Information above the threshold is withheld from the market. Investors are aware of the total information quantity possessed by the manager, but do not know the content. They will interpret the absence of disclosure as consistent with the information being above the disclosure threshold, signaling either bad news or high disclosure costs. Orlitzky and Whelan (2007) argue that the impact of signaling and transaction costs, as well as various other costs and benefits of disclosure, affect the disclosure quantity of the firm. They conclude that the level of social and environmental accounting should be set so that marginal costs of disclosure equal marginal benefits. Verrecchia (1983) predicts that firms with high potential
benefits connected to disclosure will disclose more information compared to firms with less potential benefits.
A second branch of discretionary disclosure literature suggests that that managers aim to create a reputation of providing credible disclosures, as a way to reduce market transaction costs (Healy and Palepu 2001). Theory on market liquidity proposes reduced information asymmetry as a potential benefit of increased disclosure. Uninformed investors may be less willing to trade in the stock market as a consequence of asymmetric information and adverse selection problems (Leuz and Wysocki 2008). Hence, disclosure decisions may affect capital allocation in the market. Reduced investor willingness to participate in market transactions may lead to market illiquidity and increased ask-bid spreads (Verrecchia 2001). Increased disclosure, more widespread information to investors, and publicity may increase the awareness and lead to an increased investor base for the firm (Merton 1987). This implies that the firm might benefit from investing resources in the improvement of quality or quantity of the disclosed information. Healy et al. (1999) find evidence that suggests increased voluntary firm disclosure to be linked to improved stock performance and increased stock liquidity. This line of literature suggests that firms should increase discretionary disclosure irrespective of good or bad news because such a policy will, with all other things held constant, increase firm value.
Disclosure of corporate social responsibility, and environmental responsibility as a subset of this, might affect financial performance through other channels than financial disclosure (Rodriguez et al. 2006). From a business perspective, theory suggests that CSR and environmental consciousness can be utilized to differentiate products and brands in competitive markets, and can be viewed as an investment in product differentiation (McWilliams and Siegel 2001). The disclosure of environmental activities can be a channel for communicating environmental commitment as a part of the differentiation strategy. Discretionary disclosure theory predicts voluntary disclosure reports to be used by high performing companies to distinguish themselves from low performing companies (Verrecchia 1983). Another channel of influence on financial performance is through investor preferences. Investors with high social awareness are willing to receive a lower rate of return on an investment in a social responsible firm (Richardson and Welker 2001). Effects of disclosure are likely to affect the investment decisions of shareholders if the information disclosed is perceived as relevant to firm value. The literature examining the
effects of voluntary environmental disclosure on firm value is not conclusive on whether environmental information is value relevant for investors. Clarkson et al. (2008) divides previous literature within the field of environmental accounting research into three broad groups. The first group of studies examines the relevance of environmental performance information on firm valuation. The second category consists of studies that investigate the factors that affect managerial decisions on disclosure of environmental risks and opportunities. The last section of studies focuses on the relationship between firms’ environmental performance and the level of environmental reporting and disclosure. We will mainly focus on literature from the first category in our literature review.
The earliest studies in this group of on environmental accounting research focus on specific events or liabilities, and subsequent impact on stock prices. Blacconiere and Patten (1994) examine the effects of a substantial chemical leak in India in 1984, and find evidence of a significant negative market reaction after the event. However, the reaction is mitigated for firms with more extensive environmental disclosures prior to the event, compared to other firms. Blacconiere and Northcut (1997) examine the relation between stock price changes due to the introduction of new environmental legislation in 1984 and environmental data of chemical firms. The study finds that firms with more comprehensive environmental reporting have an impaired negative stock price reaction to environmental regulation compared to less extensive disclosers. These studies differ from our study as they examine the effects of specific environmental events and mandatory disclosures on stock prices, but their findings document the existence of a relationship between environmental disclosure and firm valuation.
Yamashita et al. (1999) examines the rewards of environmental consciousness in the U.S. capital market. They reveal a positive, but insignificant effect on stock prices after the revelation of information on firm environmental consciousness. The study concludes that information on environmental performance does not appear to be very important for investors’ short-term decisions in the capital markets. Al-Tuwaijri et al. (2004) find that environmental disclosure might reveal environmental practices which affect the financial performance of the firm, and thereby firm value. Clarkson et al. (2008) find a positive association between environmental performance and the level of social or environmental disclosure. Their analysis focuses on the rationale behind voluntary environmental disclosures, but does not answer whether or not non-financial disclosures have the intended valuation consequences.
Fisher-Vanden and Thorburn (2011) find announcements of commitment to reduce greenhouse gas emissions to be received negatively in the stock market. Firms experience significant negative abnormal stock returns as a consequence of such announcements, and their results show overall evidence of a conflict between environmental disclosure and firm value maximization. Dhaliwal et al. (2010) find that more stakeholder-oriented countries have stronger negative association between CSR reports and financial forecasts than countries with less matured CSR activities. They find evidence that firms’ social performance has a greater likelihood of affecting the financial performance of the firm in stakeholder-oriented countries than in other countries. Al-Tuwaijri et al. (2004) provides a simultaneous equations approach to the relation between environmental disclosure, environmental performance and economic performance. The study reveals good environmental performers to disclose more than poor environmental performers, in accordance with discretionary disclosure theory on “good news”.
Dhaliwal et al. (2011) look at the relation between voluntary corporate social disclosure and cost of capital, and investigate whether an initiation of voluntary disclosure is associated to a reduction in future cost of capital. They find that firms with a high prior year cost of capital are more likely to initiate voluntary disclosures of corporate social responsibility. The cost of capital reduction due to disclosure is superior for firms with high social performance, and firms that initiate voluntary disclosure appears to exploit the reduction benefit. These firms are more likely to raise capital after initiation, suggesting that corporate social disclosure has an impact on market capital allocation.
Richardson and Welker (2001) analyze the relationship between both financial and social disclosure and firms’ cost of capital. In accordance with previous research, they find quantity and quality of financial disclosure to have a negative relation to cost of capital. Social disclosure behaves differently than expected and have an opposite effect. Results indicate a significant, positive relation between the level of social disclosure and cost of capital. Valuation models suggest an inverse relation between cost of capital and share price. Hence, their analysis implies that increased non-financial disclosure raises the firms cost of capital and lower share price (Richardson and Welker 2001).
Aerts et al. (2008) and Cormier and Magnan (2007) find evidence of an opposite relation between environmental disclosure and cost of capital in some contexts. Aerts et al. (2008) find that improved environmental disclosure translates into more precise analyst earnings
forecasts. This relation suggests a reduction in firms cost of capital and increased stock prices. They find the effect to vary according to industry, country and disclosure venue. The effect is mitigated in environmentally sensitive industries. Cormier and Magnan (2007) examine the relation between environmental disclosures and firm earnings and stock market value in country-specific settings. They base their study on environmental disclosures from Canada, France and Germany from 1992-1998. Their findings suggest that the decision to report environmental information is related to firm earnings and stock market valuation for German firms, but they fail to document a relation in France and Canada.
Two recent studies of direct relevance to our paper are Clarkson et al. (2010) and Plumlee et al. (2010). Clarkson et al. (2010) examine the impact of voluntary environmental disclosure on cost of capital and overall firm value. Their results show evidence of voluntary environmental disclosures being value relevant for investors in their assessment of future environmental risks and liabilities. They find a positive association between voluntary environmental disclosure and overall firm value, but fail to document an effect on cost of capital.
Plumlee et al. (2010) examine the relationship between environmental disclosure and overall firm value by analyzing both the denominator and numerator component of free cash flow valuation: cost of capital and cash flow. By using a self-constructed environmental disclosure quality index they find a positive relationship between disclosure quality and cost of capital. This result is consistent with the findings of Richardson and Welker (2001). However, they find a negative association between the issuance of standalone CSR reports and cost of capital. The latter is in accordance with discretionary disclosure theory that predicts decreased information asymmetry to reduce cost of capital. When analyzing the numerator component, they find that higher quality of voluntary environmental disclosure is positively associated with firms’ expected future cash flow and thereby firm value. The study documents evidence of an overall positive effect of environmental disclosure on firm value.
3. Hypothesis development
In our study, we aim to investigate if voluntary environmental disclosure has an effect on firm value. Our goal is to determine whether differences in environmental disclosure characteristics affect stock returns and overall firm value.
Al-Tuwaijri et al. (2004) suggest that the quality of environmental disclosure can serve as an indication to the market of the quality of the firm’s environmental practices. The environmental disclosures communicate information to the market about firm specific risks and liabilities connected to the environmental issues. Disclosure also provides information about potential emissions reduction and cleaning costs. Some recent studies suggest a positive effect of voluntary non-financial disclosure on firm value (Plumlee et al. 2010; Clarkson et al. 2010), while others suggest a negative relation (Fisher-Vanden and Thorburn 2011; Richardson and Welker 2001). All mentioned studies find disclosure to have an impact on firm valuation, but the findings are inconclusive on the direction of the effect. Based on this, we predict environmental disclosure to have an effect on firm value and develop our main null hypothesis:
H: Voluntary environmental disclosure is not associated with firm value.
Most previous studies have mainly focused on the effect of social or environmental disclosure on stock prices through cost of capital (Dhaliwal et al 2011; Clarkson et al 2010; Plumlee et al 2010). We divide the term “firm value”, and investigate the relation from both a market and an accounting perspective, and develop further specifications of our main hypotheses.
First, we look at the effects of disclosure on accounting measures of firm value. Theory suggests that environmental disclosure can be implemented as part of a differentiation strategy in competitive markets. High performing firms use discretionary disclosures to distinguish themselves from low performing firms (Verrecchia 1983), implying that voluntary environmental disclosures can be used in a differentiation strategy to set good environmental performers apart from poor environmental performers. However, disclosure initiatives are connected with disclosure costs, and these costs are increasing with the extent of disclosure. McWilliams and Siegel (2001) propose that the costs of disclosure can be seen as investment in brand management. These arguments suggest that disclosure have an effect
on the accounting value of firms, and that the direction of the impact depends on whether the costs or benefits of disclosure are greater. We specify the following subset of hypothesis H:
H_I: A firm’s voluntary environmental disclosure is not associated with the accounting value of the firm.
From a market perspective, we look at stock returns. The level of environmental disclosure reflects the amount of environmental information, risks and opportunities that is communicated to the market. Following the “good news” theory of Verrecchia (1983), managers will choose to disclose information to an information threshold. Managers consider information above the threshold as having an unfavorable effect on firm value, due to high disclosure costs or bad news. Investors will interpret the lack of disclosure as a signal that the information withheld will cause a negative market reaction. Firms with good news will then benefit from disclosing as much as possible. The second branch of discretionary disclosure literature suggests that discretionary disclosure increase firm value, regardless of good or bad news. High discretionary disclosure might lower market transaction costs and reduce information asymmetry (Healy and Palepu 2001; Leuz and Wysocki 2008; Verrecchia 2001). Healy et al. (1999) find evidence of increased voluntary firm disclosure to be associated with improved stock performance. Environmental disclosures might affect stock returns through investor preferences. Social responsible investors will accept lower rates of return on social responsible investments (Richardson and Welker 2001). Investors whose goal is profit maximization and who do not have the same preferences for social responsibility will not accept the discount on returns. Based on these arguments we predict that voluntary environmental disclosure to be value relevant for investors, and specify the following null hypothesis:
4. Methodology
In this chapter, we present the methodology used in the empirical analysis chapter. We describe the approach, econometric methods, and dataset used in the analysis.
4.1 Analytical approach
We use regression methodology to test our main hypotheses. Previous research within the area of interest have applied several research designs; most commonly event-study or regression analysis. We assume the environmental disclosure score to be a summary of the transparency and voluntary disclosure of the firm throughout the year. Based on this assumption, it is not possible to pin-point exact announcement date and an event-study is not suited as research design as it looks at the effect of certain events within a short time window. Hence, we choose to apply regression models in our thesis.
To investigate the impact of environmental disclosure characteristics, we construct two sets of portfolios. One set of portfolios is based on disclosure level, and the other set is constructed based on changes in disclosure score. Orlitzky and Whelan (2007) suggest that the level of social and environmental accounting should be set at a level at which the marginal costs equals the marginal benefits of disclosure. Verrecchia (1983) predict managers to use discretion in disclosure decisions and disclose information up to a threshold level. Information above the threshold causes a negative market reaction, and is unfavorable for the firm. Based on this, we suspect the effect of absolute level of disclosure to be influential on managerial disclosure decisions, and we divide the disclosure sample into 3 portfolios: high, midrange and low disclosure.
We also want to test whether changes in disclosure from one year to the next are relevant for investors. An improvement in voluntary environmental disclosure might be perceived as a signal of increased environmental consciousness. Assuming that environmental consciousness is value relevant to investors, we expect this signal-effect to impact market valuation. To examine the effect of improvement or aggravation in disclosure, we construct three portfolios based on changes in disclosure level: improvement, no change and aggravation.
We apply the analysis on both sets of portfolios, and test the effects of disclosure characteristics on accounting and market measures. In addition to the portfolio division, we use disclosure score and change in score as alternative proxies for disclosure characteristics. To investigate our two sub-hypotheses we use two different sets of models and variables. From an accounting perspective, we measure firm value as Tobin’s Q and test if there are significant differences between the groups of firms within each portfolio set. As a robustness test, we use alternative measures of firm value.
Next, we test the effect of environmental disclosure characteristics on market returns. This is not easy in our current setting because the disclosure score sums information that can be available through the year, and we cannot use an event study to isolate the effect of a disclosure score announcement. However, if markets are not efficient and disclosure has an impact on firm value, we might find differences between the two groups. We use the three-factor model of Fama and French (1993) and then we add the momentum three-factor of Carhart (1997) to investigate the effects of disclosure on stock returns. This is a joint test of the efficient market hypothesis and the effect of environmental disclosure. No observable differences in returns do not necessarily imply that disclosure has no impact, but positive alphas in such strategies are evidence of the disclosure relevancy.
All statistical analyses are performed in STATA.
4.2 Environmental disclosure and firm value
To analyze whether firm-specific environmental disclosure is associated with differences in firm value, we use regression analysis based primarily on accounting measurements. Following a similar logic to Gompers et al. (2003), we estimate the following regression;
Tobin’s Q is the dependent variable, is the disclosure variable, is a vector of control variables and is an error term.
4.2.1 Pooled OLS regression
The underlying data is unbalanced panel data, with both time-series and cross-sectional dimensions. The panel is unbalanced because not all cross-sectional members have
observations for all years. To analyze the data with OLS regression, we pool the cross sections over time by including year dummy variables in the regression equation:
.
Where Tobin’s Q is the dependent variable and is the disclosure variable. All variables used in regression analysis are explained in section 4.4.5. When we apply OLS regression, we assume that the idiosyncratic error is uncorrelated with the independent variables in each time period (Woolridge 2009). We assume no correlation, but are aware of a very likely endogeneity problem connected to this assumption. The problem of endogeneity occurs when the independent variable is correlated with the error term. This implies that the regression coefficients in the pooled OLS regression are biased (Woolridge 2009). Hence, if disclosure has an impact on firm value, then the firms that benefit the most from disclosure are the ones that will choose to do so. This magnifies the effect of disclosure. To overcome this problem, the main analysis of our hypotheses is based on a sample restricted to only disclosing firms. By looking at differences within this sample, we try to minimize the endogeneity problem.
4.2.2 Fixed effects model
Panel data can alternatively be analyzed through unobserved effects panel data methods. There are two common models, fixed effects and random effects transformations. We do a Hausman test to determine whether to use a random effects or fixed effects model.2 The null hypothesis in the Hausman test is rejected, and we use fixed effects.
The fixed effects model uses a transformation to remove the unobserved effect prior to estimation, and remove all time-constant independent variables (Woolridge 2009). Under OLS assumption, correlation between the unobserved effect and the independent variables will cause biased results. With fixed effects estimation, the unobserved effect is allowed
2
We compute a Hausman test in STATA under the full set of random effects assumptions. We use random effects estimates unless the Hausman test reject the assumption Cov(xijt, ai) = 0, and find the unobservable effect ai to be correlated with one or more explanatory variables. A rejection means that the key assumptions of the random effect model are false, and thus, we use the fixed effects model (Woolridge 2009)
to be correlated with the independent variables in the regression equation. STATA conducts the necessary adjustments to the regression.
Where is the idiosyncratic error, and represents unobserved factors that change over time and affect the dependent variable, and is the disclosure variable. All regression variables are described in section 4.4.5.
4.3 Environmental disclosure and stock returns
In this section, we describe the method applied in the analysis where we look at stock returns. By dividing the sample into portfolios based on disclosure characteristics, we are able to examine differences in market performance between portfolios. We derive portfolio returns and evaluate the portfolio performance through factor model regressions. The portfolio construction is described in section 4.4.4.
4.3.1 Portfolio returns
In order to derive the monthly returns for each portfolio, we retrieve a monthly return index, RI, for each stock from Datastream. This return index shows the monthly growth in share holdings, assuming dividends to be re-invested. Based on this, we calculate the monthly returns for each stock over the five-year period covered in this paper, following standard procedures in the literature (e.g. Bodie et al. 2009):
We calculate both equal-weighted and value-weighted returns for each portfolio. In the calculation of the equal-weighted returns, we add the monthly returns of all the firms within the portfolio, and then divide the total return on the number of firms. For each period t, the equal-weighted portfolio return is calculated as follows:
∑
The value weighted returns are calculated based on the firms’ market capitalization as a fraction of the total portfolio market capitalization. Since there are firms from several countries included in the dataset, all data are converted into one common currency. is the market capitalization of firm i and n is the number of firms in the portfolio. The market capitalization of each firm is retrieved from Datastream. The value-weighted portfolio return
is then calculated according to the following equation for each period t:
∑ ∑
The efficient market hypothesis predicts stock price to reflect all value-relevant information available to investors. A market is defined as efficient if the prices of securities fully reflect public information (Fama 1970). Investors trading in such a market should expect to obtain an equilibrium rate of return on their investments. When new information becomes available, the efficient market hypothesis predicts the stock price to respond quickly to the information and adjust to the fair level, where ordinary rates of return can be expected. The price will at all times reflect all current information, and only change in response to new information (Fama 1970).
Hence, in a semi-strong efficient market, there would be no potential benefit of active investment-management strategies. Stock prices would already reflect all relevant information and attempts to outperform passive strategies would be futile. A passive investment strategy would yield the same profits without the additional costs of active strategies.
4.3.2 Factor model regression
From a market perspective, we aim to examine the relationship between voluntary environmental disclosure and stock returns. The analysis of differences in stock returns is a joint test of the market efficiency hypothesis and the impact of voluntary environmental disclosure. We assume our Nordic capital markets to have a semi-strong form of market efficiency; where the stock price reflects historical information and all publicly available information regarding the firms’ prospects.
The efficient market hypothesis predicts that security prices reflect all available information and it is difficult to outperform passive strategies through active management. Findings that do not reconcile with the market efficiency hypothesis are referred to as market anomalies. Patterns of returns that seem to contradict the efficient market hypothesis are interpreted in multiple ways in empirical finance. Several methods have been developed to account for the effects of differences in returns, and some equity characteristics have been identified as influential factors on realized returns.
Fama and French (1993) propose that market anomalies can be explained as results of risk premiums, and they interpreted the excess returns as risk premiums connected with the firm characteristics. They developed a three-factor model with systematic factors constructed to account for the effects of firm-level exposure to the market, market capitalization and book-to-market ratio. Carhart (1997) added one additional factor, and developed a four-factor model. The forth factor is constructed to capture momentum effects in the market, since one-year return momentum have been shown to significantly forecast future returns.
The factors are constructed by forming portfolios that mimic the risk connected to these characteristics. These models can be seen as performance attribution models that attribute differences in portfolio returns to different firm characteristics (Gompers et al. 2003). For our purposes, we only apply the model as a method of assessing performance attribution of firm characteristics and do not discuss the factors as proxies for risk.
We start our analysis by investigating the portfolio returns and whether there are differences in the returns over the period. In accordance with the efficient market hypothesis we expect the three portfolios to yield equal returns. If the three portfolios differ significantly in firm characteristics, then a disparity in returns might be explained by the differences in style factors. We base our analysis on the three-factor model of Fama and French (1993) and the four-factor model of Carhart (1997). The three-factor model of Fama and French (1993) is specified as follows:
Carhart (1997) adds a return momentum factor to the three-factor model, and the four-factor model is given by
Where is the dependent variable, , , and are the independent variables, to are the factor coefficients, and is the error variable.
The dependent variable in the factor models is monthly excess stock return. We use both excess portfolio returns and return difference between the extreme portfolios as . For each month t, excess stock return is measured as portfolio return less risk-free rate:
In addition, we calculate monthly return differences between the extreme portfolios in each set of portfolios. The return difference is calculated as the monthly excess return of portfolio 1 minus the excess return of portfolio 3. Portfolio 1 represents the upper extreme portfolios: high disclosure or improvement in disclosure. Portfolio 3 represents the lower extreme portfolios: low disclosure or aggravation in disclosure.
The alpha – α – is the estimated intercept coefficient. We follow the logic of Gompers et al. (2003) and interpret this coefficient as the abnormal return of the investment; return beyond what could have been gained by a passive investment in the factors. is the value-weighted market return in month t less the risk-free return, and , and are the month t returns on factor-mimicking, zero-investing portfolios constructed to capture size, book-to-market and return momentum effects (Carhart 1997). The coefficients to , are often called factor loadings. If the factors are relevant in explaining return disparities, then excess return should be explained by performance attribution due to these factor loadings. The intercept of the equation, α, should be zero if the factors fully explain the portfolio. The factors are described in detail in section 4.4.6.
4.4 Dataset
In this section we introduce the Carbon Disclosure Project and present the underlying data used in the analysis.
4.4.1 Carbon Disclosure Project
The Carbon Disclosure Project (CDP) is an independent, non-profit organization that works for emissions reduction and sustainable use of natural resources. The organization provides a global standard for measurement and disclosure of information on climate change, and holds the largest collection of self-reported climate change data in the world (Carbon Disclosure Project, 2012). The Carbon Disclosure Project acts on behalf of institutional investors and help them reduce the climate change related risks in their portfolios and make sustainable investment decisions. A main focus in the Carbon Disclosure Projects strategy is to ensure that collected data is available, comparable and used efficiently (Carbon Disclosure Project, 2012). The reported information is submitted through a standard questionnaire, and the organization provides extensive guidelines on how to respond and report according to this questionnaire.
Based on the reported information, the CDP produce and publish several annual reports (Carbon Disclosure Project, 2012). In 2007, they expanded their publications to the Nordic countries and for the first time published a CDP Nordic report. This report summarizes the responses and submitted information of the largest listed firms in Finland, Denmark, Sweden and Norway.
4.4.1.1
Carbon Disclosure Score
The carbon disclosure score is determined based on firms’ self-declared answers to the CDP questionnaire. This questionnaire is designed to best assess the understanding and disclosure of firm-specific exposure to climate-related issues, as well as the strategic and managerial focus on the business issues related to climate change. The extent of emission measurement and frequency and relevance of emissions disclosure are also important elements in the questionnaire and important in the determination of the final carbon disclosure score achieved. This questionnaire is initially self-declared, but firms can choose to have their reported answers verified externally. Externally verified data ensure greater confidence in the submitted material, and reflects positive in the assessment process (Carbon Disclosure
Project, 2011). Firms are ranked on a scale ranging from a minimum score of zero to a maximum score of 100.
The CDP Nordic report for 2011 provides guidelines for investors to interpret the ranking in levels of commitment to carbon disclosure. Firms with a disclosure score between 0 and 50 are described as low disclosing firms. Firms within this range have shown limited commitment to disclose climate related risks and emissions. Carbon disclosure scores between 50 and 70 are denoted as midrange. Firms in this range have an increased commitment to emission disclosure, and report more company-specific risks and opportunities. Firms with a carbon disclosure score above 70 are referred to as high disclosing firms. These are firms with high understanding of the business issues connected to climate change and emissions, and where these issues are built in to the core business (Carbon Disclosure Project, 2011).
4.4.2 Data description and sample selection
Our dataset consists of data for firms that have their primary listing on the stock exchange in Oslo, Stockholm, Copenhagen or Helsinki over the time period of 2006 - 2011. We retrieved all available ISIN numbers for firms with primary listings on the Nordic stock exchanges from the Compustat database. Firms we were unable to retrieve ISIN numbers for are excluded from the population. The sample of disclosing firms consist of firms that intersect on two data sources: firms that have their primary listing on one of the Nordic stock exchanges and firms that disclose their environmental performance to the Carbon Disclosure Project. All accounting and financial measures are retrieved from the Datastream database. The accounting data is retrieved annually at the end of the year, while the financial data is retrieved monthly. The disclosure data consists of annual carbon disclosure scores, retrieved from CDP Nordic reports3. Carbon disclosure scores are listed in appendix 1.
The population includes firms from four different countries. Most firms report their accounting and financial data in their national currency. In order to achieve a meaningful analysis we have to convert all underlying data to one common currency. We retrieve monthly averages of daily listings of exchange rates from the Norwegian Central Bank4. To
3
Annual CDP Nordic reports are available at: https://www.cdproject.net/en-US/Results/Pages/All-Investor-Reports.aspx 4
achieve the required comparability, we translate all financial values and accounting measures into Norwegian Kroner (NOK). For the monthly data we use monthly listings in the conversion, and for the annual data we use end of year listings.
4.4.3 Data adjustments
The initial Nordic population includes a total of 766 listed firms. This includes 4656 annual observations of accounting data and a total of 51,509 monthly return observations. Regression analyses are vulnerable to extreme observation and outliers. We chose not to exclude outliers, because due to the nature of the capital markets included in the sample, we have no reason to believe the outliers are caused by errors in the dataset5.
We exclude all observations with missing values and firms with incomplete data on all accounting variables. We have no reason to believe there is a systematic pattern in the missing observations, and hence, we believe that this adjustment will not create a bias in our results.
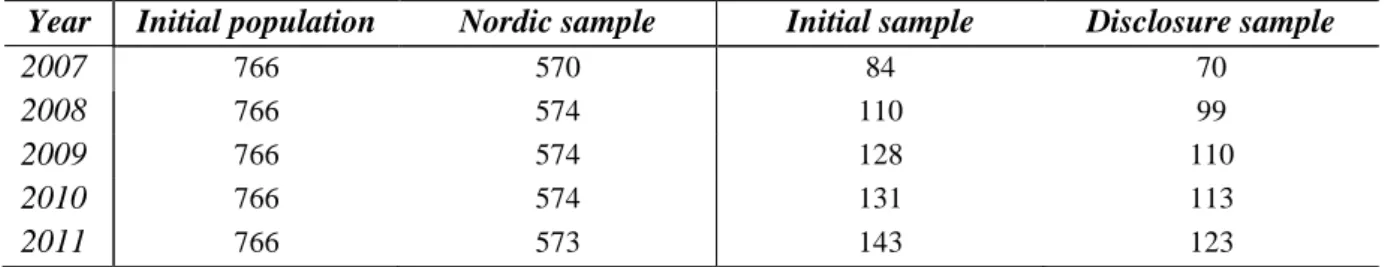
After adjusting for missing values and observations, the final population consists of a total of 36,448 monthly observations. This implies a reduction in observations of approximately 30 per cent. This is a significant reduction, but we find it necessary in order to ensure the quality of our analysis. We will refer to this adjusted, underlying population as the Nordic sample. As a consequence of the adjustments in the underlying population, the disclosure sample is adjusted accordingly. The final disclosure sample consists of 6180 observations of monthly returns. The final samples are listed in Table 1.
Table 1: Sample description
Year Initial population Nordic sample Initial sample Disclosure sample
2007 766 570 84 70
2008 766 574 110 99
2009 766 574 128 110
2010 766 574 131 113
2011 766 573 143 123
Initial population is the entire Nordic population before data adjustments. Nordic sample is the underlying population adjusted for missing data. Initial sample consists of firms that have their primary listing on the Nordic stock exchanges and disclose to the Carbon Disclosure Project. Disclosure sample is the adjusted disclosure sample.
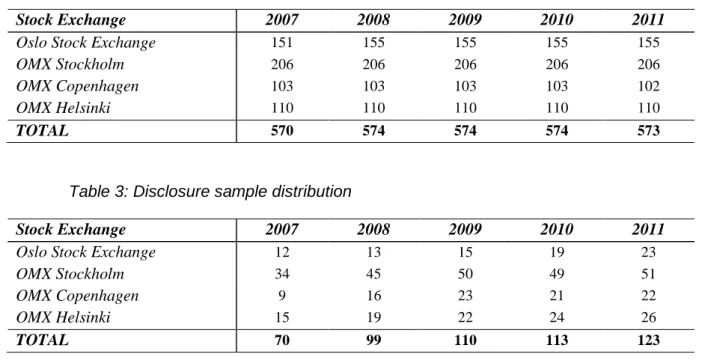
Listed in Table 2 and 3 are the distributions by country. The distribution is fairly stable over the entire time period, with Sweden having the largest percentage of disclosing firms.
Table 2: Nordic sample distribution
Stock Exchange 2007 2008 2009 2010 2011
Oslo Stock Exchange 151 155 155 155 155
OMX Stockholm 206 206 206 206 206
OMX Copenhagen 103 103 103 103 102
OMX Helsinki 110 110 110 110 110
TOTAL 570 574 574 574 573
Table 3: Disclosure sample distribution
Stock Exchange 2007 2008 2009 2010 2011
Oslo Stock Exchange 12 13 15 19 23
OMX Stockholm 34 45 50 49 51
OMX Copenhagen 9 16 23 21 22
OMX Helsinki 15 19 22 24 26
TOTAL 70 99 110 113 123
4.4.4 Portfolio construction
We divide the disclosure sample into portfolio sets to analyze the effects of disclosure characteristics on firm value. The portfolios are reset at the start of each year, according to the new environmental disclosure ranking. This implies that investors sell their investment in the portfolio at the end of the year, and then reinvest at the start of the year in the adjusted portfolio.
There have been several measures for the degree of non-financial disclosure in related literature. Clarkson et al. (2010) and Plumlee et al. (2010) use self-constructed disclosure indices based on information retrieved from voluntary environmental disclosures in standalone environmental reports, CSR reports and corporate websites. Richardson and Welker (2001) use a social measure drawn from the Society of Management Accountants of Canada, which provide time-series data on disclosure scores based on disclosed information in annual reports. To construct an environmental disclosure index for the Nordic capital markets, following a similar approach to Clarkson et al. (2010) and Plumlee et al. (2010), is to time-demanding and complex for the scope of our thesis. We base our measure of disclosure on data drawn from a third party source, and use the carbon disclosure score from
the CDP Nordic reports as a measure for voluntary environmental disclosure. It allows us to compare the transparency on environmental issues of the sample firms.
We believe the carbon disclosure score is a well-suited proxy for voluntary environmental disclosure. The Carbon Disclosure Project rank the sample firms according to understanding and disclosure of firm-specific exposure to climate-related issues, as well as the strategic and managerial focus on environmental issues. One section of the CDP questionnaire assesses the firm’s own communication of environmental disclosure based on information about the frequency, extent and relevance of their own reporting (Carbon Disclosure Project, 2012). The CDP questionnaire relates to the previous fiscal year (Carbon Disclosure Project 2011), which implies that the carbon disclosure score of 2011 represent the assessment of firm disclosure of 2010 data. The CDP Nordic report is made publicly available in September each year. However, all firms in the disclosure sample communicate firm sustainability and environmental commitments throughout the year via firm websites or company reports6. Based on this, we consider the disclosure score to represent information about firm disclosure policy that has been available for stakeholders throughout the year. An analyst following the sample firms would, based on the continuous communication of environmental activities, be able to assess and rank the firms based on disclosure policy, and thus, the portfolios are set at the beginning of the year. Hence, for an investor wanting to follow an investment strategy based on disclosure characteristics, the information required to construct such portfolios is available at the beginning of the year. In addition, we believe that in order for the gains of disclosure to be compared to the corresponding costs of disclosure, the accounting measures of year t have to be compared to the disclosure score of year t.
4.4.4.1
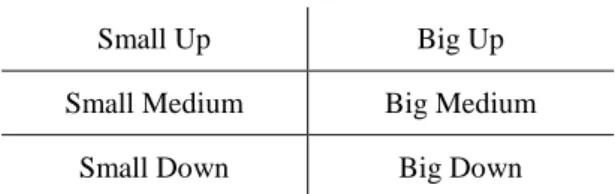
Disclosure Level Portfolios
First, we construct portfolios based on the absolute level of disclosure. We rank the sample firms according to their carbon disclosure score from the CDP Nordic report, where a score of 100 reflects perfect disclosure, and zero is consistent with no disclosure. We use this to divide the sample into three portfolios. The lowest 30 per cent of the firms on the index is in the low disclosure portfolio (Low). Firms in the upper 30 per cent on the index are in the high disclosure portfolio (High). The rest of the firms in the sample constitute the midrange
6
Listed in appendix 3 are the addresses of the sustainability websites for the firms in the Disclosure sample. These sites are where the firms communicate their environmental information to the public.
disclosure portfolio (Midrange). The environmental disclosure index and subsequent portfolios are adjusted each year, according to the new annual carbon disclosure score. Table 4 describes the portfolio distribution and show minimum, maximum and mean disclosure score for the firms in each portfolio.
Table 4: Disclosure Level Portfolios
2007 2008 2009 2010 2011 High Mean Max Min 75.16 100 64 70.73 89 57 71.42 84 67 79.40 90 71 81.54 97 74 n 19 30 35 33 39 Midrange Mean Max Min 49.32 63 34 47.75 56 39 59.03 66 48 63.4 70 58 66.64 73 59 n 31 36 40 45 47 Low Mean Max Min 18.95 32 0 28.33 38 12 31.29 45 5 37.43 57 8 43.89 58 1 n 20 27 35 35 36 Total Mean Max Min 47.66 100 0 49.53 89 12 54.15 84 5 60.03 90 8 64.69 97 1 n 70 93 110 113 123
Listed is the mean, maximum and minimum value of the environmental disclosure score. N is the number of firms in each portfolio.
4.4.4.2
Disclosure Change Portfolios
Next, we allocate firms into portfolios according to change in disclosure level from the previous year. This is to capture whether improvement or aggravation in environmental disclosure score has an effect on firm value. We use each firms first reporting year as “base” year, and lose 12 monthly observations of stock returns for each firm. This implies that firms that only have reported to the Carbon Disclosure Project one year are excluded from the sample.
The change score is calculated by subtracting the environmental disclosure score of year t-1 from the score in year t. Firms with an improvement of more than five points in disclosure score from year t-1 to year t are allocated to the Pos_Change portfolio. Firms that experience a decline in disclosure score of more than five points from year t-1 to year t are in the Neg_Change portfolio. Firms with a stable disclosure score or firms that experience an increase or decrease in disclosure level of less than five points are in the No_Change portfolio. Table 5 describes the disclosure change portfolios.
Table 5: Disclosure Change Portfolios 2008 2009 2010 2011 Pos_Change Mean Max Min n 60.65 88 20 26 64.52 84 30 46 68.79 90 18 39 71.93 97 41 41 No_Change Mean Max Min n 51.23 89 33 13 49.92 79 22 13 62.44 83 24 41 69.49 89 49 39 Neg_Change Mean Max Min n 44.83 74 12 24 42.17 71 7 29 47.26 63 20 19 53.05 83 12 21 Total Mean Max Min n 52.68 89 12 63 55.00 84 7 87 62.03 90 18 99 67.06 97 12 101
Listed is the mean, maximum and minimum value of the environmental disclosure score. N is the number of firms in each portfolio.
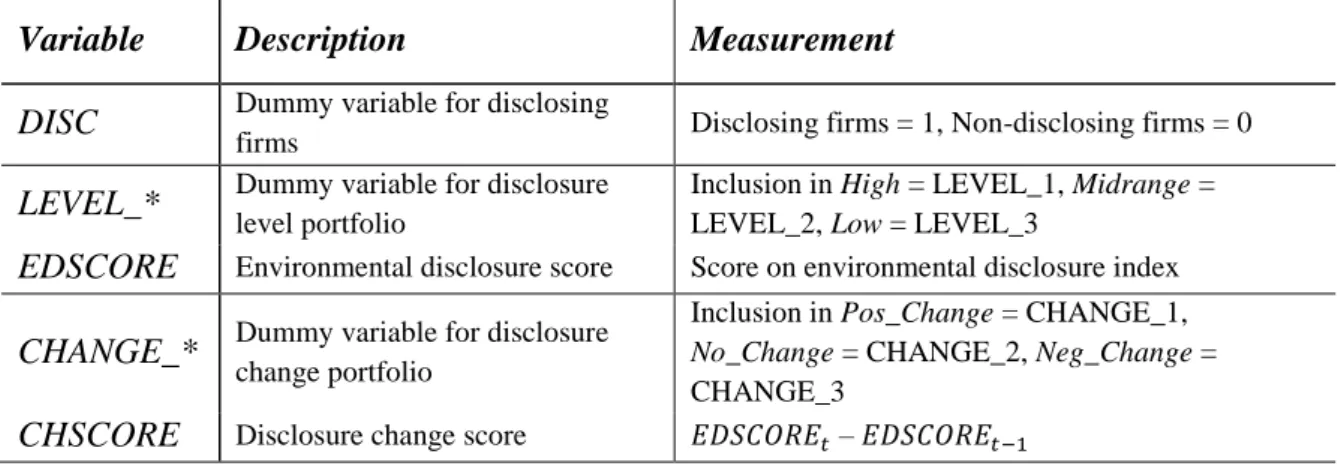
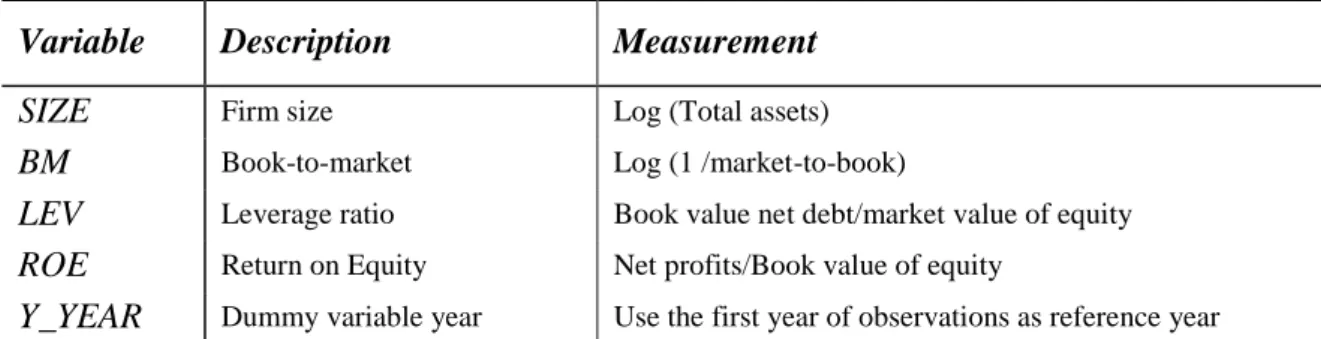
4.4.5 Variable description
In this section, we describe the regression variables used in the pooled OLS regression and the fixed effects regression.
4.4.5.1
Measures of firm value
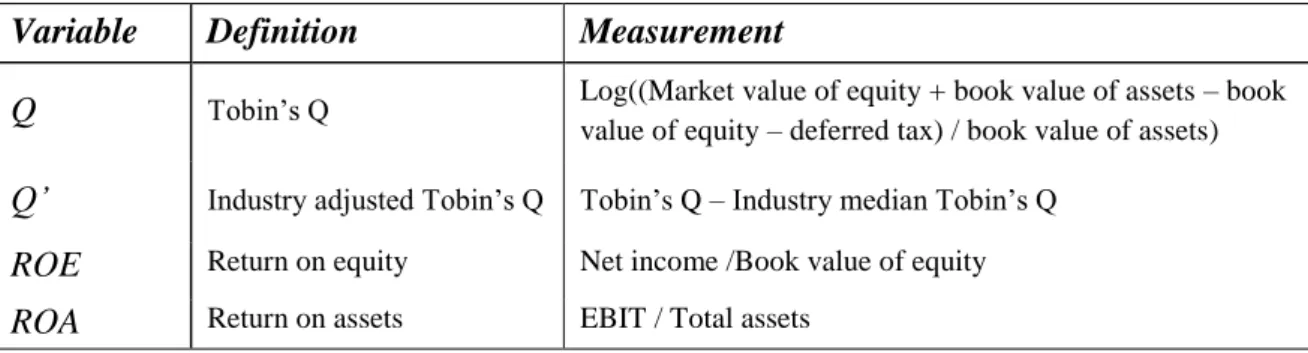
To study the impact of disclosure on firm value, we look at several firm performance measures. There are various measurements of firm performance in related literature, and there is no common consensus on which approach is best to follow. We follow Gompers et al. (2003) and choose Tobin’s Q as main proxy for firm value. This measure contains both market information and information about assets in place, which makes it a suitable proxy in our thesis.
Tobin’s Q is defined as the ratio of market value of the firm to the replacement costs of the firm’s assets (Lindenberg and Ross 1981). If Tobin’s Q is higher than one, then the market value of the firm is higher than the recorded value of the firm’s assets. This suggests that there are unrecorded assets valued in the firm. Tobin’s Q has been used as proxy for growth opportunities in previous literature (Dhaliwal et al 2011), because Tobin’s Q might reflect a long-term perspective of firm valuation. We follow the method applied by Kaplan and Zingales (1997) and calculate Tobin’s Q as the market value of assets divided by the book value of assets. Market value of assets is defined as book value of assets plus the market
value of common equity less the sum of the book value of equity and balance sheet deferred taxes. Deferred taxes are the accumulated taxes that are deferred as a result of timing differences between accounting values of assets and liabilities and the reporting value for tax purposes. Following the literature we use the natural logarithms of Tobin’s Q to incorporate non-linear relations.
We use alternative measures for firm performance to test the robustness of our results. One concern connected to using Tobin’s Q as proxy for firm value is that we neglect the possibility that industries might systematically differ in voluntary environmental disclosure. A failure to industry-adjust could lead to distortions in the regression results. We compute an industry median Q for each year, and use it to find the industry-adjusted Tobin’s Q for each firm (Gompers et al. 2003). The industry-adjusted value measure – Q’ – is calculated as the firm’s Tobin’s Q minus the industry median Tobin’s Q. The industry median is based on the two-digit sector code from Global Industry Classification Standard (see appendix 4), and calculated from the Nordic sample.
Both Tobin’s Q and industry-adjusted Tobin’s Q are measures of financial performance and based on both market and accounting information. In addition to these two measures, we use return on equity (ROE) and return on assets (ROA) as alternative proxies for firm value to examine whether we find the same results when we use operating performance as proxy for firm value. Both ROE and ROA show the relation between annual firm income and accounting values of equity and assets. The operating measures represent a still picture of the firm profitability and reflect a short-term firm value compared to Tobin’s Q. Return on equity is retrieved from Datastream and defined as net income divided by book value of shareholder equity. Return on assets is calculated as earnings before interests and taxes (EBIT) divided by total assets. Both EBIT and total assets are retrieved from the Datastream database.
Table 6: Firm value variables
Variable Definition Measurement
Q Tobin’s Q Log((Market value of equity + book value of assets – book value of equity – deferred tax) / book value of assets)
Q’ Industry adjusted Tobin’s Q Tobin’s Q – Industry median Tobin’s Q
ROE Return on equity Net income /Book value of equity