of Bus Service Quality Using
Bayesian Networks
Jingxian Wu and Min Yang, Ph.D.
Southeast University
Soora Rasouli, Ph.D.
Eindhoven University of Technology
Chengcheng Xu, Ph.D.
Southeast University
Abstract
Studies on public transit have emphasized the role of passenger satisfaction with service quality in travel choice decisions and indicated that satisfaction depends on various service attributes. Few studies have, however, systematically examined the underlying relationships among service attributes to assess their influence on passenger overall satisfaction. Therefore, to contribute to this rapidly-emerging literature, this paper applies Bayesian networks to quantify the influence of each service aspect on passenger overall satisfaction with regular bus service quality. This analysis involved 609 passengers who participated in a 2013 regular bus service survey in Nanjing, China. The derived Bayesian network shows the relationships among service attributes and passenger overall satisfaction graphically. In particular, service aspects such as running on schedule, acceptable waiting time, available seats, clean onboard environment, pleasant environment at stations, convenient design for transfers, and air-conditioning were the key determinants of overall satisfaction with bus service.
Keywords: Passenger satisfaction; public transit; bus service quality; Bayesian networks
Introduction
Nowadays, an increasing reliance on private cars for daily trips poses serious problems for cities, such as congestion, air pollution, road accidents, and excessive fuel
the world have implemented restrictive policies on private car usage. On balance, these policies have not been very successful, as private cars still have some advantages over public transit due to their door-to-door service (Cheng and Liu 2012). Even after implementing strategies that promote public transit, the service quality of public transit remains questionable in many cases, which causes many travelers to forgo transit options. The limited success of these strategies can be attributed largely to the fact that current strategy formulations are focused on the interests of the operators, while passengers—the sole judges of transit service—are ignored. Accordingly, the definition of transit service attributes should be refined from the passenger perspective. In turn, this means that operators should have a good understanding of the relationship between manageable attributes of transit services and customer satisfaction (Das and Pandit 2013; Yilmaz and Celik 2008; Fu and Xin 2007). Therefore, an investigation of key influential service factors is of great significance to optimize transit service from a customer perspective, resulting in policies that could be formulated to influence traveler behavior and attract more transit users.
Several studies have been conducted to investigate the relevant service attributes that characterize transit services and analyze their impacts on passenger satisfaction. Reliability and punctuality were found to be important aspects of service quality in the studies of Beirao and Cabral (2007) and Eboli and Mazzula (2010). Dowling et al. (2002) and Litman (2008) found that the time spent walking to a bus stop and waiting time at a bus stop also were major factors influencing trip satisfaction, and Eboli et al. (2008) and Tyrinopoulos et al. (2008) found that service frequency has a major impact on overall transit service quality measures. Other studies highlighted the importance of available information, personnel attitudes, and safety (Eboli and Mazzula 2012a; Fellesson and Friman 2008). Comfort, fare, safety, and information during the journey also are elements that transit passengers care about during their trips (Nathanail 2008; Iseki and Taylor 2008).
Methodologically, a variety of measurement approaches and methods of analysis have been used to quantify the impacts of these service aspects on passenger overall satisfaction. Following a strong tradition in marketing research, some researchers have applied the ServQual method (Hu and Jen 2006), and some have used discrete choice models to investigate the influences of service attributes from the passenger perspective (Nurul-Habib et al. 2009; Hensher 2014). Others have estimated structural equation models to provide a causal representation of the relationships between service aspects and overall satisfaction (De Oña et al. 2013; Eboli and Mazzulla 2007; Eboli and Mazzulla 2012b).
Although these approaches have demonstrated their power, they share the limitation that they require their own assumptions about the distribution of the data and, usually, they assume predefined underlying relationships between the dependent and independent variables. However, these assumptions may not always hold true, and once basic assumptions are violated, erroneous estimations and incorrect inferences could be produced. However, if the aim of a study is to explore the relationship
between service quality attributes and passenger satisfaction, the application of a more flexible approach would be preferable. Transit service aspects involve intangible and
tangible elements, most of which are not independent but are highly interrelated, and considerable relationships among service aspects and overall satisfaction are inherently uncertain. Once an improvement occurs in one service aspect, it not only will pose an effect on overall satisfaction but also will propagate the influence to its associated aspects. Therefore, models assessing transit service should be capable of incorporating complicated uncertainties and reflect the unknown relationships between service aspects.
De Oña et al. (2012) and Garrido (2014) proposed using data mining techniques such as decision trees and neutral networks to identify the significant factors by capturing the underlying relationships among service attributes. In this study, we applied a Bayesian network (BN), which is applied in transportation fields for its multiple advantages, including the skilled handling of uncertainty and complexity and the capability of modifying the available knowledge into the model and easily updating causal relationships (Janssens et al. 2006). Based on the dependency relationships between travel behaviors and city structure, Takamiya et al. (2010) successfully applied BN to represent the relationships and forecasted travel behaviors in Nagoya, Japan. Scuderi and Clifton (2005) used BN to explore the relationship between land use and travel behavior in the Baltimore, Maryland, metropolitan region. Ma (2015) applied BNs in the analysis of multimodal mode choice behavior and showed a competitive performance compared with classical discrete choice models. Kemperman and Timmermans (2014) measured the relationship between the built environment and active travel behavior of children by BN. Karimnezhad and Moradi (2016) and De Oña et al. (2011) used BN for the diagnosis of road traffic accidents. All these have confirmed that BNs have favorable features in the data analysis, especially in the prediction of relationships among
variables.
BNs are such a promising tool that some authors proposed BN applications in transit service analysis. Perucca and Salini (2014) pioneered the use of BN in the analysis of customer surveys of railway systems and found support that in the modeling of the relationships between individual characteristics and satisfaction, BN has a higher predictive capability than the “mainstream” ordered logistic regression. Wu et al. (2014) applied the approach in the assessment of public transit service and presented causal relationships among service aspects. Both proved the advantages of BN in the analysis of transit service, but neither conducted comprehensive modeling validation or evidence sensitivity analysis for influential quantifications.
The primary objective of this study was to use the BN approach to identify which service aspects are the most influential factors on passenger satisfaction, accounting for the correlations among these attributes. The study is based on a survey conducted in Nanjing, China.
Data
Description of Nanjing Bus System
Nanjing, the capital of Jiangsu province, is a large city located in southeast China. As shown in Figure 1, its urban area includes eight regions: Xuanwu, Gulou, Jianye, Qinhuai, Yuhuatai, Qixia, Jiangning, and Pukou. The Pukou region is separated from the other by the Yangtze River, and the Nanjing Yangtze River Bridge connects it with other parts. The population of Nanjing has been growing at a very fast rate in the last few years, from 3.72 million in 2001 to more than 5.52 million in 2011.
FIGURE 1.
Urban area of Nanjing
The city’s rapid economic growth has brought a great increase in private vehicle ownership, with the number of private cars increasing by 22.8%, from 695,000 in 2010 to 853,000 in 2011, as shown in Figure 2. The bus system in the urban area involves 6,573 buses in operation that serve 510 routes with a served length of 7,959 km. In 2011, the average number of bus trips per day was 2.76 million. The ratio of regular bus in the overall modal splits in the city is 18.3%, a share that has been decreasing over the last decade (Yang and Qian 2012).
FIGURE 2.
Travel modal split in Nanjing (2001–2011)
Survey Method
A questionnaire survey of regular bus passengers in Nanjing was conducted to collect data for this study. Based on related studies, the questionnaire was designed and adjusted according to feedback from a pilot survey and was divided into three main sections. The first section included questions about personal and household characteristics of passengers (gender, age, personal income, residential location) and general information on the trip (weekly bus riding frequency, trip purpose). The second section contained 19 questions concerning passenger assessments of various aspects of bus service. Respondents were asked to rate five main transit service attributes (safety, comfort, convenience, reliability, and fare) on a four-point Likert scale ranging from 1— strongly disagree to 4—strongly agree. The items were formulated such that they could be directly interpreted in terms of service quality. The third section measured passenger overall satisfaction with the bus trip in dichotomous categories of 0—unsatisfied or 1—satisfied. Compared to prior research, both satisfaction with service attributes and overall satisfaction were measured in rather crude categories to focus on strong, dominant patterns and, therefore, subtle differences in satisfaction were ignored. An advantage of a more robust approach is capturing measurement of mood and personality that may otherwise affect satisfaction ratings (Gao et al. 2015).
The survey was conducted at various stops and stations in Nanjing on weekends from March to May 2013. A stratified sampling was employed in all regions except Pukou (because of the frequently-jammed traffic on the Nanjing Yangtze River Bridge that was the only connection facility between Pukou and other regions in 2013). To guarantee the response rate, surveyors started with the question about passenger willingness to take
part in the survey and then guided respondents when completing the questionnaires. A total of 745 questionnaires were randomly distributed, and after deleting those with incomplete responses, 609 usable questionnaires were obtained for this study.
Data Description
Of the sample, 51.2% of respondents were male and 48.8% were female. Nearly half of the respondents (45.1%) were ages 20–29, and 36.7% were ages 30–39. Most respondents (66.4%) were highly-educated and held a university degree, and more than 80% of travelers had a regular job. A total of 39% had a monthly income of 2000–4000 yuan, followed by 28.9% with an income of 4000–6000 yuan. Low to medium income earners were the dominant users of public transit, which is in line with the current situation in China (since public transit fares are relatively low, those who cannot afford car payments are the majority users). This group makes up a relatively high proportion of transit users, so many policies are developed for their benefit.
Bus users from households in the central area accounted for 51.4% of the sample. The accessibility of bus service in the central area is quite different from that of the surrounding areas; people living in the central area usually enjoy a more comprehensive and mature bus service.
All persons in the sample were asked to report how many days they rode the bus in a week and their primary trip purpose. Table 1 shows that 40.5% of the respondents took the bus 1–2 days per week, 31.2% took the bus 3–5 days per week, and 17.6% took the bus 6–7 days per week. Nearly half took the bus for commuting (travel to work or school), and the remainder took the bus for leisure or shopping.
TABLE 1.
Survey Descriptive Statistics (n=609)
Characteristics Statistics
Gender Male (51.2%), female (48.8%)
Age Ages 15–19 (1.2%), 20–29 (45.1%), 30–49 (46.3%), 50 and older (7.3%)
Education Senior high school (21.1%), university (66.4%), master’s degree or higher (12.5%) Income Less than 2000 yuan (10.5%), 2000–4000yuan (39%), 4000–6000yuan (28.9%), more than 6000 yuan (21.4%), unknown (0.2%) Job With a job (83.5%), no job (16.5%)
Household location Central area (51.4%), surrounding area (48.4%), unknown (0.2%)
Frequency Less than 1 day per week (10.6%), 1–2 days per week (40.5%), 3–5 days per week (31.2%), 6–7 days per week (17.6%), unknown (0.1%) Purpose Commuting (49.7%), non-commuting trip (50.3%)
To get a rough evaluation of bus service quality, a calculation of the average satisfaction score and a score ranking for each service aspect from low to high were made, as shown in Table 2. The average scores ranged from 1.95–3.33, suggesting that satisfaction with the service attributes was modest. Respondents overall were satisfied with the aspects of safety as well as route and schedule information, which were the highest-ranked attributes. In contrast, most aspects of comfort and reliability were rated poorly. As Table 2 shows, four of the most unsatisfactory service attributes were “not
overcrowded,” “riding smoothly without severe braking and acceleration,” “acceptable waiting time for bus at stops,” and “seats are available when riding.” The overall service satisfaction was 0.425, implying that only 42.5% of respondents were satisfied with the bus services. Figure 3 shows the global view of specific service grading.
TABLE 2.
Average Score and Rank of Service Attributes
Items Category Code Average Rank
Equipped with safety facilities
Safety
S1 3.33 19
Safe for boarding on and off bus S2 2.90 17
Handling emergency situation properly S3 2.84 15
Good overall safety S4 2.89 16
Not overcrowded
Comfort
CF1 1.95 1
Seats are available when riding CF2 2.21 4
Equipped with air-conditioning CF3 2.25 6
Good broadcasting system on board CF4 2.71 14
Ride smoothly, no severe acceleration and braking CF5 2.10 2
Clean environment onboard CF6 2.36 10
Pleasant environment at stations or stops CF7 2.26 7
Walking distance to stops is reasonable
Convenience
CN1 2.65 13
Provided with schedule and route information CN2 2.92 18
Reasonable bus service frequency CN3 2.36 9
Convenient design for connections and transfers CN4 2.58 12 Run on schedule
Reliability
R1 2.34 8
Acceptable waiting time for bus at stops R2 2.14 3
Arrival information provided is reliable R3 2.24 5
Reasonable fare Fare CO 2.55 11
Overall satisfaction with bus service Overall AS 0.425
FIGURE 3.
Global view of service attributes score
Methodology
Developing the Bayesian Networks
In this study, a BN approach was used to explore the relations between bus service aspects and overall satisfaction, which was dichotomized in this study. A BN is a
technique for inductive knowledge discovery and has been widely used in the combined field of artificial intelligence and machine learning (Pearl 1991). Normally, a BN is made up of two components: a directed acyclic graph (DAG) and a conditional probability table (CPT). A DAG is the structure component that includes a set of nodes depicting random variables and some directed links representing probabilistic relationships between the nodes. The parameter component (CPT) provides the statistical
interpretation of the probabilistic dependencies depicted by the structure. For example, a link from node X to node Y indicates that X is a parent of Y and Y is a child of X. The link indicates that X and Y are statistically correlated. For each child node, a CPT is attached to quantify its dependency relations with its parent nodes.
Table 2 shows an overview of the variables included in the model estimation. It is challenging to incorporate so many variables in a model and capture the complex interactions. Because these service aspects are highly-correlated and the structure of service relationships is not that clear, defining an appropriate structure for them can be difficult. A BN approach can overcome such difficulties, in that it can simultaneously derive the direct and indirect relationships between the set of service aspects. In this study, all these service variables were included in the estimation with the utilization of specific network-learning algorithms. The network learning involved two main tasks: learning the network structure and then estimating the CPTs for the structure (Pearl 1991). For the first task, a network-learning algorithm named TPDA (Three-Phase Dependency Analysis) was used to identify correlations between bus service aspects, based on the three-phase dependency method developed by Cheng, Bell, and Liu (Cheng et al. 2002). The algorithm includes three phases: (1) drafting the network, (2) thickening the network, and (3) thinning the network. (For an extensive explanation of the algorithm, readers may refer to Arentze and Timmermans [2009]). In the first phase, a draft graph is created on the basis of the mutual information of each pair of variables and the mutual information is defined as follows:
(1) where p(x, y) is the joint probability of X and Y, and p(x) and p(y) are unconditional probabilities of X=x and Y=y. The mutual information between X and Y, a measure of closeness, indicates the expected information gained about Y when the value of X is given. The second phase is about thickening the network by adding connections based on the conditional independence test between pairs of variables. In this phase, all pairs of variables that have mutual information greater than the entropy but not directly connected are examined. A connection is not added only when the two variables are independent, and in this phase some wrong connections are possible to be added. In
the third phase, each connection of the network is reexamined and removed if the corresponding variables are conditionally independent after the structure adjustment. For the second task, the parameters (CPTs behind the nodes) are estimated based on the dataset by the most commonly used EM (Expectation Maximization) algorithm (Lauritzen 1995). The algorithm finds the CPTs for each node through a sequence of stepwise iterations and iterates between the expectation (E) step and the maximization (M) based on both estimated data and observed data. The process is repeated until the difference between the log-likelihoods of two successive iterations falls below a tolerance threshold. Both tasks could be done using the free software PowerConstructor (Cheng et al. 2002), where the two algorithms are embedded and well tested. The composed network was visualized and tested in Netica (Norsys Software 2006).
Modeling Results
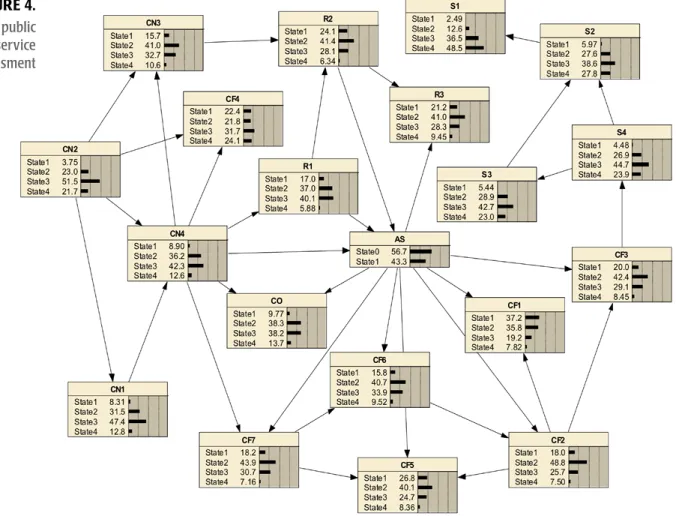
Figure 4 shows the constructed BN. The probability distribution of each variable is shown, and the predicted distribution of AS (43.3% for overall satisfied rate) is quite close to the observed percentage in the survey data (42.5% satisfied). The link represents the relationships between the two variables, and the structure shows the existence of direct and indirect relationships between the service attributes and overall satisfaction.
FIGURE 4.
Network of public transit service assessment
As in the structure, AS plays a central role among other variables, which is less surprising, since AS is the important variable in this study. It is directly related to other 11 service aspects nodes (CF1, CF2, CF3, CF5, CF6, CF7, CO, CN4, R1, R2, and R3). The remaining variables have indirect influences on AS. Among them, R1–Run on Schedule has a direct influence on AS–Overall Satisfaction, and unreliable service would result in additional waiting time for passengers, leading to a decline in passenger satisfaction over R2– Acceptable Waiting Time for Bus, confirming the analysis by Strathman et al. (2003). CN3–Service Frequency also impacts passenger satisfaction on R2–Acceptable Waiting Time for Bus, indicating that the more frequent the service, the shorter the waiting time, which is consistent with the Transportation Research Board report (2003). Most variables of the same attribute are directly linked, such as S1, S2, S3, and S4, but some variables of different attributes also seem to affect each other, such as R2–Acceptable Waiting Time for Bus, CN3–Service Frequency, CO–Reasonable Fare, and CN4–Convenient Design for Transfers. This is not especially surprising since waiting time should depend on bus service frequency arrangement. Actually, the crossing relationships are plausible. Service reliability is always closely related to service convenience. An efficient transfer could improve the whole punctuality of transit performance.
Before the analysis, appropriate validation methods on the modeling performance should be made to prove the confidence in the outputs of the model. A recommended method is to derive a confusion matrix that compares the observed values with the predicted ones (Fawcett 2006). Table 3 shows the overall BN estimation result performed in Netica (2006). As can been seen in the confusion matrix, the overall estimation error rate of this BN is 13.96%. Compared to the model accuracies between 59.72% and 62.16% in the study by De Oña et al. (2012), the estimation result obtained is quite acceptable.
TABLE 3.
Test Results of Model Confusion Predicted Actual
For AS
State0 State1
300 50 State0
35 224 State1
Error rate 13.96%
Figure 5 presents alternative performance measurement quantifying model estimation accuracy for the datasets. The receiver operating characteristic (ROC) curve was employed, as the target variable AS is binary. By contrasting false positive with true positive rates, the ROC curve depicts estimation performance, and the area under the curve (AUC), which specifies overall accuracy, takes values between 0 and 1, with better performance being indicated by values closer to 1 (Marcot et al. 2006). As shown in Figure 5, the resulting ROC curve is quite close to the upper limit, and the achieved AUC value is 0.93, which indicates a high predictive quality of the BN, revealing that the BN approach performs well and its structure is capable of providing evidence sensitivity analysis based on the CPTs for each node. With the entering new evidence, the probabilities of the other nodes will be updated in the network by Bayes’ Rule. The probabilistic changes of the target variable reflect the impact of the changing variable on it.
Analysis Result
An evidence sensitivity analysis and a mutual information analysis as described above were conducted to further examine the main service aspects that affect passenger overall satisfaction towards bus service in the network.
Evidence Sensitivity Analysis
The evidence sensitivity analysis, based on the compiled BN, permitted us to change the posterior distribution of each variable and observe its corresponding effect on the target variable. Once the evidence was entered into one state of one parent node, such as state 1 of CF (CF=1) in the network, the probability distribution of CF=1 changed to 100%. Meanwhile, with the application of Bayes’ theorem and the CPTs of the compiled BN, its corresponding changes were calculated and reflected in the probability distributions for the states at its child variables. BN allows information to flow in opposite directions, which means a change in a given node can update the distribution probabilities of its neighboring nodes through the network (Jensen 1996).
The evidence was changed in every state, one by one, and then the corresponding newly-updated probability distribution of target variable AS was taken down. Figure 6 shows the minimum and maximum probability p(AS=1) due to variations in the probability distributions of all service aspects. The bars indicate changes relative to the initial probability p(AS=1). Observing the length of bars in this figure, it was found that comfort, convenience, reliability, and costs exert a strong influence on satisfaction in both positive and negative ways. Their relatively large influence can be partly attributed to their immediate adjacency to AS.
All aspects of safety influenced satisfaction within the range of 39–48%, with the exception of overall safety, whose influence range was 31–52%. These three negligible effects reflect that in most passenger perceptions, the regular bus is a safe system,
FIGURE 5.
providing a satisfactory level of service in which vehicles are well-equipped with security facilities and drivers are skillful in handling accidents. With respect to the latter, an unsatisfied overall safety (S4=1) poses a significant negative influence, at 12.3%. In addition, in the BN structure, these four nodes are indirectly linked to AS. Therefore, compared to the other variables, safety aspects have somewhat lower effects on overall satisfaction.
FIGURE 6.
Evidence sensitivity analysis results for each attribute
With regard to comfort, six highly-important variables were observed: CF6–Clean Environment Onboard, CF7–Pleasant Environment at Stations, CF3– Air-Conditioning Onboard, and CF2–Seats Available, which were set to state 4 and are especially evident for the maximum probability p(AS=1), which increase dramatically, from 43.3% to more than 72%, compared to a decrease from 43.3% to appropriately 15% for the minimum probability p(AS=1). These service aspects are more tangible and relate to infrastructure facilities. Compared to private vehicles, public transit has apparent deficiencies in these fields. For example, CF2–Seats Available is one of defining components of public transit compared to private cars; available seats on transit is necessary among passengers who commute from work to their home. CF3 and CF7 are mainly associated with the local climate in Nanjing; due to the hot summers, air-conditioning onboard and shelters at bus stops are highly valued and needed and, thus, are of primary service aspects to be improved in competition with private vehicles. CF5–Ride Smoothly and CF1–
Overcrowded Inner Space, about which passengers often complain, are two service items that vary under dynamic traffic conditions and changing passenger flow volumes during the day. For instance, in rush hour, overcrowded inner space is a common feature of high-capacity transportation, especially in developing countries. Both have a medium influence range of roughly 22–69%. CF4–Broadcasting System Onboard is the least influential variable, indicating that basic service delivery is more important than modern technology.
The variables Walking Distance to Stops and Schedule/Route Information Provided at Bus Stops have little influence on overall satisfaction. This can be due to the fact that frequent riders are satisfied with the current distance to stops and know the schedule and routes. CN3–Reasonable Bus Service Frequency, which has a close relationship with R2–Acceptable Waiting Time at Bus Stops, exerts a more significant influence on overall satisfaction, with an influence range of 26–64.4%. At the same time, CN4–Convenient Design for Connections and Transfers at Stops exhibits the greatest influence, 22.4– 70.6%. This result indicates that reasonable service frequency and convenient transfer service would largely improve the efficiency of bus rides.
R2–Acceptable Waiting Time is a highly important aspect for overall service, and its negative influence is particularly high for the minimum probability of AS=1, which decreases largely from 43.3% to 11.9%; the perceived waiting time tends to cause a negative impact on overall transit service satisfaction, and the intangibility and subjectivity of waiting time makes it difficult to measure. When the waiting time is beyond passenger tolerance, they would be annoyed and tag “long time waiting” as the primary service attribute. R1–Run on Schedule is another noteworthy service aspect, with a negative impact range of 16.72–43.31%. The ratio of AS is increased by 23.14% due to increased punctuality. R3 symbolizes the reliability of the electronic information about the distance of the incoming bus on the stations or stops and has a relatively small influence range, 23.4–63.2%.
The directly-related variable CO–Reasonable Fare has a 23% negative effect and a 29% positive effect on passenger satisfaction with overall transit service quality. Compared with the impacts of other aspects, fare is not the most influential factor in overall satisfaction. This finding may be attributed to the case that riding the bus is much cheaper than driving a car; the cost is not generally perceived as important, which concurs with the study by Beirao and Cabral (2007). However, the impact range still reflects that the low travel cost of public transit is still an attractive element over private car, and policy interventions could apply price regulations to traveling by private car and adopt favorable ticket price policies for public transit to attract more potential riders. The results indicate that R2–Acceptable Waiting Time, CF2–Seats Available, CF6–Clean Environment Onboard, CN4–Convenient Design for Transfers, CF3–Air-Conditioning Onboard, R1–Run on Schedule, and CF7–Pleasant Environment at Stations are sensitive attributes that affect overall satisfaction. Moreover, effects propagate change in linked variables. For instance, by entering evidence for state 4 of node R2, overall satisfaction is increased by 23.8%; along with the change of node R2, the other three nodes linked
also experience an increase of varying degree in the fourth state of each. In particular, a significant increase that adds up to 40% occurs in the fourth state of R3.
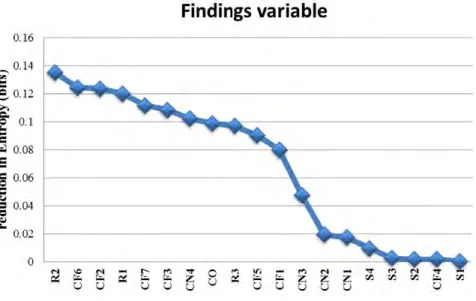
Mutual Information Analysis
Figure 7 shows the calculated reduction of entropy in the probability distribution of AS for each variable, and the top seven variables are the same as the variables posing the negative effects in the evidence analysis. Thus, the variables that contribute most to the reduction of entropy were, in order of importance, R2–Acceptable Waiting Time (0.135), CF6–Clean Environment Onboard (0.124), CF2–Seats Available (0.124), R1–Run on Schedule (0.120), CF7–Pleasant Environment at Stations (0.112), CF3–Air-Conditioning Onboard (0.108), and CN4–Convenient Design for Transfers (0.102). Mutual information less than 0.01 indicates that a least influence on the overall satisfaction is produced, and there are five least contributing variables (the four safety attributes and the broadcasting system onboard), and the result is consistent with the result of the evidence sensitivity analysis.
FIGURE 7.
Mutual information values among all network nodes and AS
Conclusion and Recommendations
This study applied a Bayesian network to estimate passenger assessments of bus service quality and identify the key influential factors of bus service quality. The data for the analysis were obtained from a 2013 regular bus service survey in Nanjing, China. An evidence sensitivity analysis and a mutual information analysis were used to derive the degrees of influence of each service aspect on overall satisfaction.
The results of this study showed that the BN approach was useful in identifying the key influential factors of bus service. According to the detailed sensitivity analysis, several findings can be drawn to help understand how service attributes influence passengers satisfaction with public transit. First, current safety attributes are already
satisfactory and exert little influence on perceived overall satisfaction with public transit services. Second, comfort, convenience, and reliability are significant influences on passenger satisfaction. Third, seven service aspects stand out as the attributes passengers care most about: running on schedule, acceptable waiting time, available seats, clean environment onboard, pleasant environment at stations, convenient design for transfers, and air-conditioning onboard. Therefore, quality improvement and management of these aspects are prerequisites to obtaining passenger satisfaction. Achieving and sustaining a high level of customer satisfaction is a key part of a transit agency’s efforts to increase public transit ridership, especially regular bus. Therefore, the policies and strategies that promote transit usage should be formulated accordingly to meet the needs of current and potential bus riders. Since passengers strongly prefer travel comfort, maintaining the vehicles in good condition, cleaning them regularly, and providing air-conditioning and an agreeable temperature inside the bus could be effective ways to keep the bus environments enjoyable. Passengers prefer convenient and efficient delivery services, which indicates that transit operators should place more emphasis in their policy planning on the connectivity of bus facilities and the design of exclusive lanes for public transit as well as the provision of reasonable time schedules such that buses are less impacted by traffic congestion and there is an improved level of reliability of existing bus service. These strategies could encourage current passengers to use the bus more often and attract new users.
Although city cultures and backgrounds of bus service differ, the BN approach presented in this study has relatively high transferability in the application and can be applied by local agencies or communities for identifying the most influential factors that needs improving, and corresponding policies can be proposed accordingly to improve passenger satisfaction. Since the current study focused on aggregate relationships, future research could examine heterogeneity in passenger satisfaction with service quality and test the needs for different kinds of passengers, allowing service providers to target different segments of the market.
Acknowledgments
This research is supported by National Natural Science Foundations of China (51378120 and 51338003) and the Postgraduate Research and Innovation Plan Project in Jiangsu Province (KYLX_0170). Fundamental Research Funds for the Central Universities and Foundation for Young Key Teachers of Southeast University and Eindhoven University of Technology are also appreciated.
References
Arentze, T. A., and H. J. P. Timmermans. 2009. “Regimes in Social-Cultural Events-Driven Activity Sequences: Modeling Approach and Empirical Application.” Transportation
Research Part A, 43(4): 311-322.
Beirao, G., and J. A. S. Cabral. 2007. “Understanding Attitudes towards Public Transport and Private Car: A Qualitative Study.” Transport Policy, 14(6): 478-489.
Cheng, J., D. A. Bell, and W. Liu. 2002. “Learning Bayesian Networks from Data: An Information-Theory Based Approach.” Artificial Intelligence, 137(1-2): 43-90 Cheng, Y. H., and K. C. Liu. 2012. “Evaluating Bicycle-Transit Users? Perceptions of
Intermodal Inconvenience.” Transportation Research Part A, 46:1690-1706. Das, S., and D. Pandit. 2013. “Importance of User Perceptions in Evaluating Level of
Service for Bus Transit for a Developing Country Like India: A Review.” Transport
Reviews, 33(4):402-420.
De Oña, J., R. de Oña, and F. J. Calvo. 2012. “A Classification Tree Approach to Identify Key Factors of Transit Service Quality.” Expert Systems with Application, 39(12): 11164-11171.
De Oña, J., R. de Oña, L. Eboli, and G. Zulla. 2013. “Perceived Service Quality in Bus Transit Service. A Structure Equation Approach.” Transport Policy, 29: 219-226 De Oña, J., R. O. Mujalli,, and F. J. Calvo. 2011. “Analysis of Traffic Accident Injury Severity
on Spanish Rural Highways Using Bayesian Networks.” Accident Analysis and
Prevention, 43(1): 402-411
Dowling, R. G., D. Mcleod, M. Guttenplan, and J. D. Zegeer. 2002. “Multimodal Corridor Level of Service Analysis.” Transportation Research Record, 1802: 1-6.
Eboli, L., and G. Mazzulla. 2007. “Service Quality Attributes Affecting Customer Satisfaction for Bus Transit.” Journal of Public Transportation, 10(3): 21–34. Eboli, L., and G. Mazzulla. 2008. “Willingness-to-Pay of Public Transport Users for
Improvement in Service Quality.” European Transport, 38:107-118.
Eboli, L., and G. Mazzulla. 2010. “How to Capture the Passengers’ Point of View on a Transit Service through Rating and Choice Options.” Transport Review, 30(4): 435-450.
Eboli, L., and G. Mazzulla. 2012a. “Structural Equation Modelling for Analyzing Passengers’ Perception about Railway Services.” Procedia–Social and Behavioural
Science, 54: 96-106.
Eboli, L., and G. Mazzulla. 2012b. “Performance Indicators for an Objective Measure of Public Transport Service Quality.” European Transport, 51(17):.1-21.
Fawcett, T. 2006. “An introduction to ROC Analysis.” Pattern Recognition Letters, 27(8): 861-874.
Fellesson, M., and M. Friman. 2008. “Perceived Satisfaction with Public Transport Services in Nine European Cities.” Journal of Transportation Research Forum: Transit
Issue Special, 47(3): 93-103.
Fu, L., and Y. Xin. 2007. “A New Performance Index for Evaluating Transit Quality of Service.” Journal of Public Transportation, 10(3): 47-69.
Gao, Y., S. Rasouli, H. J. P. Timmermans, and Y. Wang. 2015. “A Study of the Relationship between Subjective Well-Being and Travel Satisfaction.” Transportation Research, 144-153.
Garrido, C., R. de Oña, and J. de Oña. 2014. “Neural Networks for Analyzing Service Quality in Public Transportation.” Expert Systems with Applications, 41(15): 6830-6838.
Hensher, D. 2014. “The Relationship between Bus Contract Costs, User Perceived Service Quality and Performance Assessment.” International Journal of Sustainable
Transportation, 8(1): 5-27
Hu, K. C., and W. Jen. 2006. “Passengers’ Perceived Service Quality of City Buses in Taipei: Scale Development and Measurement.” Transport Reviews, 26(5): 645–662.
Iseki, H., and B. D. Taylor. 2008. “Style versus Service? An Analysis of User Perceptions of Transit Stops and Stations in Los Angeles.” Proceedings of the 87th Annual Meeting
of the TRB: 13-17.
Janssens, D., G. Wets, K. Brijs, K. Vanhoof, T. Arentze, and H. J. P. Timmermans. 2006. “Integrating Bayesian Networks and Decision Trees in a Sequential Rule-Based Transportation Model.” European Journal of Operational Research, 175(1): 16-34. Jensen, F. V. 1996. An Introduction to Bayesian Networks. New York: Springer-Verlag. Karimnezhad, A., and F. Moradi. 2016. “Road Accident Data Analysis using Bayesian
Networks.” Transportation Letters: 1-8.
Kemperman, A., and H. J. P. Timmermans. 2014. “Environmental Correlates of Active Travel Behavior of Children.” Environment and Behavior, 46(3): 583-608.
Lauritzen, S L. 1995. “The EM Algorithm for Graphical Association Models with Missing Data.” Computational Statistics & Data Analysis, 19(2): 191-201.
Litman, T. 2008. “Valuing Transit Service Quality Improvements.” Journal of Public
Transportation, 11(2): 3.
Ma, T. Y. 2015. “Bayesian Networks for Multimodal Mode Choice Behavior Modelling: A Case Study for the Cross Border Workers of Luxembourg.” Transportation Research
Procedia, 10, 870-880.
Marcot, B. G., J. D. Steventon, G. D. Sutherland, and R. K. Mccann. 2006. “Guidelines for Developing and Updating Bayesian Belief Networks Applied to Ecological Modeling and Conservation.” Canadian Journal of Forestry Research, 36(12): 3063–3074. Nathanail, E. 2008. “Measuring the Quality of Service for Passengers on the Hellenic
Railways.” Transportation Research Part A, 42(1): 48-66.
Norsys Software. 2006. “Netica 3.17 for MS Windows.” Vancouver, Canada.
Nurul-Habib, K. M., L. Kattan, and T. Islaam. 2009. “Why Do the People Use Transit? A Model for Explanation of Personal Attitude towards Transit Service Quality.”
Proceedings of the 88th Annual Meeting of the TRB: 11-15.
Pearl, J. 1991. “Probabilistic Reasoning in Intelligent Systems: Networks of Plausible Inference.” San Mateo: Morgan Kaufmann.
Perucca, G., and S. Salini. 2014. “Travellers’ Satisfaction with Railway Transport: A Bayesian Network Approach.” Quality Technology and Quantitative Management, 11(1): 71-84.
Richardson, B. 2004. “Sustainable Transport: Analysis Frameworks.” Journal of Transport
Geography, 13 (3):29-39.
Scuderi, M. G., and K. J. Clifton. 2005. “Bayesian Approaches to Learning from Data: Using NHTS Data for the Analysis of Land Use and Travel Behavior.” Journal of
Transportation and Statistics, 8(3):17-21.
Strathman, J. G, T. J. Kimpel, and S. Callas. 2003. “Headway Deviation Effects on Bus Passenger Loads: Analysis of Tri-Met’s Archived AVL-APC Data.” Center for Urban Studies, Portland.
Takamiya, M., K. Yamamoto, and T. Watanable. 2010. “Modeling and Estimation of Travel Behaviors Using Bayesian Network.” Intelligent Decision Technologies, 4(4): 297-305.
Transportation Research Board. 2003. A Guidebook for Developing a Transit Performance
Measurement System. Transit Cooperative Research Program. Washington DC:
National Academy Press.
Tyrinopoulos, Y., and C. Antoniou. 2008. “Public Transit User Satisfaction: Variability and Policy Implications.” Transport Policy, 15(4): 260-272.
Wu, J., Yang, M., Li, Z., Cheng, L., and X. Hou. 2014. “Evaluating the Service Quality of Public Transit from Passengers’ Perceptions Using Bayesian Networks.” Proceedings
of the 93rd Annual Meeting of the TRB, 14-1900.
Yang, T., and L. Qian. 2012. Nanjing Transport Annual Report. Nanjing: Nanjing Urban Planning Bureau. (in Chinese)
Yilmaz, V., and H. E. Celik. 2008. “A Model for Explanation of Personal Attitudes towards Traffic of Candidate Drivers Attending Drivers’ Course: Risky Candidate Drivers’ Attitude Model.” Transportation Research Part F, 11(4): 233-241.
About the Authors
Jingxian Wu
([email protected]) is a doctoral student in Transportation Engineering Department at the School of Transportation, Southeast University. She holds bachelor’s and master’s degrees from Southeast University.Min Yang
([email protected]) is a Professor of Transportation EngineeringDepartment at the School of Transportation, Southeast University. His areas of interest include public transport, evaluation of the quality of public transport, and travel behavior.
Soora Rasouli
([email protected]) is an Assistant Professor in Urban Planning Group at the Eindhoven University of Technology. She has research interests in activity-basedmodels of travel demand, modeling of choice processes under uncertainty, and spatial analysis.
Chengcheng Xu
([email protected]) is Assistant Professor in theTransportation Engineering Department at the School of Transportation, Southeast University. Among his areas of research specialization are urban transportation planning and traffic safety.