1
Do institutions moderate globalization’s effect on growth?
ROBERT MULLINGS*
Nottingham Business School, Nottingham Trent University, Nottingham, UK
2
Abstract
The hypothesis that institutional factors affect real economic growth has received support in both the theoretical and empirical literature. Globalization has also, though not unanimously, been found to affect growth outcomes. Bridging the gap between the two strands of the literature, this paper investigates the existence and strength of the interaction between institutional quality and globalization on real economic growth using a panel dataset covering 82 countries and spanning 25 years (1986 – 2010). Dimensionality reduction techniques are employed to identify key components of ‘institutional quality’: rule of law, civil liberties and political rights. The empirical results reveal that while ‘institutional quality’ robustly and positively affects growth, the direct effect of economic globalization is not significant and the interaction effects, perhaps as a consequence, are muted over the review period. Direct and interaction effects of institutional quality and economic globalization on growth are, however, observed for the sub-sample of developing countries.
.
Key words: Globalization, Openness; Economic Growth; Institutions
3
1. Introduction
The recent turmoil in global markets has led formerly enthusiastic supporters of globalization to re-examine its benefits to the economy and society (Bhagwati, 2013). The globalization phenomenon - which can be described as “an increase in the extent to which individuals and institutions transact or exchange with others based in nation states other than their own, or otherwise influence them through their economic and social behaviour” (CEPR, 2002) - has received some blame for the dislocation following the financial crisis of 2008 and the more recent ‘Brexit’1 vote. More recently, concerns have been raised regarding the distributional effects of globalization, however questions regarding the effects of globalization on growth itself remain. The complex, multidimensional nature of globalization necessitates great care in properly accounting for its economic impact. One key area of interest in both the theoretical and empirical literature is the question: “Does globalization have a significant effect on economic growth?” In a recent paper, Grossman and Helpman (2015) outline a variety of theoretical arguments linking globalization to economic growth such as: increased capital accumulation and foreign investment, international technological spillovers and knowledge diffusion, increased scale and competition forces which underlie globalization. The authors stress the need for empirical studies to further investigate the channels through which the effects of globalization might affect the economy.
This paper attempts to make some progress towards achieving this objective by focussing explicitly on the impact of the economic dimension of globalization and poses a variant of the above question which is: “Do institutions moderate the effects of economic globalization on real economic growth?” The term “moderate” means “to interact with economic globalization in a way that discernibly or significantly alters globalization’s effect on economic growth”. From an econometric viewpoint, the hypothesis of moderating effects of institutions on globalization is inferred through the use of interaction effects (Balli and Sørensøn, 2012). Understanding the dynamics of economic globalization is a worthy objective since; among the three major dimensions of globalization (economic, social and political) the economic dimension is considered a central pillar of economic policy. Moreover, underlying economic forces often permeate the social and political spheres. Therefore, understanding the interactions between institutions and economic globalization is fundamental to grasping the broader impact of these two variables on the economy. Economic globalization is defined by Dreher (2006) as: “being characterized by long distance flows of goods, capital and services as well as
1 “Brexit” is the term used to refer to the recent referendum held in the UK on June 23, 2016 in which the majority of UK voters decided to withdraw its European Union membership.
4
information and perceptions that accompany market exchanges”. By definition therefore, the clear and far-reaching policy relevance of economic globalization, makes it an interesting candidate for the present study.
Institutions have been conceptualized by North (1981, 1990) as “a set of rules, compliance procedures, and moral and ethical behavioural norms designed to constrain the behaviour of individuals”. The empirical literature has identified numerous institutions which influence economic growth, including governance, law enforcement, justice, regulations, tax administration, and institutions that manage monetary2 and fiscal policies. The seminal paper of Acemoglu, Johnson and Robinson (2001) exemplifies the modern, economic literature linking institutions to economic development and has spurred much research on the issue (Dollar et al, 2003; Góes, 2016). The research has been aided and abetted by the emergence of datasets providing quantitative measures of institutional quality. Despite these parallel efforts linking institutions and globalization to economic growth, it is remarkable that not much research exists exploring the interaction between institutions and globalization in jointly affecting economic growth. The goal of this paper is to make a contribution towards filling this void.
Careful theoretical arguments have been made identifying the many and varied channels through which globalization could potentially impact the economy. Recently, Grossman and Helpman (2015) posits that globalization: i) integrates peoples and cultures, facilitating the flow of knowledge across borders, leading to increased productive efficiency and innovation ii) enables the integration of product markets via international trade, widening market possibilities while counterbalancing scale and competition effects iii) affects the distribution of input and output prices which in turn affects the costs of innovations and the relative attractiveness of alternative directions for industrial research iv) promotes interactions which have implications for technological diffusion. The authors state, however, that “the empirics have not kept pace” in verifying the relative importance of these channels. Interestingly, institutions have also been shown to affect the channels mentioned by Grossman and Helpman (2015) and could therefore possibly strengthen or dampen globalization’s effect (Anderlini et al, 2013; Hartman et al; 2017, Chang et al; 2009)
One key consideration in exploring the effects of economic globalization on economic growth is whether the expected effects operate through changes or levels. The question: “are countries which are
2 In fact, money itself has been recognized as an institution. Papadopoulos (2009) outlines theoretical arguments. While the arguments are persuasive, incorporating these ideas directly within the context of the current empirical analysis is beyond the scope of the current paper.
5
economically more globalized expected to grow faster?” explores the hypothesis that the level of globalization rather than the rate of change in the level of globalization is the proximate cause of real economic growth. Alternatively, one could hypothesize that changes in the level of globalization is the important causal factor driving real growth. A related issue is whether the effect of globalization, however specified, is expected to produce a long or short-run impact on real GDP growth. Ideally this ambiguity should be settled by appealing to the theoretical literature. The literature however is not explicit on the first issue. The earliest theories of trade; outline the nature, and elucidate the potential sources, of the gains from specialization and trade but do not specify how trade openness or globalization should be measured. Therefore, the ambiguity regarding whether variations in globalization levels or differences should matter for growth continues (Romer, 2010; Potrafke, 2015; Helpman, 2015). This paper adopts an agnostic approach; allowing for either specification.
Moreover, within the context of neoclassical models of the Solow- Swan tradition, one might expect a change in the level of globalization to produce a medium run growth boost due to realising gains from greater efficiency, but in the long run countries would grow in line with their long run growth path. Under a variety of new growth models, however, levels of openness could also have a potentially long run effects on a economy’s growth path – more open economies would grow faster, for reasons already stated. By this same token, one can infer that variations in the changes in globalization levels over time (first-differenced globalization) could have growth-related implications through the rate of accrual of the gains from trade due to scale and knowledge- or technology-related spillovers effects. Potrafke (2015) notes that, although the latter channel has not been sufficiently distilled in the theoretical literature, both globalization in the levels and rates of growth have been used as explanatory variables in empirical models. Sampson (2016) exemplifies a recent, theoretical contribution on this issue.
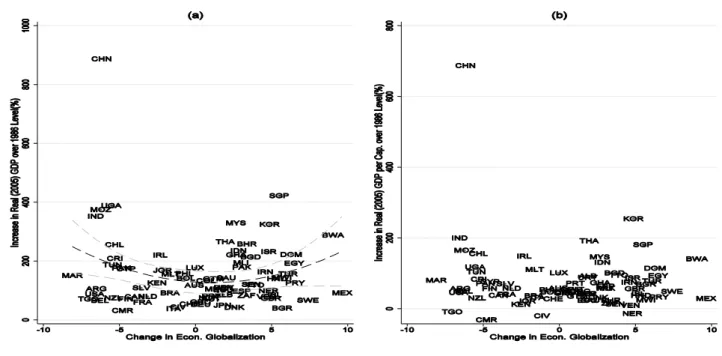
Figure 1 shows the relationship between changes in economic globalization and real GDP between the years 1986 - 2010. Economic globalization is measured using the KOH index (Dreher, 2013). The choice of globalization index is an important consideration as stated by Potrafke (2015) who emphasises the multi –dimensionality of both the KOH index and the concept of globalization as one desirable feature of the index. Another advantage is the coverage of the index since it covers 207 countries over the period of 1970 – 2013. On the other hand, the measurement of trade openness -one component of the economic globalization sub-index- of the KOH globalization index has been criticised by Pritchett (1996). Moreover, Potrafke (2015) contains a more general discussion of the shortcomings of a variety of globalization measures. Despite these shortcomings, the theoretical appeal
6
of the index, its broad coverage over the review period, its wide applicability and use make it suitable for the current analysis.
Figure 1: a) Scatterplot showing the divergent relationship between percent change in Real GDP (measured in 2005 values) and the change in economic globalization as measured by Dreher (2013) Index between the years 1986-2010. Figure b) Scatterplot showing relationship between changes in real GDP per capita (measured in 2005 values and change in economic globalization as measured by Dreher 2013 index. Source: KOH and World Development Indicators (WDI).
Figure 1: Economic Progress and Globalization 1986 – 2010
In panels (a) and (b) of the figure, the y-axis measures the change in total real value of GDP and change in real GDP per capita between 1986 and 2010 respectively. The x-axes of both panels measure the change in economic globalization as measured by Dreher (2013) index. Both panels support the notion that a highly heterogeneous relationship exists between changes in real economic growth (however measured) and changes in economic globalization between countries. Interestingly, countries like Morocco (MAR), India (IND), China (CHN), and the United States have de-globalized economically over the period of interest (1986-2010). This observation highlights the complex dynamics of globalization. A more detailed analysis reveals that while in the case of China and the USA, social globalization (not shown in the figure) has experienced strong trend increases over the period of interest, economic globalization has experienced periods of strong decline; which was the
7
case post global financial crisis in 2008. In contrast, Mexico (MEX), Botswana (BWA) and Sweden (SWE) represent counterexamples, increasing in economic globalization over the period of interest3.
Another interesting observation from Figure 1 is that there is not a simple linear relationship between the level of economic growth (however measured) and the change in globalization. Among countries that have become more economically globalized, Botswana (BWA), Singapore (SGP) and Korea (KOR) have experienced notable increases in real GDP over the period. On the other hand Bulgaria (BGR) and Sweden (SWE), despite increased openness, have not experienced such high growth rates. Among countries which have de-globalized China (CHN), Uganda (UGA) and India (IND) have experienced significantly more positive economic growth results than Morocco (MAR), Argentina (ARG) and the United States of America (USA.). Interestingly, the variation in economic growth outcomes across countries decreases markedly in the neighbourhood of the “zero” change in economic globalization mark on the x-axis towards the centre of panels (a) and (b). This result implies that there is a relatively lower dispersion in growth outcomes for countries with very small positive or negative changes in their levels of globalization over the period. The apparent heteroscedasticity conditional on the change in economic globalization in Figure 1, may imply that policies aimed at increasing or decreasing the degree of economic globalization within an economy involve risks directly related to the degree of globalization. Removing China from the sample, the spread appears relatively greater in the region of the panels depicting a greater degree in global integration. Panel (b) also reflects the within sample heterogeneity and also demonstrates that when population growth rates are taken into account, the graphical pattern of heteroscedasticity conditional of the degree of change in economic globalization- observed in panel (a) is less obvious.
Panel (a) of Figure 2 highlights the changing trends in economic globalization over the review period. The scatterplot plots the global rank of each of the 82 countries in 1986 against the analogous ranking in 2010. Note that countries were ranked using the full KOH (2013) index which also takes into account political and social dimensions of globalization. The panel reveals that there is a positive and
3
It is also worth noting that the specific time span over which the percentage changes in both economic globalization and real GDP growth are calculated would affect the appearance of the figure somewhat depending on the specific beginning and end year used. The KOF index reveals that the global financial crisis of 2007/2008 was a setback to economic globalization for many countries within the dataset. In spite of this fact analysing percentage changes in economic growth and economic globalization between 1986-2008 instead of 1986-2010, would still corroborate the finding that the USA, China and India have all globalized economically since 1986. Therefore, despite differences in the degree of de-globalization due to the choice of start and end dates, qualitatively the key points raised in the discussion are relatively robust.
8
direct relationship between the 1986 and 2010 rankings. A simple interpretation of this finding is that there is a tendency for highly globalized countries in 1986 to remain highly globalized toward the end of the sample period. This can be confirmed by the fact that most developed countries are clustered near to the origin indicating a high rank in both 1986 and 2010. Panel (a) reveals, however, that relatively greater “churning” within globalization rankings tends to occur between countries ranked in the 50 to 100 range of the rankings; a region comprised of less developed countries. The figure also reveals that the period has seen significant reversals in rankings for countries such as USA, Botswana (BWA) and South Africa (ZAF). The converse is true for Peru (PER), Mongolia (MNG), Bulgaria (BGR) and Thailand (THA) which have all become markedly and relatively more globalized.
Figure 2: a) Scatterplot showing the positive relationship between overall (international) country rank in globalization in 1986 and globalization country rank in 2010 b) Scatterplot showing the relationship between changes in overall (international) Economic Globalization Rank and changes in Institutional Quality between 1986 and 2010. Here, institutional quality is measured as the simple average of Civil Liberty (Freedom House Dataset), Political Rights (Freedom House Dataset) of the score, Law and Order score (ICRG). Source: Freedom House Dataset, International Country Risk Guide (ICRG) Dataset, KOH Dataset.
Figure 2: Global Trends in Economic Globalization and Institutional Quality 1986 – 2010
Panel (b) of Figure 2 depicts a scatterplot of the change in country rank of economic globalization between the years 1986 and 2010 and the change in institutional quality. There appears to be a positive relationship between both variables – implying that countries which have moved up the rankings on the globalization index – that have increased their relative levels of globalization - tended also to have
9
improved the quality of their institutions. This is an interesting finding which, may suggest that there may well be some interaction between changes in institutional quality and globalization.
To understand the positive relationship depicted in the diagram it is important to note that, given the coding of the institutional variables4-: i) political rights ii) civil liberties and iii) law and order – negative changes in quality of institutions as measured by the new index (average) represents an improvement in the quality of institutions. Studying the figure more closely it becomes apparent that greatest gains in institutional quality have been made by developing countries. On the other hand, the sample also captures relatively developed countries such as Cyprus (CYP), Malta (MLT) and South Korea (KOR) which have experienced significant improvements in institutional quality between 1986 and 2010. Clearly, the plot cannot establish a causal relationship between the variables institutional change and changes in globalization; the nature and direction of causality and the whether their joint distribution impacts growth outcomes are all areas of interest which this paper will now explore. One should note however that while there is a hint of positive relationship between the two variables; panel (b) of Figure 2 suggests a relatively weak one.
The available economic literature on the effect of institutions on economic growth has established a positive relationship between institutions and economic growth (Acemoglu and Robinson, 2010; Iqbal and Daly, 2014; Mauro, 1995; Rodrik et al., 2004). Sceptics of the institutional view (Sachs, 2003) emphasise the relative importance of ecology and geography over institutions in economic development. However, Nunn and Puga (2012) have taken a more nuanced stance, arguing that geography has historically played a key role in shaping institutions themselves and that this fact directly explains the income differences between countries. Regardless of the variant of the argument, the link between institutions and growth has been well established. In particular, the economic literature has identified numerous institutions which affect economic growth such as: governance, law enforcement, justice, civil liberties, regulations, tax administration and institutions that manage monetary and fiscal policies. Given the wide variety of institutions which have been found to have economic importance it is perhaps striking that the channels through which these institutions affect economic growth have not been fully explored.
4 Details about the source and coding of institutional variables can be found in Table 1. Pairwise correlations are presented in Table 2. Overall institutional quality scores used in panel (b) of Figure 2 were generated by means of a simple average of scores across all three variables with “law and order” being recoded (solely for the purposes of this diagram), to be harmonised with the coding pattern of other institutional variables. In particular, a country obtaining a lower institutional score using the index for the purposes of panel (b), Figure 2 has relatively higher quality institutions.
10
Moers (1999) has posited that a broader measure of institutions has the strongest effect on economic growth. Corroborating and extending this earlier result, Acemoglu et al. (2001, 2005, 2008) show that the quality of institutions has a stronger effect on long term growth than on growth in the short-run. Meón and Weill (2006) present evidence that institutional factors influence total factor productivity and that countries with better institutions tend to exhibit higher productivity. Empirical studies investigating the link between institutions and economic growth have also tended to use instrumental variable techniques to investigate the relationship between institutions and economic performance (Acemoglu et al., 2001; Rodrik et al., 2004). A similar approach is adopted within this paper. Unlike the strategies employed in the aforementioned papers, however, an intuitive, two-stage approach is employed to arrive at a proxy for institutional quality. The process of finding an appropriate instrument for institutional quality adopted here involves 1) a simple correlation analysis to identify summary institutional quality measures and then 2) applying dimensionality reduction techniques using key institutional variables selected from the correlation analysis in the first stage in order to generate the instrument.
Section 2, which follows, outlines the empirical strategy employed within this study to test whether institutions interact with economic globalization to affect economic growth. In Section 3, important issues such as the data sources used for the analysis and how the variables are measured are discussed in greater detail. Summary descriptive statistics and correlation analysis results are also presented in Section 3, after which estimation results for fixed effect and dynamic panel estimation are presented in Section 4. Section 5 then outlines the conclusions and policy implications of the paper.
2. Empirical Strategy
Estimation
In order to perform an empirical test of the hypothesis that institutions moderate the effect of economic globalization, this paper adopts the generalized methods of moments (GMM) method. According to Roodman (2009a), two-step system GMM estimation enables panel data model estimation in situations in which the data generating process is dynamic, as is the case with economic growth, where we expect past realizations of the dependent variable to contain information about its contemporaneous values. Moreover the GMM estimator has desirable properties in situations where there may be arbitrarily distributed country fixed effects as one is bound to expect in country panel datasets. Crucially also, the GMM estimator allows for endogeneity among the regressors, while providing the
11
additional flexibility of allowing for estimation under circumstances where there is a possibility that regressors within the model may be predetermined but not strictly endogenous. One added feature of the system GMM approach is that it obviates the need to find instrumental variables external to the model with which to control for the endogeneity. Given these merits of the system GMM approach, the estimation method is applied to the model and data since it addresses the major empirical issues associated with cross-country datasets. Formally, therefore, the empirical model estimated in this paper can be written as:
𝐺𝑟𝑜𝑖,𝑡 = 𝛾0𝑖𝑛𝑖𝑡𝐺𝐷𝑃𝑖+ 𝛾1𝐺𝑟𝑜𝑖,𝑡−1+ 𝛾2𝐼𝑛𝑠𝑡𝑖𝑡+𝛾3𝐺𝑙𝑜𝑏𝑖,𝑡+ 𝛾4𝐼𝑛𝑠𝑡𝑖𝑡∗ 𝐺𝑙𝑜𝑏𝑖,𝑡+ 𝛾4′𝐶𝑉𝑖,𝑡+ 𝑢𝑖+ 𝑣𝑖𝑡 (1)
i = 1,2,..82. and t = 1, 2….. , 5
In the equation of the dynamic model equation displayed in equation (1) - the dependent variable 𝐺𝑟𝑜𝑖,𝑡
refers to real GDP per capita growth in country i at time t. Note that i runs from 1 to 82 reflecting the fact that there are 82 countries in the sample which are individual listed in Table 1. The time index, on the other hand runs from 1 to 5, since 5 year averages of annual data collected for each country over the period 1986 – 2010 was used. The initGDP variable refers to the log of initial GDP per capita (note that this is real GDP per capita 2005 prices divided by population in year 1 of each sub-period).The time index represents 5 year averages of the time series data collected for each country between the years 1986 – 2010. The regressor 𝐺𝑟𝑜𝑖,𝑡−1 reflects the dynamic nature of the model as it is
the lagged dependent variable for each country and time period. Year dummy variables are included within our regression specifications in order to control for temporal effects. The Windmeijer (2005) finite sample correction is employed in all two-stage GMM specifications in order to mitigate the downward bias of two-step GMM standard errors.
Institutions and Economic Globalization
The 𝐼𝑛𝑠𝑡𝑖𝑡 and 𝐺𝑙𝑜𝑏𝑖,𝑡 variables in equation (1) capture the effect of the quality of institutions on real
economic growth using institutional and globalization variables respectively. Note that the institutional quality variable enters the specification of equation (1) in levels. This specification tests the hypothesis that the level or degree of institutional quality affects real per capita economic growth. The actual implementation of the model will also include among the regressors changes in institutional quality that is, the first difference of 𝐼𝑛𝑠𝑡𝑖𝑡 which is included as a robustness check of the specification
12
making allowance for a test of the hypothesis that changes in institutional quality is an additional causal factor driving economic growth. Note however that in a practical sense changes in institutional quality would reasonably, a priori, be expected to occur gradually.
Importantly, two datasets are combined to arrive at an estimate for the instrument for the set of institutional variables used in the study – The International Country Risk Guide (ICRG) dataset and the Freedom House Dataset. The political risk table of the ICRG comprises twelve (12) institutional measures which affect the political risk rating of a country. These indicators are: government stability, socioeconomic conditions, investment profile, internal conflict, external conflict, corruption, military in politics, religious tensions, law and order, ethnic tensions, democratic accountability, and bureaucracy quality. After a correlation analysis of the 12 variables from the ICRG dataset, the law and order (LO) index is retained since, LO is highly correlated with most other variables. In particular, LO’s pairwise correlations with socio-economic conditions (0.61), Internal Conflict (0.71), corruption (0.68), military in politics (0.70), and bureaucratic quality (0.71) are all high and significant. This suggests that including LO ensures that information about the various other variables highly correlated with the index will also be included – by extension- within the empirical model. The empirical specification also includes among the institutional variables civil liberties (CL) and political rights (PR) which are taken from the Freedom House dataset. The civil liberties and political rights indices were included in the specification to ensure that the extent of protection of individual freedoms and political involvement from government restriction and encroachment in each country- period was also taken into account. Moreover, in a recent paper by Alfonso-Gil and Lacalle-Calderon (2014), the authors provide persuasive empirical evidence that movements towards higher levels of civil liberty are associated with higher economic growth rates between 1850-2010.
To capture the variations in globalization, the 2013 version of the well-known KOF Index of globalization dataset by Dreher (2006) is employed. The economic globalization index from the KOF dataset is used which is comprised of two major components i) data on actual flows; such as trade flows, foreign direct investment (the sum of both inward and outward FDI), portfolio investments and income payments to foreign nationals ii) data on restrictions on flows such as; hidden import barriers, mean tariff rate, taxes on international trade and capital account restrictions. According to the author (Dreher, 2006), the rather broad- based approach, is meant to capture the degree of integration within the global economy. Both institution and globalization proxies are treated as standard endogenous variables within the two-step GMM estimation framework (Roodman, 2009a).
13
Additional control variables ( 𝐶𝑉𝑖,𝑡) are added to the model in order to capture other factors which are
noted to be related to economic growth in the literature. In particular, variables are added to capture the effect of human capital such as primary and secondary level educational attainment. Health, longevity and demographic factors are captured via the two variables: life expectancy and fertility rates. Gross savings as a percentage of GDP along with inflation are also included; with the latter variables serving as a proxy of financial stability. In addition, the share of government spending relative to GDP is also included in line with the recent academic and policy debate regarding the possible effects of the size of government and government spending on economic growth outcomes. The sources of all variables as well as their descriptive statistics are presented in Table 1. The descriptive statistics are discussed more fully in the following section.
3. Data, Measurement and Sources
Data on globalization and institutions are combined to form a panel dataset of 82 countries spanning the period 1986 – 2010, comprised of 5-year period averages of the variables. Table 1 contains a list of the countries included within the sample along with a brief description of the variables and their summary statistics.
Real GDP per capita values for the countries within the dataset were obtained from the World Development Indicators (WDI) dataset. The log of initial GDP per capita was generated by combining the 1986 value of real GDP from the WDI dataset and population figures from the same source. The gross savings rate, life expectancy and fertility variables were also sourced from the WDI. The latter two variables have featured heavily in the growth literature as key determinants of economic growth (see Weil, 2014 for a comprehensive review of the growth literature). For estimation purposes, life expectancy and fertility rates are combined (life expectancy/fertility) and logged to capture the balance in demographic changes within a country. A higher value of this variable indicates a greater degree of demographic transition.
Law and order (LO), political rights (PR) and civil liberties (CL) are the variables used to capture institutional quality. Law and order (LO) - obtained from the ICRG dataset - takes values between 1–6 (inclusive) with 6 representing the highest degree of law and order5. Civil liberties and political rights, both obtained from the Freedom House Dataset, are both measured on a scale ranging from 1–7
5 Although LO forms a single index its two elements (law and order) are each measured separately with: (i) “law” capturing the strength and impartiality of the legal system and (ii) “order” assessing the popular observance of law.
14
Table 1: Variable Descriptions, Summary Statistics and List of Countries. Variable Source Unit of
Measurement Mean Overall standard deviation Between standard deviation Within Standard Deviation Min. Max. N Real GDP per Capita Growth
WDI Per cent 1.993 2.3337 1.41 1.868 -9.534 10.40 409
Log of Initial GDP(1986) per Capita WDI Logs of 2005 values $US 8.54 2.706 2.261 1.499 0.337 15.88 409
Education Barro and Lee(2013) Principal component of perc. of Primary and perc. of Sec. School Att. -0.0437 1.2085 1.108 1.1081 -2.94 2.759 410 Log(Life Exp./Fertility) WDI log(years/birth per woman) 3.246 0.6303 0.6124 0.161 1.7112 4.2073 410 Gross-Savings (%) WDI percent of GDP 21.570 4 8.7965 7.564 4.525 1.15 55.25 401 Government Cons. PWT8 % of GDP 15.543 5.1302 4.8583 1.7457 4.135 32.73 408 Terms of Trade Growth Datamarket .com Percent growth -0.0007 0.04813 0.00246 0.0414 -0.5465 0.2674 410 Inflation IFS percent 26.016 152.7228 77.37883 131.835 -2.4258 2342.136 407 Law and Order ICRG
Dataset 1-6 (6 is the highest rating) 3.555 1.454 1.2994 0.6652 1 6 410
Political Rights Freedom House
1-7 (7 lowest
rating)
2.81 1.098 1.75 0.781 1 7 410
Civil Liberties Freedom House 1-7 (7-lowest rating) 2.99 1.656 1.54 0.627 1 7 410 Economic Globalization KOF index 5.0049 1.7244 0.8151 1.5217 0.378 9.21 410 Countries: Developed:
AUS-Australia, AUT-Austria,BEL-Belgium, CAN-Canada, CHE-Switzerland, CYP-Cyprus, DEU-Germany, DNK-Denmark, ,ESP-Spain, FIN-Finland, FRA-France, GBR- United Kingdom, GRC-Greece, IRL-Ireland, ISL-Iceland, ,ITA-Italy, JPN-Japan, KOR-Korea, , LUX-Luxembourg, MLT-Malta, NLD-Netherlands, NOR-Norway, NZL-New Zealand, ,PRT-Portugal, SGP-Singapore, SWE-Sweden, USA-United States of America Less Developed:
ALB-Albania, ARG-Argentina, BGD-Bangladesh,BGR-Bulgaria,BHR-Bahrain,BOL-Bolivia,BRA-Brazil,BWA-Botswana, , CHL-Chile, CHN-China, CIV-Cote d’ Ivoire, CMR-Cameroon, COL-Colombia, CRI-Costa Rica, DOM-Dominican, ECU-Equador, EGY-Egypt, GHA-Ghana, GTM-Guatemala, HND-Honduras,HUN-Hungary, IDN-Indonesia, IND-India, ,IRN-Iran, ,ISR-Israel, JOR-Jordan, ,KEN-Kenya, MAR-Morocco, MEX-Mexico, MLI-Mali, MNG-Mongolia,MOZ-Mozambique,MWI-Malawi,MYS-Malaysia,NAM-Namibia,NER-Niger, ,PAK-Pakistan,PAN-Panama,PER-Peru,PHL-Phillipines,PRY-Paraguay,RUS-Russia,SAU-Saudi Arabia, SEN-Senegal, ,SLV-El Salvador,
15
Table 2a. Pairwise Correlations
Table 2b. Pairwise Correlations (continued from Table 2a) Real GDP per Capita Growth Log of Initial GDP (1990) Education Log(life exp./fertility) Gross-Savings (%) Gov. Cons Institutions (Prin. Comp) Real GDP per Capita Growth 1 Log of Initial GDP(1990) 0.0571 1 Education -0.0833 -0.2736 1 Log(life exp./fertility) 0.2151 0.5139 -0.4910 1 Gross-Savings (%) 0.3532 0.2740 -0.3384 0.4434 1 Government Cons. -0.1540 0.1695 -0.3639 0.2801 0.0475 1 Institutions (Prin. Comp) 0.0544 0.3255 -0.3724 0.6827 0.1244 0.3920 1 Political Rights -0.0416 -0.2737 0.2758 -0.5768 -0.0324 -0.2519 -0.9353 Civil Liberties -0.0261 -0.2661 0.3344 -0.6101 -0.0421 -0.3054 -0.9624 Law and order 0.0863 0.3302 -0.3866 0.6165 0.3067 0.5238 0.6853 Terms of Trade Growth 0.1205 0.1026 -0.1257 0.1483 0.0867 0.0476 -0.0476 Inflation -0.2013 0.0328 0.1141 -0.0480 0.0100 -0.1015 -0.0354 Economic Globalization -0.0243 0.0670 0.0162 0.0049 -0.0079 -0.0888 -0.0416 Political Rights Civil Liberties Law and Order Terms of Trade Growth Inflation Econ. Globalization Real GDP per Capita Growth Log of Initial GDP(1990) Education Gross-Savings (%) Government Cons. Institutions Political Rights 1 Civil Liberties 0.9426 1
Law and Order -0.4129 0.0755 1
Terms of Trade Growth 0.0343 -0.1268 0.0755 1 Inflation -0.0254 -0.1268 -0.1268 -0.0286 1 Economic Globalization -0.0564 0.0124 -0.0124 -0.0040 0.0029 1
16
(inclusive) with countries enjoying the highest levels of political rights and civil liberties being ranked at 1 while countries with poor political rights and civil liberties records are ranked closer to 7.
Inflation data from the International Financial Statistics (IFS) dataset are included among the regressors as a proxy for financial stability. Primary school attainment levels - measured as a proportion of the population - is sourced from the Barro and Lee datataset (2013) and captures the notion that human capital (or skill levels) may affect economic growth; a salient point ubiquitously made in both the theoretical and empirical literature (see Benos and Zotou, 2015 for a relatively recent review). Also included among the variables is terms of trade growth is sourced from the datamarket dataset (which provides greater coverage than the WDI dataset). Terms of trade is linked to economic growth outcomes through the arguments related to the Prebish- Singer Hypothesis6 (Prebisch, 1950; Singer, 1950) or through the Harberger-Laursen-Metzler effect (Misztal, 2010; Harberger, 1950; Laursen and Metzler, 1950).
Tables 2a and 2b depict pairwise correlations between the variables included within the empirical model. In general, the correlations have the expected signs. For example, there is a positive relationship between economic growth and the savings rate; a result axiomatic of many theories of economic growth and development. Similarly per capita real economic growth is also positively correlated to terms of trade growth and the demographics variable (life expectancy/fertility rate). This is an interesting which relates to Przeworksi (2000) which presented some evidence that demographic factors affect economic growth. Przeworksi (2000) links this finding to democratic institutions; suggesting that democracies have appreciably lower birth rates (and higher life expectancy), lower population growth and thus, ceteris paribus, higher growth of GDP per capita explained by higher levels of human capital and female empowerment. More recently, An and Jeon (2006) also finds evidence of a relationship between demographic variables and economic growth.
The inflation rate - which serves as a proxy for financial stability - is negatively related to real economic growth per capita and foreign direct investment. As expected there is a strong relationship between initial GDP and the demographic variable indicating the expected strong and positive correlation between high life expectancy and GDP per capita.
6
The Prebisch-Singer hypothesis states that the relative price of primary goods and manufactured goods deteriorates over time. The Harberger-Laursen-Metzler effect postulates the negative effect of terms of trade deterioration on savings due to a decrease in real incomes.
17
On the other hand, Tables 2a and 2b also reveal seemingly counterintuitive correlations. For example, Table 2a reveals a negative correlation between the proportion of the population attaining at least a primary level of education and per capita GDP growth, which is the opposite result than would be expected in the long run. This pairwise correlation, however, is less than 1%. Interestingly too, there is a negative relationship between both political rights (PR) and civil liberties (CL) and real GDP. A negative correlation can also be observed between the following institutional variables: initial GDP, the demographic variable, government consumption and FDI. This may seem counterintuitive but is merely a function of how the variables are measured. Recall that these variables are measured with a score of “1” representing a high degree of civil liberty and political freedom. Recalling this fact, the correlations are consistent with expectations.
Of far greater concern is the unacceptably high correlation between political rights and civil liberties in the estimation sample (0.94). Including variables with such high correlations could lead to a range of problems ranging from wrong signs on coefficient estimates to lack of statistical power. This problem is overcome by employing the principal components (PCA) method in order to extract the principal component with the highest variance, orthogonal to all institutional variables resulting in one composite institutional quality variable proxy. The composite variable is henceforth referred to as “institutions” and is included among the regressors in the estimation of Equation 1. After applying the PCA methodology, it is discovered that the first principal component generated from PCA analysis captures 76.1% of the total variance and is therefore used as the institutional quality proxy. For inferential purposes, it should be noted that the institutions proxy has a high correlation with civil liberties (-0.962), political rights (-0.935) and law and order (0.686).
4. Results
Table 3a below presents the estimation results for the empirical model estimated using the panel fixed effects method and including the composite “institutions” variable. The dependent variable across all regressions is real GDP per capita growth. Column 1 of the table displays coefficient estimates of the baseline empirical model: estimated without economic globalization, proxies for institutions and without interaction effects between these variables.
A review of the signs of the coefficients in Column 1 reveals that they accord with a priori expectations. The coefficient on gross savings rate is highly statistically significant indicating that higher savings rate positively affects growth. This result is consistent with both the “neoclassical” and “new growth” flavours of the theoretical models of economic growth. Similarly, the coefficient on
18
terms of trade growth is also positively related to real GDP per capita growth and statistically significant. The coefficient on the demography variable, specified as the log of life expectancy divided by fertility rates is also positive and significant. In general, we expect more developed countries to undergo (or have undergone) demographic transition. This corroborates aforementioned findings by Przeworksi (2000) and An and Jeon (2006).
On the other hand, the results of the fixed effect panel regression in Column 1 reveal that higher levels of government spending and inflation (which represents a proxy for financial instability) have a negative and statistically significant effect on real GDP per capita growth. In contrast, education does not have a statistically significant effect on real GDP per capita growth. The estimation results depicted in Column 2 of Table 3a reveal that adding economic globalization to the model does not change the sign and significance of the variables included in specification presented in Column 1. Moreover, the coefficient on the newly included regressor is not statistically significant implying that there are limited effects of economic globalization on the real GDP per capita growth within our sample.
The specification of the model in Column 3 includes, along with the globalization variable, the proxy for institutional quality among the regressors. The institutional quality variable is entered with a lag to capture the idea that changes in institutions can have a delayed impact on the economy. Note the loss of one observation for each country due to the use of the lag of the institutions variable. Column 3 reveals thatthe institutions variable (as measured by the first principal component of all the institution variables) is positively related to real GDP per capita growth. The high level of statistical significance of the coefficient reinforces a priori expectations that good institutions are favourable to economic growth. Recalling that the ‘institutions’ variable was constructed such that it is positively related to rule of law and negatively related to civil liberties (CL) and political rights (PR). It can therefore be inferred from the results that, ceteris paribus, strengthening institutions in favour of the rule of law has had a positive effect on real GDP per capita growth.
The specification presented in Column 4 includes a multiplicative interaction term derived by multiplying the level of globalization by the institutional quality proxy. The statistical insignificance of the resulting coefficient suggests that institutional quality and economic globalization do not interact to affect real GDP per capita economic growth within the sample. In Column 5, the additional variable: change in globalization (∆Econ Glob) attempts to capture the possible effects of the first difference of
19
Table 3a: Fixed Effects Estimates: Full Sample Estimation Method FE Estimation (1) FE Estimation (2) FE Estimation (3) FE Estimation (4) FE Estimation (5) FE Estimation (6) FE Estimation (7) FE Estimation (8) Initial GDP -0.0438 (0.059) -0.046 (0.0584) -0.0183 (0.0672) -0.01886 (0.067) -0.0205 (0.0667) -0.0830 (0.066) -0.0802 (0.0653) -0.0834 (0.066) Education 0.4096 (0.2947) 0.4141 (0.298) 0.2778 (0.3506) 0.2766 (0.3508) 0.2809 (0.349) -0.1014 (0.3844) 0.1123 (0.3885) 0.0935 (0.386) Log(life exp./fertility) 2.569*** (0.984) 2.776*** (0.995) 1.372 (1.4072) 1.376 (1.41) 1.465 (1.419) 6.544*** (1.504) 6.635*** (1.55) 6.469*** (1.479) Inflation -0.0041*** (0.0009) -0.0041*** (0.0009) -0.0062 (0.0047) -0.0062 (0.0048) -0.0059 (0.0048) -0.027*** (0.006) -0.0272*** (0.0061) -0.027*** (0.006) Gross Sav. (%) 0.0763*** (0.02445) 0.0767*** (0.0246) 0.0928*** (0.0276) 0.0929*** (0.0277) 0.091*** (0.0272) 0.0902*** (0.0321) 0.0902** (0.0321) 0.091*** (0.0325) Government Cons. -0.2039*** (0.0746) -0.2057*** (0.0753) 0.1251 (0.0985) -0.1255 (0.1) -0.1334 (0.0997) -0.1724** (0.0827) -0.1683** (0.823) -0.1733** (0.0845) Terms of Trade Growth 7.625*** (2.123) 7.704*** (2.129) 7.829*** (2.392) 7.832*** (2.396) 7.703*** (2.384) 7.6330*** (2.539) 7.47*** (2.598) 7.699*** (2.592) Economic Globalization - 0.0262 (0.0555) -0.0053 (0.059) -0.0055 (0.0589) 0.0726 (0.0897) 0.0556 (0.1227) 0.0595 (0.123) 0.0483 (0.122) Institutions: lag Prin. Comp. - - 0.7159*** (0.2536) 0.7318** (0.2933) 0.687 (0.2563) 0.524 (0.335) 0.4989 (0.34) 0.494 (0.338) Glob* Institutions - - - -0.0035 (0.0369) - - - - ∆ 𝐸𝑐𝑜𝑛 𝐺𝑙𝑜𝑏 - - - - -0.0713*** (0.0622) 0.524 (0.335) -0.0993 (0.0654) -0.0993 (0.063) ∆ 𝐼𝑛𝑠𝑡𝑖𝑡𝑢𝑡𝑖𝑜𝑛𝑠 - - - - -0.306 (0.2015) -0.383* (0.235) -0.3064 (0.2043) ∆(EconGlob* 𝐼𝑛𝑠𝑡) - - - -0.0169 (0.0227) - ∆ Econ. Glob* ∆ Inst - - - -0.0571 (0.0995) Within 0.2595 0.2599 0.2521 0.2521 0.2556 0.3459 0.3475 0.3473 Between 0.1961 0.1964 0.0604 0.0606 0.0648 0.0196 0.0196 0.0205 Overall 0.1792 0.1796 0.0947 0.0948 0.0987 0.0285 0.0283 0.0296 Sample Size 399 399 324 324 324 243 242 242
Notes: *** Means statistically significant at the 1% level **means statistically significant at the 5% level * means statistically significant at the 10* level
economic globalization on real, per capita GDP growth. The variable is both negative and statistically significant at the 1% level of significance, implying that, in general, countries advancing at a faster rate towards globalization have possibly experienced lower growth levels. However, this result is not robustly supported across the remaining specifications in in which (∆Econ Glob) is included.
Columns 6 -8 of Table 3a add the variables i) ∆Institutions ii) ∆(EconGlob* 𝐼𝑛𝑠𝑡𝑖𝑡𝑢𝑡𝑖𝑜𝑛𝑠) and iii)
∆EconGlob*∆Institutions respectively. None of these variables, when added to the set of regressors are statistically significant in explaining real GDP per capita growth. Both the ∆Institutions variable and interaction effects - however specified - are statistically insignificant. Notably, the overall R-squared for the regressions including the new variables are relatively smaller in magnitude than the R-squared
20
values of displayed in Columns 1-5. While results of Columns 5 suggest a negative effect on changes in globalization on real per capita growth the low R-squared value suggests poor explanatory power. In sum, therefore, fixed effect regression analysis provides very little evidence that institutions interact with economic globalization to affect real GDP growth.
Table 3b: Fixed Effects Estimates: Developing Country Sub -sample Estimation Method FE Estimation (1) FE Estimation (2) FE Estimation (3) FE Estimation (4) FE Estimation (5) FE Estimation (6) FE Estimation (7) FE Estimation (8) Initial GDP -0.0861 (0.076) -0.086 (0.0757) -0.0434 (0.0808) -0.0607 (0.0782) -0.0438 (0.0809) -0.1187 (0.078) -0.1254 (0.0768) -0.1186 (0.0782) Education 0.418 (0.452) 0.418 (0.298) 0.386 (0.4021) 0.3539 (0.4157) 0.3658 (0.3996) 0.0779 (0.5025) 0.0828 (0.5034) 0.08 (0.505) Log(life exp./fertility) 1.243 (1.694) 1.243 (1.694) -1.1931 (2.114) -1.071 (2.118) -1.05 (2.156) 1.806 (2.061) 1.4925 (2.02) 1.771 (2.060) Inflation -0.0036*** (0.0009) -0.0036*** (0.0009) -0.0056 (0.0045) -0.0053 (0.0046) -0.0053 (0.0046) -0.0155*** (0.005) -0.0146** (0.0057) -0.0154 (0.0053) Gross Sav. (%) 0.0506* (0.0272) 0.0507* (0.028) 0.0617** (0.0292) 0.0617*** (0.0291) 0.0607** (0.029) 0.0456 (0.0327) 0.0433 (0.0323) 0.0462*** (0.0332) Government Cons. -0.1626** (0.081) -0.1628* (0.0824) -0.0797 (0.1031) -0.0871 (0.1034) -0.089 (0.1060) -0.1075 (0.0816) -0.1211 (0.0847) -0.108 (0.0829) Terms of Trade Growth 7.618*** (2.336) 7.625*** (2..336) 8.713*** (2.475) 8.589*** (2.438) 8.592*** (2.493) 7.561*** (2.656) 7.613*** (2.526) 7.595*** (2.697) Economic Globalization - 0.0027 (0.078) -0.076 (0.0806) -0.1653 (0.105) 0.0154 (0.139) -0.044 (0.161) -0.038 (0.159) -0.0483 (0.16) Institutions: lag Prin. Comp. - - 0.7657*** (0.276) 1.208** (0.4413) 0.7372** (0.2781) 0.2553 (0.3313) 0.2698 (0.3159) 0.245 (0.338) Glob* Institutions - - - -0.0943 (0.0722) - - - - ∆ 𝐸𝑐𝑜𝑛 𝐺𝑙𝑜𝑏 - - - - -0.0745 (0.088) -0.0759 (0.0872) -0.1189 (0.1023) -0.0737 (0.0851) ∆ 𝐼𝑛𝑠𝑡𝑖𝑡𝑢𝑡𝑖𝑜𝑛𝑠 - - - -0.2523 (0.1834) -0.0712 (0.2617) -0.253 (0.1842) ∆(EconGlob* 𝐼𝑛𝑠𝑡) - - - -0.0364 (0.0227) - ∆ Econ. Glob* ∆ Inst - - - -0.02168 (0.095) Within 0.2824 0.2824 0.3149 0.3207 0.318 0.3353 0.3396 0.3357 Between 0.1410 0.1410 0.0004 0.0016 0.0022 0.1393 0.1322 0.1392 Overall 0.2081 0.2081 0.094 0.1026 0.105 0.1841 0.1865 0.1848 Sample Size 268 268 218 218 218 163 163 163
Notes: *** Means statistically significant at the 1% level **means statistically significant at the 5% level * means statistically significant at the 10* level
Table 3b mirrors the regression specifications shown in Table 3a. However, Table 3b restricts the dataset to developing countries only. A list of developing countries within the sample is depicted in Table 1 and is based on the International Monetary Fund (IMF) classification. The estimates of the most naïve specification presented in Column 1 of Table 3b reveals that savings and terms of trade growth are both statistically significant and positively related to real per capita GDP growth while
21
inflation and government spending are both statistically significant and have the opposite effect, fully corroborating results from Table 3a on the full dataset.
Qualitatively, the statistical importance of the demographic variable in affecting the real GDP per capita outcome differs between the full and developing country sub-sample. Recall that Columns 1, 2, 6, 7 and 8 of Table 3a depict positive and statistically significant coefficients for the demographic variable which starkly contrast the results of Table 3b. This result suggests that variations in life expectancy relative to fertility rates were not influential in explaining growth outcomes in developing countries over the review period. Furthermore, none of the coefficients on globalization-related variables are statistically significant in Table 3b. This is fairly consistent with the result in Table 3a. Gross savings as a percentage of GDP is statistically significant and positively signed in the restricted sample of developing countries across most specifications of Table 3b as in Table 3a.
Higher savings rates therefore support growth in both developed and developing countries. Similarly, the negative sign on the government consumption coefficient across all specifications in Table 3b matches closely earlier findings in Table 3a. The institutional quality variable is again statistically significant and positive in Columns 3 and 4 of Table 3b, mirroring the earlier results. The coefficient is also robustly significant when the change in economic globalization variable is added in Column 5 implying that institutional quality is marginally more crucial factor in determining growth outcomes in less developed economies.
Table 4a presents analogous, two-step dynamic panel system-GMM estimates. Estimating the model using the system GMM approach offers the advantage of allowing for endogeneity between independent variables and the real per capita economic growth. As described by Roodman (2009a), the GMM method achieves this goal by using variables internal to the model as instruments. In order to capture the dynamics within the sample lagged of real per capita GDP growth is now included among the regressors and is treated as a predetermined variable. Two-step GMM was used to estimate the model’s coefficients and the Windmeijer (2005) correction has been applied to all standard errors presented in both Tables 4a and Table 4b. Institutional quality and economic globalization are treated as potentially endogenous variables under the GMM specification and the maximum lag-length of three is chosen to avert the problem of instrument proliferation and its undesirable consequences (see, for example, Roodman, 2009b).
Column 1 of Table 4 mirrors closely the specification used for the corresponding columns of Tables 3a and 3b. The coefficient estimate on the newly introduced lagged dependent variable is statistically
22
significant at the 5% level indicating that its inclusion is justified. In addition, the coefficient on the gross savings variable is statistically significant at the 1% level, corroborating earlier results that the gross savings variable is a positive and statistically significant determinant of real GDP per capita growth. Both sign and magnitude of the coefficient estimate on the gross savings coefficient matches the results from the fixed effect estimates of Tables 3a and 3b. The finding that both lagged real GDP growth per capita and savings are fairly robust, statistically significant determinants of real GDP per capita growth is robust across most specifications in Table 4a.
Column 1 of the table also reveals statistically significant coefficients for terms of trade growth and government consumption variables. These empirical results corroborate earlier findings that terms of trade growth is statistically significant and positively related to real GDP per capita economic growth whereas government share of spending has the opposite effect. The latter result implies a possible “crowding-out effect” in economies in which excessive government participation has a negative effect on real per capita growth. This finding is consistent with empirical results by Afonso and Fucuri (2008) and Folster and Henrekson (2001) who build on Barro’s (1990) model which implies that as the size of government increases: distortionary effects due to high taxes and public burrowing, diminishing returns on public capital, rent seeking and bureaucratic inefficiencies tend to dominate.
Columns 2-8 also support the finding of a negative and highly statistically significant relationship between increased government spending and real GDP growth per capita growth. The coefficient on the terms of trade growth variable also exhibits a robustly positive effect on real GDP per capita growth. This supports the hypothesis that increasingly favourable terms of trade have a positive and significant effect on real per capita economic growth and corroborates earlier findings. Demographic factors also appear to be statistically significant for certain specifications of the model (Columns 5 and 7) when regression results are based on the complete sample.
Addressing the results for the two key variables of interest - economic globalization and institutional quality - Table 4a reveals that the institutional quality variable is also statistically significant for the specifications of the model depicted in Columns 3, 5 and 8. The positive sign of the coefficient implies that institutional quality is positively related to real per capita GDP growth corroborating the earlier results from the fixed effects specification. Interestingly, it can be observed that while the positive sign of the coefficient on institutional quality is mostly positive across all specifications of the model, the statistical significance of the coefficient varies. Overall, the results suggest a statistically significant role for institutional quality in affecting real GDP per capita growth. On the other hand, the
23
Table 4a: System GMM Estimates: Dynamic Estimation – Full Sample Estimation Method Two Step SYS-GMM (1) Two Step SYS-GMM (2) Two Step SYS-GMM (3) Two Step SYS- GMM (4) Two Step SYS-GMM (5) Two Step SYS-GMM (6) Two Step SYS-GMM (7) Two Step SYS-GMM (8) Lag of Real GDP
per Capita Growth
0.1911** (0.0888) 0.1818* (0.0928) 0.1537** (0.0766) 0.1882** (0.084) 0.1533** (0.0759) 0.1973** (0.0907) 0.2632** (0.1145) 0.2125** (0.099) Initial GDP -0.0631 (0.0670) -0.0814 (0.0617) -0.0819 (0.065) -0.071 (0.0673) -0.0718 (0.0646) -0.0750 (0.0894) -0.012 (0.0831) -0.0449 (0.0688) Education -0.0014 (0.1667) 0.037 (0.189) 0.006 (0.196) -0.043 (0.1774) -0.0381 (0.2032) 0.1883 (0.2523) 0.0791 (0.2811) 0.1347 (0.3068) Log(life exp./fertility) 0.3386 (0.2787) 0.4021 (0.2771) -1.25 (0.8275) -1.1937 (0.801) -1.735** (0.7572) -1.2473 (1.0975) -1.569 (1.086) -1.402* (0.800) Inflation 0.0633 (0.0234) 0.0006 (0.003) -0.0001 (0.0031) 0.0731 (0.028) -0.0005 (0.0031) 0.00015 (0.0023) -0.0204* (0.0417) -0.0018 (0.003) Gross Sav. (%) 0.0633*** (0.0234) 0.0656*** (0.0229) 0.0696** (0.029) 0.0731** (0.028) 0.0715** (0.0312) 0.0541 (0.0308) 0.071* (0.0417) 0.07 (0.0491) Government Cons. -0.108*** (0.0282) -0.1017*** (0.0316) -0.166*** (0.0394) -0.1592*** (0.0357) -0.1804*** (0.0468) -0.108* (0.055) -0.1674*** (0.0583) -0.1580*** (0.0553) Terms of Trade Growth 21.41** (9.26) 20.12** (9.734) 20.3112*** (7.323) 21.302*** (8.058) 21.931*** (7.488) 23.007** (10.01)) 8.533 (15.74) 8.35 (8.616) Economic Globalization - 0.112 (0.2813) 0.1114 (0.218) 0.0301 (0.0865) 0.1545 (0.1387) -0.04 (0.184) 0.0224 (0.266) -0.261 (0.2473) Institution: lag Prin.
Comp. - - 1.061** (0.439) -0.9192 (0.8014) 1.295*** (0.378) 0.6251 (0.5703 0.8099 (0.7084) 0.874* (0.5221) Glob * Institutions - - - 0.0123 (0.137) - - - - ∆ 𝐸𝑐𝑜𝑛 𝐺𝑙𝑜𝑏 - - - - -0.0704 (0.101 0.0304 (0.118) -0.0453 (0.142) 0.021 (0.133) ∆ 𝐼𝑛𝑠𝑡𝑖𝑡𝑢𝑡𝑖𝑜𝑛𝑠 - - - -1.995** (0.7581) -1.672 (1.424) -0.796 (1.084) ∆(EconGlob* 𝐼𝑛𝑠𝑡.) - - - -0.0109 (0.0675) - ∆ Econ. Glob* ∆ Inst. - - - -0.6702* (0.3751) No. of Instruments 22 29 46 52 47 43 42 54 AR1: p-value 0.003 0.009 0.003 0.001 0.002 0.000 0.001 0.000 AR2: p-value 0.16 0.236 0.272 0.253 0.325 0.935 - 0.430 Hansen J-Test 0.10 0.256 0.189 0.107 0.142 0.353 0.11 0.184
Notes: *** Means statistically significant at the 1% level **means statistically significant at the 5% level * means statistically significant at the 10* level
coefficients on the economic globalization variables across all specifications are again mostly statistically insignificant.
Table 4b below presents system GMM estimates for the restricted sample of developing countries. The results follow a similar pattern to those presented in Table 4a. Overall, the table corroborates earlier
24
findings that the important variables driving real GDP growth outcomes across the developing country sample are: i) terms of trade growth, which has a positive and statistically significant effect and ii) government consumption which is highly significant across all specifications but has a negative effect on real GDP per capita growth. While the coefficient on the institutional quality variable proved to be statistically significant and positively signed for only some specifications of the empirical models depicted in Tables 3a, 3b and 4a, the coefficient is highly statistically significant and positively signed across all specifications of the models results in Table 4b. This result highlights the critical importance of good institutions for real per capita economic growth in developing countries. Remembering that the proxy for institutional quality bears a strong positive correlation to law and order and is strong negatively correlated to political rights and civil liberties we can infer that, within the sample, countries which have seen improvements in the quality of the institutions favouring the rule of law have tended to realize significantly more favourable outcomes in terms of real growth per capita.
By way on contrast, it is noteworthy that the coefficient on the economic globalization variable, expressed in levels is statistically insignificant across all specifications, except in Column 7 of the table, again emphasizing that institutional quality appears to play a superior role to economic globalization in influencing the growth outcomes of developing countries.
The differenced institutional quality variable, which in introduced in Column 6, is also statistically significant across specifications in Columns 6-8 of Table 4b. Interestingly, all the coefficients have negative signs which indicate that changes in institutional quality or in the balance between the rule of law, political rights and civil liberties can have a statistically significant effect on real GDP per capita growth.
While the results of Table 4b imply that the level of economic globalization does not play an important role for real growth per capita for the developing country sub-sample, the differenced economic globalization variable, for the first time, is statistical significant in the specification displayed in Column 8 of the Table at the 5% level. This result however is not robustly returned across alternative specifications. In addition, Table 4b reveals that, for developing countries, the interaction effects of institutional quality and economic globalization have a statistically significant effect on real GDP per capita across all specifications where these interaction effects between institutional quality and globalization have been included.
25
Table 4b: System GMM Estimates: Dynamic Estimation – Developing Country Sub-sample Estimation Method Two Step SYS-GMM (1) Two Step SYS-GMM (2) Two Step SYS-GMM (3) Two Step SYS GMM (4) Two Step SYS- GMM (5) Two Step SYS- GMM (6) Two Step SYS- GMM (7) Two Step SYS- GMM (8) (done) Lag of Real GDP
per Capita Growth
0.1264* (0.074) 0.1089 (0.0725) 0.137* (0.0783) 0.1681* (0.0873) 0.1005 (0.0743) 0.1456* (0.076) 0.1642** (0.083) 0.153* (0.083) Initial GDP -0.0955 (0.0921) -0.10 (0.095) 0.0638 (0.0759) -0.021 (0.0777) 0.0347 (0.0894) 0.053 (0.099) -0.0828 (0.0819) 0.095 (0.081) Education -0.1214 (0.152) -0.12 (0.239) -0.3255 (0.2377) 0.3770** (0.161) 0.2185 (0.2199) 0.411* (0.224) 0.3553 (0.216) 0.2653 (0.0.204) Log(life exp./fertility) 0.974** (0.414) 0.8262** (0.407) -0.651 (0.913) 0.419 (0.6242) -0.3202 (0.5054) -0.223 (0.609) -0.1768 (0.5967) -0.3122 (0.0.696) Inflation -0.0004 (0.005) 0.0017 (0.003) -0.0017 (0.0042) 0.0003 (0.005) -0.0019* (0.0011) -0.0006 (0.0011) -0.0014 (0.0013) -0.0013 (0.0021) Gross Sav. (%) 0.012 (0.0267) 0.0284 (0.0339) 0.0429 (0.0355) 0.0107 (0.0391) 0.0385 (0.041) 0.029 (0.0453) 0.033 (0.0395) 0.0234 (0.0459) Government Cons. -0.075** (0.0347) -0.0657* (0.0339) -0.086* (0.0435) -0.0918** (0.0419) -0.090** (0.0387) -0.0897** (0.0364) -0.062* (0.034) -0.073** (0.032) Terms of Trade Growth 12.984** (6.165) 17.469*** (5.907) 9.101* (4.834) 12.354* (6.97) 13.003** (4.869) 8.90** (4.26) 6.83* (3.965) 10.68* (6.04) Economic Globalization - 0.239 (0.352) -0.1787 (0.305) -0.4183 (0.2914) -0.354 (0.302) -0.256 (0.229) -0.425** (0.1952) -0.301 (0.0163) Institutions: lag Prin. Comp. - - 1.058** (0.518) 1.091*** (0.3207) 1.132*** (0.199) 0.6501*** (0.19) 0.5656*** (0.1877) 0.6563*** (0.2197) Glob * Institutions - - - -0.2002** (0.0945) - - - - ∆ 𝐸𝑐𝑜𝑛 𝐺𝑙𝑜𝑏 - - - - -0.0895 (0.166) 0.0474 (0.121) 0.261 (0.1939) 0.0163** (0.147) ∆ 𝐼𝑛𝑠𝑡𝑖𝑡𝑢𝑡𝑖𝑜𝑛𝑠 - - - -1.30*** (0.428) -2.087* (0.6708) -1.334** (0.529) ∆(EconGlob* 𝐼𝑛𝑠𝑡 ) - - - 0.1698* (0..092) - ∆ Econ. Glob* ∆ Inst - - - -0.1536* (0.131) No. of Instruments 36 37 34 43 39 49 50 47 AR1: p-value 0.026 0.016 0.007 0.006 0.003 0.000 0.000 0.001 AR2: p-value 0.105 0.185 0.227 0.437 0.587 0.691 0.741 0.898 Hansen J-Test 0.46 0.536 0.86 0.478 0.60 0.676 0.59 0.57
Notes: *** means statistically significant at the 1% level **means statistically significant at the 5% level * means statistically significant at the 10* level
Overall therefore, the weight of the empirical evidence across both fixed effects and dynamic GMM panel estimation results indicate that the quality of institutions rather than economic globalization is a relatively more important and robust causal factor driving real growth outcomes after accounting for endogeneity. This result holds when the model is applied to both the general dataset and in the developing country sub-sample. Regarding interaction effects between economic globalization and institutions, the empirical evidence presented here is not supportive of the hypothesis that the variable


![3,14 Dimethyl 2,6,13,17 tetraazatricyclo[16 4 0 07,12]docosane–(naphthalen 1 yl)methanol (1/2)](data:image/gif;base64,R0lGODlhAQABAIAAAP///wAAACH5BAEAAAAALAAAAAABAAEAAAICRAEAOw==)