The Low-Income Housing
Tax Credit Program at Year 25:
An Expanded Look at
Its Performance
A CohnReznick LLP Report
DeCembeR 2012
This is the second in a series of periodic reports issued by CohnReznick LLP that addresses the performance of properties financed with low-income housing tax credits (housing tax credits). The housing tax credit program was enacted as a way to stimulate the develop-ment of affordable housing for low- to moderate-income families. Over the past 26 years, the program has been studied by various interested parties such as the General Accounting Office (GAO) and various congressional oversight committees to determine whether:
• The program was meeting the original intent of Congress
• The program should be made permanent
• The program could be made more efficient.
Given the scrutiny that federal income tax expenditures are undergoing, this is an appro-priate time to examine whether housing tax credit properties are meeting their financial obligations and the needs of the markets they serve. While the report was not undertaken for this particular purpose, the data collected provides most of the information that would be required to assess the housing tax credit program. To compile and analyze the data required for the assessment, CohnReznick requested the participation of 40 investment sponsors and the nation’s largest institutional investors. Nearly every sponsor of housing tax credit investments, and many of the nation’s largest investors, participated in the survey. For a complete list of study participants, please refer to Appendix A. With the assis-tance of Integratec, our affiliated real estate services and software solutions company, CohnReznick examined data collected from the financial statements of 17,118 apartment properties. While CohnReznick examined operating data for every housing credit property without regard to the year in which the property was placed in service, focus was on the manner in which housing credit properties performed during the economic downturn from 2008 to 2010. For a more extensive discussion of the methodology employed to collect and analyze property data, please refer to Appendix B.
This report represents an expansion of CohnReznick’s first housing credit property study that was published in August 2011. A phased approach allowed CohnReznick to supply much needed recent industry data while still operating within the timeframe necessary to perform a current yet increasingly rigorous analysis of the data collected. In addition to the inclusion of 800 additional properties, the enclosed report contains an expanded analysis of the August 2011 study and provides:
• Additional analysis of the various trends CohnReznick identified in different parts of the country
• Fundamental reasons why the housing tax credit portfolio exhibited better financial results in 2008–2010 and why certain properties underperform
• How the performance of housing tax credit funds has improved for the benefit of investors over the years.
We are grateful to the many firms that supported CohnReznick’s effort in promoting a deeper understanding of the housing tax credit program, its strengths, opportunities for improvement and the critical role the program plays in the development of affordable housing.
CohnRezniCk LLP
December 2012The initial report on the performance of low-income housing tax credit properties (“The Low-Income Housing Tax Credit Program at Year 25: A Current Look at its Performance”) was published by Reznick Group, P.C. in August 2011. In October 2012, Reznick Group, P.C. combined with J.H. Cohn, LLP to form CohnReznick, LLP, which is now the 11th largest accounting, tax and advisory firm in the United States. Accordingly, this follow-up report is issued by CohnReznick, LLP.
CohnReznick has used information gathered from the housing credit industry participants listed in Appendix A to compile this study. The information provided to us has not been independently tested or verified. As a result, we have relied exclusively on the study partici-pants for the accuracy and completeness of their data. No study can be guaranteed to be 100% accurate, and errors can occur. CohnReznick does not warrant the complete-ness or the accuracy of the data submitted by study participants and thus does not accept responsibility for your reliance on this report or any of the information contained herein. The information contained in this report includes estimations, approximations and assumptions and is not intended to be legal, accounting or tax advice. Please consult a lawyer, accountant or tax advisor before relying on any information contained in this report. CohnReznick disclaims any liability associated with your reliance on any information contained herein.
To ensure compliance with the requirements imposed by the IRS, we inform you that any U.S. federal tax advice contained in this communication (including any attachments) is not intended or written to be used, and cannot be used, for the purpose of (i) avoiding penal-ties under the Internal Revenue Code or (ii) promoting, marketing or recommending to another party any transaction or matter addressed herein.
Table of Contents
Chapter 1: Executive Summary
. . . 7Chapter 2: Portfolio Performance
. . . 132.1.
Physical Occupancy
. . . 152.2.
Debt Coverage Ratio
. . . 162.3.
Per-Unit Cash Flow
. . . 172.4.
Possible Explanations for Improved
Financial Metrics
. . . 18Chapter 3: Portfolio Performance by Segments
. . . 253.1.
Segmentation Analysis – by Property Age
. . . 253.2.
Segmentation Analysis – by Property Size
. . . 273.3.
Segmentation Analysis – by Investment Type
. . . 283.4.
Segmentation Analysis – by Credit Type
. . . 293.5.
Segmentation Analysis – by Development Type
. . . 303.6.
Segmentation Analysis – by Tenancy Type
. . . 313.7.
Geographic Segmentation Analysis
. . . 313.7.1 Geographic Segmentation Analysis – by Region
. . . . 323.7.2. Geographic Segmentation Analysis – by State
. . . 363.7.3 Geographic Segmentation Analysis
– by Top 10 MSAs
. . . 39Chapter 4: Nonperforming Properties
. . . 424.1.
Operating Underperformance
. . . 434.1.1. Underperformance in 2010
. . . 434.1.2. Historical Trend (2008–2010)
. . . 454.1.3. Chronic Underperformance
. . . 464.1.4. Magnitude of Underperformance
. . . 474.1.5. Underperformance – by State
. . . 494.2.
Foreclosure
. . . 544.3.
Technical Underperformance
. . . 56Chapter 5: Fund Investment Performance
. . . 575.1.
Introduction
. . . 575.2.
Fund Yields
. . . 595.3.
Yield Variance Analysis
. . . 60Chapter 6: Portfolio Composition
. . . 646.1.
Portfolio Composition – by Property Age
. . . 646.2.
Portfolio Composition – by Property Size
. . . 656.3.
Portfolio Composition – by Investment Type
. . . 676.4.
Portfolio Composition – by Credit Type
. . . 686.5.
Portfolio Composition – by Development Type
. . . 686.6.
Portfolio Composition – by Tenancy Type
. . . 696.7.
Portfolio Composition – by Region
. . . 706.8.
Portfolio Composition – by State
. . . 726.9.
Portfolio Composition – by MSA
. . . 72Appendices:
. . . 74Appendix A. Acknowledgments
. . . 74Appendix B. Survey Methodology
. . . 75Appendix C. Glossary
. . . 80Appendix D. Property Performance – by State
. . . 82Appendix E. Property Underperformance – by State
. . . 84FiguRe 2.0.1 Overall Portfolio Composition . . . 14
FiguRe 2.0.2 Overall Portfolio Performance (2008–2010) . . . 15
FiguRe 2.0.3 Overall Portfolio Performance (2008–2010) – Comparison of August 2011 and Current Report . . . 15
FiguRe 2.1 Median Physical Occupancy (2008–2010) . . . 16
FiguRe 2.2 Median Debt Coverage Ratio (2008–2010) . . . 17
FiguRe 2.3 Median Per-Unit Cash Flow (2008–2010) . . . 18
FiguRe 2.4.1 Net Equity Price by Year Placed in Service . . . 19
FiguRe 2.4.2 Net Equity Price vs. Hard Debt Ratio by Year Placed-in-Service – 9% Housing Tax Credit Properties . . . 20
FiguRe 2.4.3 Net Equity Price vs. Hard Debt Ratio by Year Placed-in-Service – 4% Housing Tax Credit Properties . . . 21
FiguRe 2.4.4 Hypothetical Housing Tax Credit Project Debt Service Calculation . . . 21
FiguRe 3.1.1(A) 2010 Median Physical Occupancy by Year Placed-in-Service . . . 25
FiguRe 3.1.1(b) 2010 Median Debt Coverage Ratio by Year Placed-in-Service . . . 26
FiguRe 3.1.1(C) 2010 Median Per Unit Cash Flow by Year Placed-in-Service . . . 26
FiguRe 3.1.1(D) 2008/2009 Median Debt Coverage Ratio by Year Placed-in-Service . . . 27
FiguRe 3.1.1(e) 2008/2009 Median Per Unit Cash Flow by Year Placed-in-Service . . . 27
FiguRe 3.2 Operating Performance by Project Size . . . 28
FiguRe 3.3 Operating Performance by Investment Type . . . 29
FiguRe 3.4 Operating Performance by Credit Type . . . 30
FiguRe 3.5 Operating Performance by Development Type . . . 30
FiguRe 3.6 Operating Performance by Tenancy Type . . . 31
FiguRe 3.7.1 Portfolio Distribution by Region . . . 32
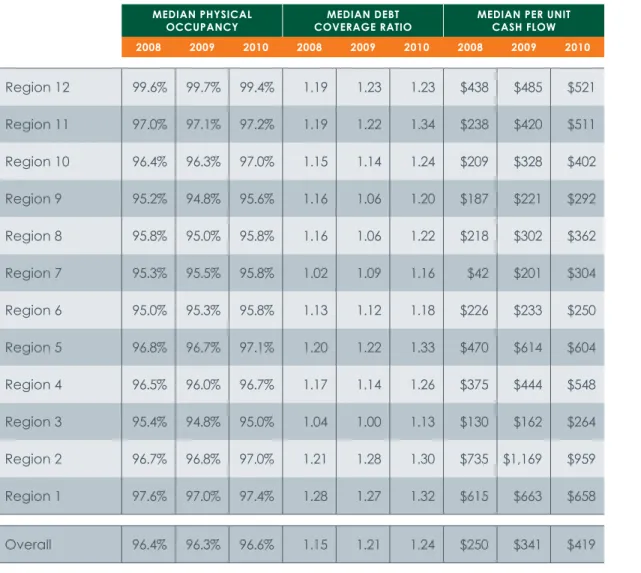
FiguRe 3.7.1(A) Operating Performance by Region . . . 33
FiguRe 3.7.1(b) 2010 Median Physical Occupancy by Region . . . 34
FiguRe 3.7.1(C) 2010 Median Debt Coverage Ratio by Region . . . 35
FiguRe 3.7.1(D) 2010 Median Per Unit Cash Flow by Region . . . 36
FiguRe 3.7.2(A) 2010 Median Physical Occupancy by State . . . 37
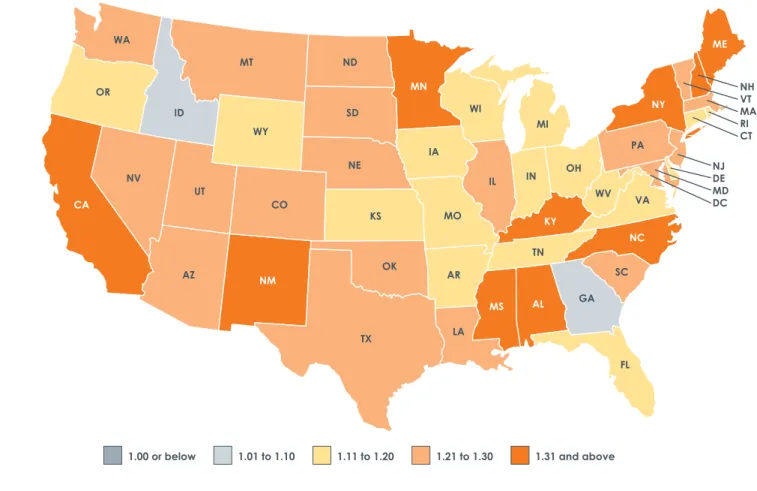
FiguRe 3.7.2(b) 2010 Median Debt Coverage Ratio by State . . . 38
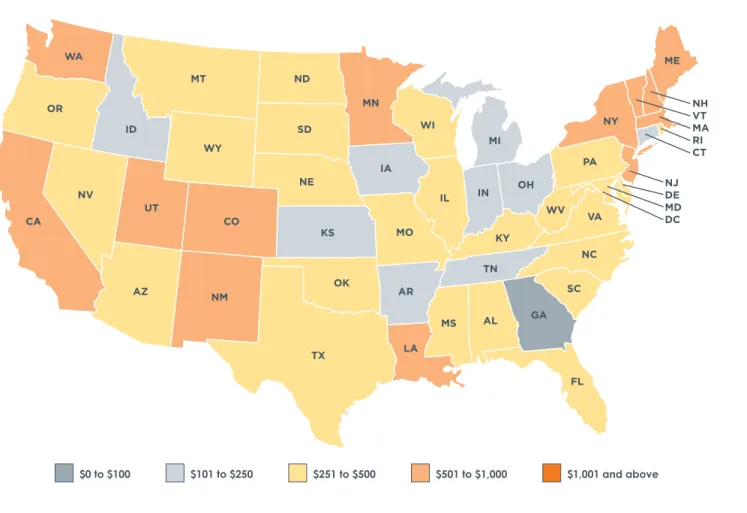
FiguRe 3.7.2(C) 2010 Median Per Unit Cash Flow by State . . . 39
FiguRe 3.7.3 Operating Performance by Top 10 MSAs . . . 40
FiguRe 4.1.1 2010 Underperformance . . . 44
FiguRe 4.1.1(A) 2010 Per Unit Cash Flow Performance by Property Size . . . 44
FiguRe 4.1.2 Underperformance (2008–2010) . . . 45
FiguRe 4.1.3 Chronic Underperformance . . . 46
FiguRe 4.1.4(A) Distribution of 2010 Physical Occupancy . . . 47
FiguRe 4.1.4(b) Distribution of 2010 Debt Coverage Ratio . . . 48
FiguRe 4.1.4(C) Distribution of 2010 Per Unit Cash Flow . . . 48
FiguRe 4.1.4(D) Operating Deficit Funding Sources for 2010 Property Deficits . . . 49
FiguRe 4.1.5(A) 2010 Occupancy Underperformance by State (Percent Below 90% Physical Occupancy) . . . 49
FiguRe 4.1.5(b) 2010 Debt Coverage Ratio Underperformance by State (Percent Below 1.00 DCR) . . . 50
Index of Figures
FiguRe 4.1.5(C) 2010 Per Unit Cash Flow Underperformance
by State (Percent Below $0 Per Unit Cash Flow) . . . 51
FiguRe 4.1.5(D) Chronic Occupancy Underperformance by State (Below 90% Occupancy in All Three Years 2008–2010) . . . 52
FiguRe 4.1.5(e) Chronic DCR Underperformance by State (Below 1.00 DCR in All Three Years 2008–2010) . . . 53
FiguRe 4.1.5(F) Chronic Cash Flow Underperformance by State (Below $0 Per Unit Cash Flow in All Three Years 2008–2010) . . . 54
FiguRe 4.2.1 Cumulative Foreclosure Rate by Year . . . 55
FiguRe 5.1.1 Total Surveyed Gross Equity by Fund Type (Post 1994 Funds) . . . 58
FiguRe 5.2(A) Gross Equity Price vs. Fund Yield by Year . . . 59
FiguRe 5.2(b) Surveyed Housing Tax Credit Fund Yield vs. 10-Year Treasury Security Rate (after tax equivalent) . . . 60
FiguRe 5.3 Fund Yield Variance by Year . . . 61
FiguRe 5.4.1 Housing Credit Delivery Variance by Investment Type . . . 62
FiguRe 5.4.2 Initial Years’ Housing Credit Delivery Variance by Year Fund Closed . . . 62
FiguRe 6.1 Net Equity by Year Placed-in-Service . . . 64
FiguRe 6.1(A) Percent Net Equity by Property Age (Years since Placed-in-Service, as of 12/31/2010) . . . 65
FiguRe 6.2 Average Project Size by Year Placed in Service . . . 65
FiguRe 6.2(A) Average Project Size by Net Equity, Credit Type and Year Placed-in-Service . . . 66
FiguRe 6.3 Percent Net Equity by Investment Type . . . 67
FiguRe 6.4 Percent Net Equity by Credit Type . . . 68
FiguRe 6.5 Percent Net Equity by Development Type . . . 69
FiguRe 6.6 Percent Net Equity by Tenancy Type . . . 69
FiguRe 6.7 Portfolio Composition by Region . . . 70
FiguRe 6.7(A) Percent Net Equity by Region. . . 71
FiguRe 6.7(b) Average Project Size by Region . . . 71
FiguRe 6.8 Percent Net Equity by State . . . 72
Background
T
he Low-Income Housing Tax Credit program
reached the 25th anniversary of its enactment
in 2011. Adopted in the midst of dramatic
changes to the Internal Revenue Code in 1986,
the program has since enjoyed a strong level of
bipartisan support in the United States Congress.
Following are some of the many features that
make the housing tax credit program unique.
• The cost of the housing tax credit program to the federal government is fixed and determinable by statute. The program is subject to a volume limit that permits its cost, unlike most tax expenditures, to be calculated with precision, thus ensuring that it cannot become a “runaway” government program.
• Housing tax credits are divided among the states based on their respective populations. The determination of which projects are to be awarded housing credit allocations is made by state housing credit agencies pursuant to a set of highly transparent procedures. As a result of its local control, the program has proven to be adaptable enough to serve changing housing needs as established by the states rather than by the federal government.
• For the last 15 years, the demand for housing tax credits has exceeded supply almost every year. This imbalance between the supply and demand for housing credits has resulted in a highly efficient use of tax credit dollars as a tool to finance the construction of new affordable housing and the rehabilitation of older affordable housing complexes.
• Over the course of the past decade, the occupancy level in housing tax credit proper-ties has consistently been approximately 96%. Given the normal turnover of rental units, this means that housing credit properties are effectively fully occupied. An inventory of 25,000+ fully occupied properties is directly attributable to the number of U.S. households that are “rent burdened.” The traditional measure for severe rent burden is when more than 50% of household income is required for housing. In 2010, 20.2 million U.S. households fell into this category.1
• In addition to the housing credit program, there are other federal housing programs designed to maintain the affordability of rents for low-income tenants. The housing credit program is unique because it functions as a capital subsidy to stimulate the production of new affordable housing and represents a public-private partnership.
The housing tax credit program has been, by any measure, a resounding success. A number of previous studies of the housing tax credit program have documented the program’s favorable record of:
• Serving income-qualified tenants at restricted rents
• Operating with an exceedingly low number of properties being lost to foreclosure
• Maintaining high levels of occupancy.
ChAPteR 1:
Executive Summary
The housing tax credit program has developed a strong track record for delivering quality housing to low-income families, meeting the expectations of institutional investors and maintaining a cumulative foreclosure rate that is less than 1%, which is more fully described in the report. State housing credit agencies are statutorily obligated to award only enough housing tax credits to make potential developments financially feasible, and the allocators have been effective at ensuring that projects to which they award housing credits have not been overfinanced. With statutory rent restrictions constraining the income potential of housing credit projects, one consequence of this statutory obligation is that housing tax credit properties are underwritten with very little margin for error in generating sufficient net operating income. Accordingly, when operating expenses are higher than projected or when rents are marginally lower than expected, housing tax credit properties may produce just enough or slightly less cash flow than is needed to service their mortgage debt. In recent years, as much as 35% of all housing tax credit properties have operated below break-even, albeit often by fairly small amounts.2 At the same time, studies have confirmed that the rate of foreclosure for housing tax credit properties has been very low in the aggregate. The apparent contradiction between these two data points – break-even or slightly below break-even net operating income in conjunction with an overall low fore-closure rate – is discussed in this report.
The tension between these two economic realities has left some investors with the impres-sion that housing credit investments are riskier than was previously understood. The concern held by some parties with respect to this issue has been further exacerbated by the challenges to the national economy occasioned by the near meltdown of the finan-cial services sector and the negative economic developments that followed it. Addressing the question of whether the number of struggling housing credit properties may have escalated and whether the incidence of foreclosures has increased in recent years was a central objective of CohnReznick’s August 2011 report. Our analysis of the data suggests that there has been no material deterioration in housing credit property performance and that certain operating performance metrics significantly improved from 2008 to 2010.
Survey Findings
CohnReznick achieved strong industry participation in its efforts to compile operating data for this report. Yielding a 95% overall response rate, 32 organizations chose to participate in our August 2011 study and an additional six participated in this study. All analytics have been updated to include the additional property data from the new participants. Cumulatively, study respondents provided CohnReznick with operating data for 17,118 housing credit properties, 90% of which achieved stabilized operations as of December 31, 2010. On average, stabilized properties in the surveyed pool CohnReznick analyzed had operated for approximately seven years as of December 31, 2010. This pool represents approximately $73 billion in housing tax credits approximately $62 billion in equity contribu-tion from investors to finance property development.3
2 Source: Ernst & Young. “Understanding the Dynamics V.”
3 The net equity and credit figures are slightly understated in value and slightly mismatched as a result of missing data from either
or both data fields. We estimate that the Housing Credit Net Equity figure may be understated by approximately $1 billion, and the Total Housing Credits figure may be understated by approximately $1.7 billion.
Our analysis of housing credit property performance is based on the three most important metrics for measuring property operations:
• Physical occupancy
• Debt coverage ratio
• Per-unit net cash flow.
The August 2011 study included data for 16,356 properties; the current report contains data for 17,118 properties, representing an increase of 762 properties (4.5% of the total pool). In comparison to CohnReznick’s August 2011 study, the expansion in the number of properties included in our data sample had rather limited impact on the change in overall industry performance. We attribute this limited impact to the large scale of the August 2011 data sample, which provided a solid statistical basis to support the findings. The limited impact of increasing the data sample is also partly attributed to the fact that trends identified in the August 2011 study appear to be common across individual participants’ respective property portfolios.
CohnReznick reports the following operating results from the data collected from respondents:
• Housing tax credit properties typically require economic occupancy of at least 87–89% (or physical occupancy of approximately 89-91%) to attain break-even operations. In recent years, the median occupancy in housing credit properties has reliably been approximately 96%. Notwithstanding the national recession and sharp increase in unem-ployment, median occupancy in housing credit properties was 96.4%, 96.3% and 96.6% in 2008, 2009 and 2010, respectively. As previously noted, high occupancy rates are another indicator of the tremendous imbalance between the increasing demand and short supply of affordable housing properties. Many survey respondents we interviewed following publication of our August 2011 report noted that unfavorable economic condi-tions led to enlarged tenant bases across properties in their affordable housing portfolios.
• The median debt coverage ratio (DCR) for housing tax credit properties has hovered between 1.13 and 1.15 for a significant portion of the past decade. The data indicate that debt coverage ratios climbed from these levels to 1.21 in 2009 and 1.24 in 2010. Similar to positive trends in the DCR, annual net cash flow per apartment unit was $250 in 2008, $341 in 2009 and reached $419 in 2010. As more fully described in Section 2.4, CohnReznick made significant efforts aimed at answering the question “What made this improvement possible?” including designing quantitative analysis to test our suppositions and inter-viewing industry experts to draw on their experience. Out of many possible explanations for the growth in debt coverage ratios and cash flow, we point out two important factors: better expense underwriting practices and a more favorable mix of debt to equity, which characterizes most of the properties developed over the past five years.
• CohnReznick prepared further analyses of the manner in which metric variances are distributed by segmenting properties according to construction type, property age and property size, in addition to other segmentation categories. CohnReznick has not observed material differences in operating results based on segmentation comparisons. Historically, the most significant difference in property performance has been attributed to certain geographical areas, particularly the Midwest. As a result, this report focuses on the influ-ence that geography has on property performance by region, state and metropolitan
statistical area (MSA). CohnReznick found through careful analysis of the performance data that low-income housing tax credit properties in certain areas tend to have more favorable operating histories than others. Nonetheless, with rare exceptions, properties in virtually all markets collectively showed improved financial performance from 2008 to 2010. In fact, 2010 is the first year in which every one of the 50 states reported a median debt coverage ratio of greater than 1.00 for the entire state. However, certain markets remain fragile and report a disproportionately larger share of both underperforming prop-erties and persistent operating deficits. In addition to regional and state-level performance metrics, the report includes performance data generated for MSAs for which a meaningful sample size could be obtained. Operating data at the MSA level show more volatility because of a smaller sample size. Though CohnReznick is making the study’s MSA data available, we caution readers to refrain from drawing conclusions about an MSA based solely on the enclosed MSA information. We encourage readers to contact CohnReznick professionals to assess the data provided in the appropriate context. Operating perfor-mance by MSA is included as Appendix F.
• In addition to studying operating performance for the entire cohort of surveyed prop-erties, CohnReznick adhered to current industry practice for isolating “performing” as opposed to “underperforming” properties. We identify properties as underperforming when they report occupancy levels below 90% and/or debt coverage ratios below 1.0. It was within the group of underperforming properties that CohnReznick observed the most significant change in operating results from 2008 to 2010.
The subset of underperforming properties that report occupancy challenges has been perhaps the most volatile of the data points we analyzed on a year-to-year basis. Before 2008, the percentage of properties reporting below 90% occupancy (on a net equity versus property count basis) ranged from a low of 11.5% to a high of 18%. However, the percentage of properties reporting below 90% occupancy dropped to 11.9% in 2008, increased slightly to 12.6% in 2009 and decreased to 9.5% in 2010. There are certain markets, particularly in parts of the Midwest, where the inherent rent advantage between rents charged by housing tax credit versus market-rate properties has been nominal. CohnReznick has observed continued chronic occupancy challenges in some of these markets. In a few such states, over 20% of the housing credit portfolio operated with physical occupancy below 90% during 2010, representing more than twice the national percentage.
Paralleling the overall increase in occupancy in 2010, the percentage of properties reporting negative cash flow and/or negative debt coverage actually decreased from 2008 to 2010. The percentage of properties operating below break-even, which has tradi-tionally been the statistic of greatest concern for investors, has historically been as high as 35%; based on the data collected, this percentage was 33.4% in 2008, 27.8% in 2009 and 24.7% in 2010. The decrease in properties operating below break-even from 2008 to 2010 is clearly a favorable trend, all the more so because it was achieved during an economic downturn. As one might expect, in those states where an above-average number of properties report occupancy challenges, an above-average number of properties report negative cash flow. For instance, while housing credit portfolios in Georgia and Indiana both followed the national trend of improved financial performance, more than 40% of their respective surveyed portfolios incurred operating deficits in 2010. We note, however, that no state reported a median DCR of below 1.0 in 2010.
The vast majority of housing tax credit properties that slip into one of the underper-forming categories do so for just a year and return to profitable operation in the following year. Properties that report occupancy and cash flow challenges for three or more consecutive years (characterized as “chronic” underperformers) are therefore fairly unusual. In some cases, these properties are unable to struggle back to break-even despite changing property management companies, funding large deficits for multiple years or trying to restructure property debt. These properties are deemed to have “structural” deficits because of serious physical plant issues, high area crime rates or similar issues that cannot easily be corrected.
Measured against the total pool of underperforming properties, CohnReznick’s data suggest that the percentage of properties reporting chronic underperformance for each consecutive year from 2008 to 2010 was 13.9% for negative debt coverage and just 3.9% for those properties with occupancy rates below 90%. There is an apparent contradiction between the percentage of properties reporting deficits in comparison to the remarkably low foreclosure rate for housing tax credit properties. However, because underperforming properties tend to underperform for only short periods of time and because deficits tend not to be significant in most underperforming properties, it is easier to understand why the cumulative foreclosure rate remains less than 1%.
• Historically, a great deal of attention has been given to the relatively small number of housing tax credit properties foreclosed upon by their lenders. It appears that this particular data point may have been understated, in part because some of the larger syndicators were using their own capital to support troubled properties in order to avoid foreclosure. This practice became less prevalent in the years from 2002 to 2006, when investor equity became relatively easy to obtain. As a result, the rate of foreclosures in housing tax credit properties has increased in small increments in recent years. The respondents CohnReznick surveyed reported that 98 of the total property count of 17,118 experienced foreclosure through the end of 2010, an aggregate foreclosure rate of 0.57% measured by property count. Approximately 50% of the stated foreclosures were reported to have occurred between 2008 and 2010. Thus, although operating perfor-mance generally improved, the rate of foreclosure from 2008 to 2010 still increased, suggesting that challenging economic conditions may have disproportionately affected chronically underperforming properties during those years.
Clearly, the number of foreclosures has been underreported as a result of incomplete data. Over the past 10 years, a minimum of eight syndication firms closed operations or became inactive. CohnReznick believes, on the basis of anecdotal evidence, that some of those firms experienced a disproportionately higher incidence of foreclosures. We were not able to pinpoint the number of foreclosed properties syndicated by these firms, nor were we able to ascertain the total number of properties that had been syndicated by these firms. As a result, any attempt to estimate the impact that the property portfo-lios syndicated by these firms might have on the industry foreclosure rate would require speculation on our part. Rather than abandon the methodology CohnReznick adopted to undertake this study, and compromise its results, we have confined the scope of our observations to the results we received from study respondents.
Based upon respondents’ data, while the number and rate of foreclosures increased incrementally from 2008 to 2010, the incidence of foreclosures in housing tax credit properties continued to compare very favorably with the foreclosure rate of market rate multifamily properties and other real estate asset groups. Based on the data we collected, tax credit properties were foreclosed, on average, just shy of year 11 of the 15-year compliance period. As such, while foreclosure is a catastrophic event, the financial impact to investors is much less significant than it is to the property’s lenders.
• Virtually all surveyed properties have been syndicated to investors through one of several types of investment funds: direct, proprietary, multi-investor and others. In addi-tion to operaaddi-tional data for property-level investments, survey respondents were asked to supply CohnReznick with performance data for every low-income housing tax credit fund that they syndicated to date. This analysis was intended to assess the track record of low-income housing tax credit funds in terms of delivering the originally projected yield and housing credits to investors. On a weighted average basis, survey respondents reported a positive 6.0% variance in meeting yield targets, i.e., the actual yield was 6% higher than the projected yield at investment closing. That being said, the composition of yield is as, if not more, important than the yield figure alone. This is discussed in greater detail in Chapter 5 of the report.
• Consistent with CohnReznick’s industry experience, the relative variance in housing credit delivery versus the projected credits over the entire 10-year housing credit period tends to be very small. While developers and syndicators tend to overestimate timing of credit delivery, the data suggest that syndicators have become more accurate in their forecasts of tax credit timing than they were in the housing credit program’s early years. Whether improved DCR and cash flow metrics can be sustained in the coming years will depend on a number of factors, including whether the industry continues to benefit from the historically low interest rate environment that it has enjoyed in recent years. CohnReznick is committed to conducting similar studies periodically in order to supply the industry with current and reliable data.
C
ohnReznick solicited data from 40 currently active housing tax credit
syndicators and a number of the nation’s largest housing credit
investors, hereinafter referred to as “data providers” or “respondents.”
Thirty-two organizations chose to participate in the August 2011 study, and
an additional six participated in the current study, resulting in a 95% overall
response rate (see Appendix A). In an effort to avoid the administrative
burden of reconciling property investments held in shared portfolios, we
collected only direct investment and fund investment performance data
from investor participants. All data was provided by the respondents to
CohnReznick on a voluntary and strictly confidential basis.
This report summarizes the operating and financial data collected from the respondents for housing tax credit property investments located in each of the 50 states, the District of Columbia, Guam, the U.S. Virgin Islands and Puerto Rico. After adjusting for property invest-ments where equity investinvest-ments in the same property were held in multiple funds, the data gathered to support the August 2011 report represented 16,356 housing tax credit proper-ties. An additional 762 properties have expanded the dataset for a total of 17,118 housing tax credit properties represented in this report. We believe this data sample represents approximately 70% of the entire inventory of housing tax credit properties that are actively managed by syndicators and/or investors. The gap between CohnReznick’s data sample and 100% of all housing tax credit properties is largely attributable to investments made by defunct syndicators, and properties that have reached the expiration of their respective compliance periods and subsequently “cycled out” of the program.
ChAPteR 2:
As can be observed in Figure 2.0.1, the 17,118 properties in CohnReznick’s data sample collectively represent approximately $62 billion in net equity investments and approxi-mately $73 billion in housing tax credits.
Of the 17,118 properties, 15,399 (90%) reached “stabilized operations” as of December 31, 2010. We define stabilized operations as properties that have completed construc-tion, achieved 100% tax credit qualified occupancy (i.e., all of the tax credit units have been occupied by income-eligible tenants) and the property has closed its permanent financing. While the definition of stabilized operations differs slightly among industry partici-pants, CohnReznick defines stabilized operations using the industry’s consensus definition and does not believe these slight differences are significant enough to distort our analysis. As can be observed in Figure 2.0.1, the 15,399 stabilized properties collectively represent approximately 83% of the survey sample on a housing credit net equity basis. Per property, stabilized investments included in this report averaged 72.4 apartment units, $3.4 million in net equity investment and $3.9 million in total housing credits.
SuRvey totAL StAbiLizeD PRoPeRtieS % oF StAbiLizeD
Number of Properties 17,118 15,399 90.0%
Number of Units 1,264,353 1,114,928 88.2%
Housing Credit Net Equity $ 62,363,416,612 $ 51,711,320,179 82.9% Total Housing Credits $ 73,155,492,616 $ 60,255,560,568 82.4%
Overall Portfolio Composition
FiguRe 2.0.1CohnReznick measured the real estate performance of the surveyed properties by using a number of operating and financial metrics, including:
• Physical occupancy, defined as the number of units occupied divided by the number of units available within a property
• Debt coverage ratio, defined as net operating income less required replacement reserve deposits divided by mandatory debt service payments
• Per-unit cash flow, defined as the amount of cash flow generated by each property after deducting debt service payments and required replacement reserve contributions
• Incidence of noncompliance
• Incidence of foreclosure.
This chapter summarizes the 2008–2010 operating performance data of the 15,399 stabi-lized properties. Figure 2.0.2 summarizes 2008–2010 operating results measured by median physical occupancy, DCR and per-unit cash flow data for the entire stabilized portfolio. While physical occupancy remained consistently strong from 2008 to 2010, DCR and per-unit cash flow trended upward in 2008, 2009 and 2010.
2008 2009 2010
Median Physical Occupancy 96.4% 96.3% 96.6%
Median Debt Coverage Ratio 1.15 1.21 1.24
Median Per Unit Cash Flow $250 $341 $419
Overall Portfolio Performance (2008–2010)
FiguRe 2.0.2As previously discussed, the expansion of CohnReznick’s dataset from the August 2011 to the current report has had a limited impact on the overall industry performance data because of the sheer size of the August 2011 report. However, for purposes of comparison, Figure 2.0.3 below represents the data differences between the two reports.
meDiAn PhySiCAL
oCCuPAnCy CoveRAge RAtiomeDiAn Debt meDiAn PeR unit CASh FLow 2008 2009 2010 2008 2009 2010 2008 2009 2010
August 2011 report 96.4% 96.3% 96.6% 1.15 1.19 1.24 $246 $335 $412 Current report 96.4% 96.3% 96.6% 1.15 1.21 1.24 $250 $341 $419
Overall Portfolio Performance (2008–2010)
– Comparison of August 2011 and Current Report
FiguRe 2.0.32.1. Physical Occupancy
Syndicators and investors alike generally underwrite housing tax credit property invest-ments based on the assumption that “effective” or “economic” occupancy will be 93%. The assumed economic loss of 7% takes into account the periodic turnover of units, the ability to lease such units and losses resulting from rent skips and/or collection problems. While physical occupancy may be calculated at 95%, it is common for housing tax credit properties to lose an additional 1–2% of gross potential rent because of collection problems.
Figure 2.1 summarizes the median physical occupancy data for the stabilized proper-ties CohnReznick surveyed for calendar years 2008 through 2010. The data suggest that, notwithstanding the recent recession, the troubled housing sector and increased unem-ployment, median occupancy remained consistently robust, with only minor fluctuations from year to year. The 2008 median occupancy rate of 96.4% decreased slightly to 96.3% in 2009 but rebounded and subsequently increased to 96.6% in 2010.
2008 2009 2010
Median Physical Occupancy 96.4% 96.3% 96.6%
Median Physical Occupancy (2008–2010)
FiguRe 2.1In contrast to the housing credit portfolio, the U.S. Census Bureau recently published data suggesting that conventional multifamily properties were negatively impacted by the recession. The Bureau reported that the national multifamily rental vacancy rate climbed from 9.6% in the fourth quarter of 2007 to 10.1% in the fourth quarter of 2008 and increased further to 10.7% in 2009 before returning to the pre-recession level of 9.4% during the fourth quarter of 2010.4 The reasons for the difference in occupancy levels are numerous, but the
major driver of the consistently high occupancy rates in housing tax credit properties is that the United States simply does not have enough low-income housing units to satisfy the national demand for affordable housing. In fact, the recent downturn in the economy may have created a more pressing need for low-income housing than ever before. During this downturn, housing tax credit property production contracted to half its pre-recession level as a result of the halving of the housing credit market. In a recently published report, the National Low Income Housing Coalition estimated the deficit of rental units that are both affordable and available for extremely low-income households (those earning up to 30% of area median income [AMI]), to be 6.8 million units in 2010.5
We note that only physical occupancy data have been presented in this report. Economic occupancy, while meaningful, is not monitored by a significant portion of data providers and was thus excluded from the survey. Furthermore, while physical occupancy was rela-tively consistent across the country, economic losses may have varied significantly, thereby contributing to differing financial performance among housing credit properties across various geographic segments.
2.2. Debt Coverage Ratio
The term “debt coverage” relates to the relationship between net income (effective gross rental income less operating expenses and replacement reserve deposits) and manda-tory debt service payments. Thus, for example, an apartment project that reports net rental income of $115,000 and $100,000 of annual mandatory debt service is considered to have a 1.15 DCR. Most lenders require housing tax credit properties to generate a debt coverage ratio of at least 1.15 (the industry standard) before agreeing to retire a property’s construction loan and extend long-term permanent financing. In addition, some lenders require higher coverage ratios for properties demonstrating lower real estate quality.
4 Source: U.S. Census Bureau American Housing Survey. http://www.census.gov/hhes/www/housing/hvs. 5 Source: National Low Income Housing Coalition. http://nlihc.org/sites/default/files/HousingSpotlight2-1.pdf.
The properties CohnReznick surveyed experienced a steady increase in DCR from 2008 to 2010, at a pace that was more pronounced than the positive trend in occupancy rates. In 2008, median DCR was 1.15, which is consistent with previous studies based on various industry sources6 and coincides with the current industry standard. Furthermore, the
median DCR increased to 1.21 in 2009 and increased significantly again to 1.24 in 2010, a surprising result for some industry observers given the national recession, increased unem-ployment and the turmoil in certain housing markets.
2008 2009 2010
Median Debt Coverage Ratio 1.15 1.21 1.24
Median Debt Coverage Ratio (2008–2010)
FiguRe 2.2The improvement in 2008–2010 DCR was pervasive. The same positive trend was identi-fied across virtually every state, property type and financing type and was reflected in the data supplied by almost all individual data providers. Enterprise Community Investment, Inc. (Enterprise), one of the nation’s largest nonprofit housing credit syndicators and a participant in our study, published a November 2010 report examining the operating performance of 1,545 housing tax credit properties in its own portfolio.7 Enterprise’s report
concluded that, “Whether using the weighted average method (calculating one DCR for the entire aggregate portfolio) or portfolio median, DCR results were consistently in the 1.05 to 1.12 range between 2004 and 2008. In 2009, there was an 8% increase in DCR to 1.20.”
2.3. Per-Unit Cash Flow
The level of cash flow that a property generates (expressed here in terms of annual cash flow per apartment unit) closely tracks the property’s DCR; however, to the extent that a property only has “soft” debt, DCR measurements are less relevant. Soft debt refers to mortgage loans made by government agencies that require current payments only to the extent that the project has sufficient cash flow (or in some cases, do not require any payments until the maturity of such loans even if there is surplus cash flow). Accordingly, the number of properties reporting per-unit cash flow was larger than the number of prop-erties reporting debt coverage.
In the same way that DCRs improved from 2008 to 2010, the data suggest that median cash flow per unit increased year over year from 2008 to 2010. Since 2002, cash flow after paying hard debt service was minimal averaging between $200 and $250 per unit per annum (PUPA), or $20 per unit per month. However, the 2008 median cash flow per unit of $250 increased to $341 in 2009 and to $419 in 2010. As previously noted, while these annual increases may appear dramatic, they represent growth in net income per apartment of less than $10 per month.
6 Source: Ernst & Young. “Understanding the Dynamics V,” reporting the median DCR of 1.14 for 12,064 housing credit properties
in calendar year 2006.
2008 2009 2010
Median Per Unit Cash Flow $250 $341 $419
Median Per Unit Cash Flow (2008–2010)
FiguRe 2.3Along with improved financial and operating performance, the incidence of underper-forming properties with respect to per-unit cash flow decreased consistently from 2008 to 2010. The most significant improvement was the lower percentage of housing tax credit properties operating below break-even. Based on the data collected, the percentage of properties operating below breakeven was 33.7% in 2008, 28.3% in 2009 and 25.2% in 2010.
2.4. Possible Explanations for Improved Financial Metrics
Since publishing the August 2011 report, CohnReznick committed to answering the question “how is this improvement possible?” Accordingly, CohnReznick interviewed industry experts to draw on their experience and designed quantitative analyses to test possible factors that point to the improvement in performance metrics of housing tax credit properties.
There are many possible factors that could have contributed to improved operating and financial performance of a typical housing tax credit property. These factors include:
• Higher rental rates
• Lower occupancy turnover or collection losses
• Lower hard debt service levels
• Lower than projected operating expenses or better expense underwriting practices. However, none of these factors can be singled out as a principal or overriding source for improved operations. Of the various causes explored, CohnReznick found that more effi-cient expense underwriting and more favorable debt-to-equity ratios are the two primary contributors to improved performance.
Lower hard debt service: In CohnReznick’s August 2011 report, we speculated that the marked increase in the number of properties carrying lower leverage was an important contributing factor to improved DCRs and cash flow.
As housing tax credit prices have trended upward, the overall portfolio reflects an increasing number of properties that have been financed with little to no hard debt. This is not surprising, since a more favorable equity-to-debt mix is a direct result of higher tax credit pricing.
Figure 2.4.1. illustrates the evolution of net equity pricing over the past 20 years, measured by the amount of capital investors committed to, in accordance with a pre-negotiated pay-in schedule, in order to receive one dollar of tax credit. At the inception of the housing credit program, equity was raised principally from relatively small investments by individual investors through public offerings. Beginning in 1992 and 1993, a corporate
equity market began to develop, and the housing tax credit program was made perma-nent in 1993. Institutional investors began to understand the asset class, and syndicators quickly came to realize that raising capital from institutional investors was a more effi-cient way to raise equity. At the national level, housing tax credits initially traded at net prices as low as $0.50 per dollar of credit, steadily increased to $0.85 per dollar of credit in 2004 and skyrocketed to close to $1.00 at the height of the equity market between 2006 and 2007. However, the exit of Fannie Mae and Freddie Mac and a precipitous decline in the profitability of the largest financial services companies resulted in a meltdown of the housing credit equity market. As a direct consequence, housing tax credit prices fell sharply to $0.70-$0.75 before increasing gradually again at the end of 2010 and in earnest in 2011.
Net Equity Price by Year Placed-in-Service
FiguRe 2.4.1hou Sing CR eD it net equity PR iC e $1.00 $0.90 $0.80 $0.70 $0.60 $0.50 $0.40 1991 1993 1995 1997 1999 2001 2003 2005 2007 2009 1992 1994 1996 1998 2000 2002 2004 2006 2008 2010
Readers should note the following:
• Housing tax credit prices presented in Figure 2.4.1 are described as the “net equity price” because they reflect the direct amount of equity per dollar of credit that will be invested to finance the development of these properties. We refer to them as “net” prices because they do not include the costs of raising capital such as fees paid to compensate syndicators for their services, brokerage commissions and similar costs often collectively referred to as “the load.” The amount of load can vary significantly depending on an investor’s choice of investment vehicles (multi-investor versus propri-etary versus direct investment) and the individual syndicator’s business practices.
• The years depicted are a function of the year in which the properties are placed in service, as opposed to when the underlying investments are closed and the housing credit prices are determined. Given the development timeline of a typical housing tax credit property, the prices in Figure 2.4.1 naturally reflect a 1- to 2-year lag in market price.
• Finally, while the housing tax credit prices in Figure 2.4.1 are median prices reported by survey respondents, a price disparity as wide as 35 cents between properties in certain markets can be observed based on whether the property is located within the Community Reinvestment Act (CRA) assessment area where one or more inves-tors compete for investment in the same property. The CRA and its effect on housing tax credit pricing will be analyzed in a separate report that will be published in the first quarter of 2013.
Figures 2.4.2 and 2.4.3 illustrate the impact of higher tax credit pricing on the debt-to-equity mix (expressed as a hard debt ratio) of housing tax credit properties placed in service between 1997 and 2011. The right Y-axis shows the median hard debt ratio of the surveyed housing tax credit properties, while the left Y-axis shows the median housing tax credit price for properties placed in service within the same time period. We presented the 4% housing tax credit properties separately from 9% housing tax credit properties because 4% properties tend to be much more heavily leveraged than 9% properties.
Though not perfect, a strong inverse relationship exists between a given property’s tax credit price and its level of hard debt. Using 9% tax credit properties as an example, in the late 1990s when median housing tax credit equity pricing was in the mid- to high 70 cents range, one-third of the permanent financing of housing tax credit properties was provided by conventional “hard” debt. In recent years, as housing tax credit prices began to benefit from much lower leverage, only one-fifth of permanent financing is made up of hard debt.
hou Sing CR eD it net equity PR iC e hARD Debt RA tio 1997 1998 1999 2000 2001 2002 2003 2004 2005 2006 2007 2008 2009 2010 $1.00 $0.95 $0.90 $0.85 $0.80 $0.75 $0.70 $0.65 40.0% 35.0% 30.0% 25.0% 20.0% 15.0% 10.0% 5.0%
Net Equity Price Hard Debt Ratio
Net Equity Price vs. Hard Debt Ratio by Year
hou Sing CR eD it net equity PR iC e hARD Debt RA tio 1997 1998 1999 2000 2001 2002 2003 2004 2005 2006 2007 2008 2009 2010 $1.00 $0.95 $0.90 $0.85 $0.80 $0.75 $0.70 $0.65 70.0% 60.0% 50.0% 40.0% 30.0% 20.0% 10.0% 0.0%
Net Equity Price Hard Debt Ratio
Net Equity Price vs. Hard Debt Ratio by Year
Placed-in-Service – 4% Housing Tax Credit Properties
FiguRe 2.4.3The following hypothetical example illustrates the scale of the potential impact on debt coverage from lower debt burdens using the following assumptions:
• Number of units = 72
• Per unit total development cost = $200,000
• Total development cost = $14,400,000
• Property bears a conventional first mortgage equal to 18% of cost (which is the median hard debt for surveyed projects placed in service in 2009).
SCenARio A
(33% LeveRAgeD) (18% LeveRAgeD)SCenARio b
Total development costs $14,400,000 $14,400,000
Hard debt ratio 33% 18%
Total hard debt $4,752,000 $2,592,000
Interest rate 6.50% 6.50%
Annual debt service $360,430 $196,598
Per unit per month debt service $417 $228
Hypothetical Housing Tax Credit Project
Compared with the hard debt burden typical of a housing credit property developed in 1997 (33% leverage – Scenario A), the reduction in debt service (Scenario B) equates to a substantial debt service savings of $189 per unit per month.
It is worth noting that by 2010, greater than 34% of the surveyed properties were placed in service within the previous five years. As a group, these properties are clearly benefiting from lower levels of hard debt.
Notwithstanding the data reflecting the favorable effect of lower leverage, a property’s hard debt ratio has, as a single statistic, little bearing on a property’s overall performance. Indeed, cash flow levels are often considerably higher in larger properties financed with tax-exempt bonds and 4% tax credits. The average 4% property in our survey has 116 apartments units, almost twice the size of the average 9% property with 59 units. Smaller properties have fewer units over which to distribute their fixed costs. As a result, they are more sensitive to debt levels and perform more predictably with lower levels of debt.
operating expenses: Reduced insurance premiums and lower utility bills resulting from individual metering and/or energy efficiencies are two frequently cited reasons for unex-pected operating expense savings in recent years. One of the nation’s largest syndicators, and a participant in this study, believes “the increase in DCR is a result of both revenue and expense improvements.”8 Across this syndicator’s portfolio, median total revenue increased
4.5% from 2008 to 2009, relative to the 2% underwritten rate, while expenses increased only 2.2% relative to the 3% underwritten rate. Given the combination of higher-than-under-written rental income and lower-than-underhigher-than-under-written operating expenses, the syndicator’s portfolio realized a 9.2% increase in net operating income. The syndicator explained that expense savings were most notable in insurance (decrease of 6.4%), real estate taxes (decrease of 5.1%) and utilities (increase of only 1.6%) between 2008 and 2009. While the types of cost savings realized in the syndicator’s portfolio are consistent with other industry participants, we searched for additional confirmation of this observation and found that the National Apartment Association (NAA) reported that in the subsidized housing subset, average operating expenses of $4,441 per unit in 2008 fell to $4,319 per unit in 2009 and rose to $4,856 per unit in 2010. The NAA has an extensive database of multifamily proper-ties consisting of 1.1 million units and does an annual survey of operating expenses.9 The
NAA database includes 60,326 units identified as “subsidized affordable housing units.” Unfortunately, there is no way to break this subset down further into housing credit proper-ties versus properproper-ties developed under pre-housing credit subsidy programs (Secs. 8, 221 (d)(4), 236, etc.). Nonetheless, NAA’s survey and findings are useful for corroborating our own analysis.
Perhaps more important than lower operating expenses, CohnReznick’s industry experi-ence and interviews with survey respondents led us to believe that the housing tax credit industry, as a whole, has come a long way in improving its underwriting of operating expenses. Syndicators, for instance, indicated that the availability of benchmarked data from their own portfolios, state credit allocation agencies and industry data providers have helped them improve their expense underwriting.
8 Source: Enterprise Community Investment, Inc. “Asset Management LIHTC Portfolio Trends Analysis – November 2010.” 9 Source: National Apartment Association. “2011 Survey of Operating Income & Expenses in Rental Apartment Communities.”
other contributing factors: Lenders of permanent financing for housing tax credit properties typically require a 1.15 to 1.20 DCR at conversion of the loan from a construction loan to a permanent loan. During the recent equity market meltdown, when the housing credit industry was able to attract only half of its prerecession level of equity, lenders and investors began to require more stringent underwriting terms, including a DCR of 1.20 to 1.25 and more favorable guarantee and reserve protections. Accordingly, while a 1.24 median DCR may seem high, higher DCRs suggests a greater ability to generated projected cash flow needs.
Many industry participants believed that favorable interest rates and the abundance of subsi-dies, like the Section 1602 program made available in the last few years, played a part in the improvement of property financial performance. However, the full impact of many of these newer programs cannot yet be measured with operating performance data, as the proper-ties developed under these programs have only just begun to achieve stabilized operations.
Factors found to have minimal to no bearing on improved financial metrics: While high physical occupancy is an indicator of the demand for affordable housing, it is not an influential one with respect to the 2008-2010 improvement in performance metrics, as occupancy remained within a very narrow band from 96% to 96.9% over the past decade.
higher rental rates: Because of the sheer volume, CohnReznick did not attempt to collect rent rate data. However, participants’ senior asset management staff were interviewed from a cross-section of data providers regarding their portfolio’s ability to achieve rent increases during the survey years.
Survey respondents concurred that the decrease in workforce employment, the decreasing homeownership rate and an overriding sense of financial instability led to an enlarged renter pool and increased competition for rental housing from 2008–2010. However, none of the interviewed respondents observed a direct correlation between higher demand and rent increases over the last few years. In some markets, affordable housing properties reduced rents to guard against pricing pressure from market rate rentals or condominium conversions. In other markets, affordable housing properties experienced less pricing pressure because of decreased competition from homeownership, and thus either eliminated concession offer-ings or implemented rent increases without jeopardizing occupancy.
Lower occupancy turnover and collection losses: Because a significant portion of survey respondents do not track economic occupancy or have such data readily available, CohnReznick collected only physical occupancy data. After an initial analysis of the occupancy data and other metrics, we speculated that turnover rates and turnover-related costs might have decreased. Interestingly, upon further research and interviews with industry participants, this has not proven to be the case. While tenant retention efforts coupled with declining homeownership rates, particularly among first-time homebuyers, may have resulted in reduced turnover levels in select properties, many asset managers reported that turnover rates had increased for a variety of reasons, including tenants losing or switching jobs and tenants moving more frequently to reap the benefits of a property’s first month’s concessions in a practice referred to as “concession shopping.”
We lack a basis for predicting whether the improvement in property operations is a trend likely to sustain itself or is a short-term phenomenon. However, since the data suggest that the improvements in expense underwriting and the favorable impact of lower leverage are more clearly visible in “younger” properties, it is reasonable to assume that more favor-able debt coverage ratios will be maintained for the foreseefavor-able future. CohnReznick is committed to conducting similar studies periodically to supply the industry with current and reliable data.
H
ousing credit investors and lenders frequently
question whether property investments
in certain geographical areas, construction
types, tenancy types, financing types or other
segmented criteria tend to perform better
than others. This chapter reviews the 2008–2010
trends in occupancy, debt coverage and cash
flow according to property age, property size
and other attributes. However, the single most
important expansion from the segmentation
analysis in CohnReznick’s August 2011 report is the geographic
segmentation performance data we herein present by region, state and
metropolitan statistical area.
3.1. Segmentation Analysis – by Property Age
The following graphs illustrate how the 2010 operating and financial performance data may have differed based on the year in which a property was originally placed in service. CohnReznick chose not to present data for properties placed in service during 2009 and 2010 due to the relatively small size of the stabilized sample during the aforementioned years. For purposes of this report, we have used “placed-in-service” date and “property age” interchangeably.
Based on Figure 3.1.1(A) below, occupancy by property age is clustered within the 95.5% to 97.5% range, indicating that property age has not been a material driver of occupancy rates as the difference of this range is minimal.
2010 Median Physical Occupancy
by Year Placed-in-Service
FiguRe 3.1.1(A)2010 m eD iA n P hy Si CAL oCC u PA n C y 98% 97% 96% 95% 1990 1992 1994 1996 1998 2000 2002 2004 2006 2008
Surveyed properties display a wider spread in DCR and per-unit cash flow along the age spectrum; however, CohnReznick observes that there is no linear relationship suggesting that older properties tend to underperform newer ones financially.
ChAPteR 3:
Portfolio Performance
by Segments
2010 Median Debt Coverage Ratio
by Year Placed-in-Service
FiguRe 3.1.1(b)2010 m eD iA n Debt Cove RA ge R A tio 1.50 1.40 1.30 1.20 1.10 1.00 1990 1992 1994 1996 1998 2000 2002 2004 2006 2008
2010 Median Per Unit Cash Flow
by Year Placed-in-Service
FiguRe 3.1.1(C)2010 m eD iA n P eR unit CAS h FL ow $700 $600 $500 $400 $300 $200 1990 1992 1994 1996 1998 2000 2002 2004 2006 2008
In general, housing tax credit properties placed in service during the past five years gener-ated greater than average cash flows. This is consistent with our findings, as these younger properties have realized the benefit of low levels of leverage and relatively inexpensive financing. A survey respondent noted in its report that “another factor in the DCR improve-ment is that the newer projects entering the portfolio are larger in size and have healthier net operating income (NOI) than the portfolio as a whole.”10 Further, some respondents noted
that the positive improvement in DCRs and cash flows may be attributed to the fact that there tends to be fewer “surprises” in the first several years of a property’s operation once it is stabilized and when its debt has been converted to permanent financing (and resized prop-erly if necessary). Some respondents believe that as properties age, deferred maintenance could become a compounded issue over time and cause decreased DCRs and cash flow.
The following two figures illustrate that stronger financial performance metrics were observed in nearly every age group of surveyed properties from 2008 to 2009.
2008/2009 Median Debt Coverage Ratio
by Year Placed-in-Service
FiguRe 3.1.1(D)2008/2009 m eD iA n D ebt C ove RA ge RA tio 1.45 1.35 1.25 1.15 1.05 1990 1992 1994 1996 1998 2000 2002 2004 2006 2009 DCR 2008 DCR
2008/2009 Median Per Unit Cash Flow
by Year Placed-in-Service
FiguRe 3.1.1(e)2008/2009 m eD iA n Pe R u nit C AS h F Low $600 $500 $400 $300 $200 $100 1990 1992 1994 1996 1998 2000 2002 2004 2006
2009 Per Unit Cash Flow 2008 Per Unit Cash Flow
3.2. Segmentation Analysis – by Property Size
Figure 3.2 presents the operating performance data of surveyed housing credit proper-ties grouped by size, e.g., number of apartment units per property. On average, stabilized housing tax credit properties are composed of 72 apartment units per property. Those containing between 51 and 100 apartment units per property were found to have oper-ating performance metrics that most closely mirror that of the entire surveyed portfolio.
numbeR oF APARtment unitS PeR PRoPeRty
meDiAn PhySiCAL
oCCuPAnCy CoveRAge RAtiomeDiAn Debt meDiAn PeR unit CASh FLow 2008 2009 2010 2008 2009 2010 2008 2009 2010 0–25 96.7% 96.2% 96.7% 1.16 1.21 1.28 $199 $271 $371 26–50 96.6% 96.5% 96.7% 1.16 1.22 1.24 $221 $303 $354 51–100 96.6% 96.8% 97.0% 1.16 1.21 1.24 $286 $395 $460 101–200 96.0% 96.0% 96.1% 1.14 1.20 1.24 $357 $490 $590 201–300 95.0% 94.6% 95.0% 1.11 1.15 1.19 $256 $344 $498 301 or more 95.0% 95.0% 95.4% 1.15 1.17 1.19 $258 $440 $490 Overall 96.4% 96.3% 96.6% 1.15 1.21 1.24 $250 $341 $419
Operating Performance by Project Size
FiguRe 3.23.3. Segmentation Analysis – by Investment Type
Figure 3.3 summarizes the operating performance data for stabilized properties segmented by the source of a property’s equity financing, e.g., those acquired by public funds versus multi-investor funds, and so forth. As noted in Chapter 6, multi-investor fund investments account for the majority of the portfolio covered by this report. Consistent with the overall data findings, properties syndicated through multi-investor funds reported an increase in median occupancy during 2009 and 2010, at 96.4% to 96.6%, respectively. Based on our findings, property investments held by proprietary funds slightly outperformed the overall portfolio by the single indicator of occupancy, reflecting the highest 2010 median occu-pancy of 96.8% among all investment types. In contrast, public funds, consisting of older property investments, reported a somewhat lower 2010 median occupancy rate of 95.8%. Both DCR and per-unit cash flow levels for properties acquired by multi-investor funds mirrored the overall trend as well. However, with slight variations from year to year, direct investments tend to generate debt coverage and cash flow levels that are slightly lower than the overall median. We suspect that this is attributable to the fact that the average size of properties acquired directly is somewhat smaller than average. Other than this distinction, the differences in operating performance from one investment type to another are relatively immaterial.
inveStment tyPe
meDiAn PhySiCAL
oCCuPAnCy CoveRAge RAtiomeDiAn Debt meDiAn PeR unit CASh FLow 2008 2009 2010 2008 2009 2010 2008 2009 2010 Direct 95.8% 95.7% 96.2% 1.08 1.12 1.18 $114 $247 $347 Multi-investor 96.4% 96.4% 96.6% 1.15 1.21 1.25 $240 $345 $420 Proprietary 96.8% 96.5% 96.8% 1.16 1.20 1.24 $262 $352 $414 Public 95.8% 95.8% 95.8% 1.16 1.18 1.30 $232 $212 $340 Overall 96.4% 96.3% 96.6% 1.15 1.21 1.24 $250 $341 $419
Operating Performance by Investment Type
FiguRe 3.3Fund-level performance metrics, measured in terms of yield and credit delivery variances, are discussed in Chapter 5 of this report.
3.4. Segmentation Analysis – by Credit Type
The data reflected in Figure 3.4 summarize the operating performance data for stabilized properties segmented by credit type. Data providers were presented with the options to classify the tax credit type for each property by 9% versus 4% housing tax credits and subsequently further separate the 9% credit properties into two subcategories: 9% new construction properties and 4% & 9% acquisition and rehabilitation properties. However, many respondents did not represent that their properties were classified as “4% & 9%” prop-erty; thus, the sample size for “4% & 9%” tax credit types was very small. For purposes of this report, CohnReznick merged the subset of acquisition/rehabilitation properties that qualify for both 4% and 9% credits into the 9% category.
As shown below, the median occupancy rate for stabilized 9% credit properties was on par with 4% credit properties from 2008 to 2010.
We have not observed meaningful differences between the operating performance of 4% versus 9% properties in terms of DCR. However, the 4% properties we surveyed reported consistently higher levels of cash flow than their 9% counterparts. We attribute this to the fact that properties financed with tax-exempt bonds are generally larger and thus have the ability to distribute their fixed costs over a wider base of apartments. The surveyed 4% properties averaged 116 units per property while the 9% surveyed properties averaged 59 units per property.
CReDit tyPe
meDiAn PhySiCAL
oCCuPAnCy CoveRAge RAtiomeDiAn Debt meDiAn PeR unit CASh FLow 2008 2009 2010 2008 2009 2010 2008 2009 2010
4% Tax Credits 96.5% 96.3% 96.7% 1.14 1.19 1.23 $318 $404 $506 9% Tax Credits 96.5% 96.4% 96.6% 1.15 1.21 1.25 $220 $329 $399
Overall 96.4% 96.3% 96.6% 1.15 1.21 1.24 $250 $341 $419
Operating Performance by Credit Type
FiguRe 3.43.5. Segmentation Analysis – by Development Type
Stabilized new construction properties account for the majority of the properties we surveyed. As might be expected, based on historical results, newly constructed proper-ties consistently reported stronger operating performance among all development types, followed by rehabilitated properties and, finally, historic rehabilitation properties (i.e., properties qualifying for both housing and historic rehabilitation credits). Historic rehabilita-tion properties, which account for 480 properties, reported median occupancy of 95.9% in 2010, representing the lowest among all develo