Children's utilization of dental care in the
NC Medicaid program
Scott W. Cashion, DDS, MS William F. Vann, Jr. DMD, MS, PhD R. Gary Rozier, DDS, MPH Ronald D. Venezie, DDS, MS F. Thomas McIver, DDS, MS
enhance health care services for eligible children.3 This pro-gram mandates that certain health care services, including dental care, be provided for Medicaid-eligible children younger than age 21. Such a mandate underscores the importance of access to dental services.
In reality, Medicaid-eligible children face considerable bar-riers to receipt of dental services. A 1990 report by the Office of Technology Assessment (OTA) concluded that many mandated dental services were not available to children.4 The barriers included administrative and structural complications of the Medicaid program, low provider participation, low reimbursement rates, patient transportation problems, and lack of knowledge of the program’s availability.4 Recent reports by the Office of the Inspector General (OIG) of the Depart-ment of Health and Human Services and the Institute of Medicine highlighted similar barriers to preventive dental services for children.5, 6
Access to dental care for Medicaid-eligible children in North Carolina
Since the late 1980s, children’s access to dental care in the North Carolina (NC) Medicaid Program has been a major topic of discussion among children’s dental health advocates and policy makers. The NC Dental Society has campaigned vigorously since 1990 for an increase in reimbursement rates for children’s dental procedures, but increases during the past eight years have been minimal. Low reimbursement rates have been mentioned as the major reason why many den-tists do not participate in the NC Medicaid Program.7
A recent study analyzed trends of dentists’ participation in the NC Medicaid Program for the period 1986–92.8 During this time there was a two-fold increase in the number of Medicaid-eligible children. The number of dentists participat-ing in Medicaid decreased slightly over the study period, while dentists who continued to treat Medicaid-eligible children nearly doubled their intensity of participation. This study concluded that although access to dental care remained At the time of the study, Dr. Cashion was a fellow in pediatric dentistry and a trainee in the MCH Training Center,
he is now in private practice, Greensboro, NC; Dr. Vann is professor and Graduate Program Director, Department of Pediatric Dentistry; Dr. Rozier is professor and Graduate Program Director, Department of Health Policy and Adminis-tration, School of Public Health; Dr. Venezie is adjunct assistant professor, Department of Pediatric Dentistry, Area Supervisor, North Carolina Division of Dentistry, Department of Health and Human Resources, all at The University of North Carolina at Chapel Hill, Chapel Hill, NC; Dr. McIver is professor, Department of Pediatric Dentistry.
Abstract
Purpose: To characterize the patterns of dental care in the North Carolina (NC) Medicaid Program for three- and eight-year-old children who began dental treatment in the 1985–86 and 1990–91 groups. We also compared the children’s patterns of care by provider (general dentists versus pediatric dentists).
Methods: Our extensive data set included claims, enrollment, and provider data. Children were assigned to one of five catego-ries or patterns of care as follows: complete care, general anesthesia care, sporadic care, emergency only care, and no care. Statistical comparisons of the variables age, cohort year, and provider groups were made.
Results: The use of Medicaid dental services by both age groups was severely limited in both yearly cohorts. Pediatric dentists tended to provide more complete and less sporadic care for both age groups and both yearly cohorts.
Conclusions: Financing dental care through Medicaid re-sults in very low levels of complete care among enrollees, and any plan that limits referral to pediatric dentists might ad-versely affect the number of enrollees who receive complete care. (Pediatr Dent 21:97-103, 1999).
O
ral health as a component of general health has been embraced by the dental profession for many years. This idea has been popularized by former Surgeon General C. Everett Koop in his widely quoted advocacy state-ment “you’re not healthy without good oral health.” Access to oral health care is uneven across our society, with lack of access affecting vulnerable populations. To increase access to health care for the poor and other vulnerable populations, Medicaid was established in 1965 as an amendment (Title XIX) to the Social Security Act. Although Medicaid has evolved considerably since its inception, its original goal and the one that guides the program today is to provide health care to certain groups of lower income individuals.2A major change in the Medicaid Program, known as the Early and Periodic Screening, Diagnosis and Treatment Pro-gram (EPSDT), was enacted in 1967 (Public Law 90-248) to
relatively constant from 1986–92, access was nonetheless severely limited.8
Patterns of dental care utilization
While the low use of services in the Medicaid program is well-established, a paucity of literature exists concerning patterns of children’s dental care utilization.9–13 Efforts to ex-amine patterns of care in children have been limited almost exclusively to quantitative reports of yearly visits and descrip-tions of access to diagnostic and preventive care. An overarching goal of the present study was to develop a more sophisticated description of the patterns of children’s dental care utilization based on Medicaid claims data. Such a description would be useful for monitoring patterns of care over time and for comparing care received by different groups of patients and for comparing care delivered by various provider groups. This approach might have value for also monitoring the comprehensiveness of children’s dental care under various service delivery models as well as different dental care financing mechanisms, particu-larly at times when states are considering expansion of dental insurance for children through the Balanced Budget Act of 1997 (Title XXI).
The availability of an extensive data set for children treated in the NC Medicaid Program from 1984–92 and the chang-ing environment of access to care for this group, presented a unique opportunity to study patterns of dental care use. Accordingly, the specific aims of this study were:
1) To characterize the patterns of dental care for three-and eight-year-old children in the NC Medicaid Pro-gram who began dental treatment in the 1985-86 fiscal year (FY).
2) To characterize the patterns of dental care for three- and eight-year-old children in the NC Medicaid Program who began dental treatment in the 1990-91 FY. 3) To evaluate changes in utilization of dental services by
comparing patterns of care provided to three- and eight-year-old children in these two cohorts.
Within each of these specific aims, we compared two provider groups (general vs pediatric dentists). A final aim was to compare the provider groups for the mean number of visits per child and the mean number of procedures per visit per child.
Methods
This study used data from the NC Medicaid Program. A com-prehensive data set was constructed by merging dental claims from 1984–92 for all NC Medicaid recipients younger than age 21, the same recipients’ lifetime enrollment histories, and information about the dental providers. The claims, enroll-ment, and provider data came from three different files and contained different identifying variables. The merged databases yielded person-level files that provided a complete Medicaid dental treatment history for each recipient under age 21 treated during 1984–92. The final data set included 2.4 million indi-vidual dental procedures provided by nearly 1300 dentists for more than 61,000 recipients per year.
Claims data
The claims data for 1984–92 were obtained from the NC Division of Medical Assistance (DMA), the state agency re-sponsible for operation of the state’s Medicaid program. Because federal law mandates that all states maintain claims files in a Medicaid Management Information System and that resulting claims payment errors be kept below a defined stan-dard, the claims data were of relatively high quality. The claims data were limited to recipients under age 21, which we refer to as children.
Enrollment history
Information on enrollment in Medicaid in NC and eligibility for dental services is maintained by EDS Federal Corporation under contract with the DMA. The enrollment files were used to track a child’s eligibility to utilize dental ser-vices. These files also provided useful demographic information (e.g., race and gender) not available from the claims data files.
Provider data
The DMA maintains information on provider type and location that is identified by a Medicaid provider ID number. To obtain additional provider information, the claims data set was merged to provider files obtained from the NC Cooperative Health Information System, which is main-tained by the Sheps Center for Health Services Research at the University of North Carolina at Chapel Hill. This addi-tional provider information was based on providers’ NC dental license numbers.Inclusion of these data provided additional information about provider demographics and individual pro-vider practice characteristics.
Defining and selecting study population
Our first aim was to characterize the patterns of dental care for three- and eight-year-olds who began dental treatment in FY 1985–86. We selected this period to represent the earliest year for which data were available for the entire year. Three year olds were selected to represent preschool children in the primary dentition and to permit exploration of specific patterns of care for young, Medicaid-eligible children. Eight year olds were selected to represent those in the early mixed dentition, with the goal of exploring unique patterns of care for this age group.
Initially, the first cohort of patients for the study included three-year-old children whose birthdate fell between July 1, 1982 and June 30, 1983 and eight-year-old children whose birthdate fell between July 1, 1977 and June 30, 1978. Each child was classified by having:
1. An initial oral examination (ADA procedure code 00110)
2. An emergency oral examination (ADA procedure code 00130)
3. Other treatment
4. No treatment for the 12-month period of interest.
The initial examination or emergency examination served as a marker for the initiation of a given child’s treatment, from which point the child was tracked for 12 consecutive months. The other treatment and no dental services groups were
tracked 12 months from the date of their third or eighth birth-days. At our next level of analysis, we focused specifically on children enrolled for the full 12 months following an initial examination or emergency examination. We determined the types and numbers of dental services each child received for a consecutive 12-month period after treatment was initiated. Using the individual child as the unit of analysis, we created a person-level file that contained all claims data for the 12-month period immediately following the initial or emergency exami-nation for each child.
Characterizing patterns of care by categorical assignment To characterize patterns of care, we assigned each patient to one of five groups as follows: complete care, care under gen-eral anesthesia (GA Care), sporadic care, emergency care only, and no dental services. We defined these categories by exam-ining extensive claims data and by establishing a consensus among a panel of clinicians as to the constellations of proce-dures that were perceived to represent the five categories. To validate the categories, we ran pilot tests on subsets of claims and by examining treatment outcomes for individual patients, we revised the category definitions until the panel reached a census on definitions and categories. Initially we had planned to separate the groups according to their initiation of treat-ment (i.e., initial or emergency examination), however, the sample sizes of emergency examinations were too small to gen-erate meaningful analyses alone and were combined with the initial examination group according to the defined categories. Our final categories were defined as:
1. Complete Care. This pattern of care was defined as one where, within the 12-month window of interest, there was, a) an initial examination followed by a subsequent recall examination or b) an emergency examination fol-lowed by a recall examination.
2. Care under General Anesthesia. This pattern of care was defined as one wherein the child received restorative services in one visit via general anesthesia care (GA Care) in a hospital-based or outpatient operating room setting. 3. Sporadic Care. This pattern of care was defined as one wherein the child received a) an initial examination, no subsequent recall examination or b) an emergency ex-amination, no subsequent recall examination and three or more other visits.
4. Emergency Only Care. This pattern of care was defined as one wherein a child received a) an emergency exami-nation as a common denominator in all visits or b) an emergency examination and fewer than three other vis-its.
5. No Dental Services. Children in this group were defined as those enrolled for 100% of the FY, but received no dental care.
We acknowledge that many assumptions were made in our categorical assignments, some of which were undoubtedly due to this particular data set. These assumptions will be discussed later.
Provider classifications: general versus pediatric dentists At the next step in the analysis we looked at care by pro-vider classification (general dentists or pediatric dentists). Children who switched providers during the study were
ac-counted for and eliminated from the analysis. Our first aim was to compare patterns of care for the three- and eight-year-old age groups and by patterns of care provided by general versus pediatric dentists. Fisher’s exact test was used to test for differences and an alpha of 0.05 was used as the level of sig-nificance for all tests.
Our second aim was to characterize the pattern of dental care in the NC Medicaid Program for three- and eight-year-olds who began dental treatment during the 1990–91 FY. As a consequence of the Omnibus Budget Reconciliation Act of 1989 (OBRA, 1989), this cohort contained a much larger number of Medicaid-eligible children and a larger proportion of three-year-olds. We tracked the types and num-bers of dental services each child received for a consecutive 12-month period after treatment was initiated and we repli-cated for this cohort the same data analytic routines as described for the first cohort.
The third aim was to evaluate changes in access to care by comparing all parallel data for the two FY cohorts. Again we relied upon Fisher’s exact test and an alpha of 0.05 as the level of significance for all tests.
The final aim was to compare the mean number of visits per child and the mean number of procedures per visit per child by provider group. To analyze the mean number of visits and the mean number of procedures per visit per child for both cohorts, we used a factorial analysis of variance with three main effects (provider type, age, and cohort) and all possible pairwise interactions between the main effects. An alpha of 0.05 was used as the level of significance for all tests. When the overall model was significant and one or more of the interactions from the Type III sums of squares was not significant, a reduced model was run with only main effects and significant interac-tions from the full model.
Results
During 1985–86, 12,255 three-year-olds and 9144 eight-year-olds were enrolled in the NC Medicaid Program. The number enrolled for the full 12 months in 1985–86 included 5597 three-year-olds (46% of enrollees) and 4683 eight-year-olds (51% of enrollees). Table 1 illustrates the number and per-cent of children in the first cohort who received dental services compared to those who received no dental services. Table 1 also provides the distribution of initial oral examinations, emergency oral examinations, and other services filed for this cohort. A total of 1008 (18%) three-year-olds received an initial examination and 74 (1%) received an emergency exami-nation. A total of 695 (15%) eight-year-olds received an initial examination and 149 (3%) an emergency examination.
Table 2 illustrates the patterns of care that emerged. Fol-lowing an examination, 26% of the three-year-olds received complete care, 68% sporadic care, 2% GA care, and 4% emer-gency-only care. For the eight-year-olds, 26% received complete care, 66% sporadic care, less than 1% GA care, and 8% received emergency-only care. The relationship between age and pattern of care was significant (P<0.001); there was a trend for three-year-olds to receive more GA care and less emer-gency-only care.
Table 3 illustrates that for three-year-olds, following an ex-amination general dentists provided complete care for 23% of the children, sporadic care for 72%, GA care for 2%, and emer-gency-only care for 4%. For eight-year-olds, general dentists
provided complete care for 21%, sporadic care for 70%, GA care for 0.6%, and emergency-only care for 8%. This same table illustrates that for three-year-olds, following an exami-nation pediatric dentists provided complete care for 39% of the children, sporadic care for 53%, GA Care for 4%, and emergency-only care for 4%. For eight-year-olds, pediatric dentists provided complete care for 53%, sporadic care for 37%, GA care for 1%, and emergency-only care for 10%. There was a statistically significant difference in comparing general versus pediatric dentists by pattern of care (P<0.001); the trend was for pediatric dentists to provide more complete care, more GA care, and less sporadic care. For eight-year-olds, there was also a statistically significant difference in compar-ing general versus pediatric dentists (P=0.001); the trend was for pediatric dentists to provide more complete care and less sporadic care.
During 1990–91, 28,778 three-year-olds and 17,622 eight-year-olds were enrolled in the NC Medicaid Program. The number of children enrolled for the full 12 months for 1990–91 included 13,340 (46% of enrollees) three-year-olds and 8629 (49% of
enroll-ees) eight-year-olds. Table 4 illustrates the number and per-cent of children in this cohort who received dental services compared to those who re-ceived no dental services. Table 4 also provides the dis-tribution of initial oral examinations, emergency oral examinations, and other ser-vices filed for this cohort. A total of 1360 (10%) three-year-olds had an initial examination and 146 (1%)
re-ceived an emergency examination. A total of 807 (9%) eight-year-olds received an initial examination and 237 (3%) received an emergency examination.
Table 5 illustrates the patterns of care that emerged. Fol-lowing an examination, 41% of the three-year-olds received complete care, 50% sporadic care, 4% GA care, and 5% emer-gency-only care. For eight-year-olds, 38% received complete care, 49% sporadic care, 1% GA care, and 11% emergency-only care. The relationship between age and pattern of care was significant(P<0.001); there was a trend for three-year-olds to receive more GA care and less emergency-only care.
Table 6 illustrates that for three-year-olds, following an ex-amination general dentists provided complete care for 39% of the children, sporadic care for 54%, GA care for 2%, and emergency-only for 5%. For eight-year-olds, general dentists provided complete care for 37% of the children, sporadic care for 51%, GA care for 1%, and emergency-only care for 11%. This same table illustrates that for three-year-olds, following an examination, pediatric dentists provided complete care for 50% of the children, sporadic care for 38%, GA care for 9%, and emergency-only care for 3%. For eight-year-olds, pediatric dentists provided complete care for 56%, sporadic care for 31%, GA care for 2%, and emergency-only care for 11%. Following an examination, for three-year-olds there was a statistically significant difference in comparing general versus pediatric dentists by pattern of care (P<0.001); there was a trend for pediatric dentists to provide more complete and GA care, but less sporadic care. For eight-year-olds, there was also a statistically significant difference (P=0.001); pediatric dentists tended to provide more complete care and less sporadic care.
In specific aim three, we compared the 1985–86 versus 1990–91 cohorts. For three-year-olds, following an examina-tion there was a statistically significant difference in comparing the first versus second cohort by pattern of care (P<0.001); there was the same trend for the second cohort to receive more complete and less sporadic care. For eight-year-olds, there was a statistically significant difference between the two cohorts also (P<0.001); the same trend was noted as the three-year-old children.
For three-year-olds, following an examination by a general dentist there was a statistically significant difference in com-paring the first versus second cohort by pattern of care (P<0.001); there was a trend for the second cohort to receive more complete and less sporadic care. For eight-year-olds, there Table 2. Patterns of Care Assigned by Categories
for 1985–86 Age 3 Age 8 Patterns of Care N (%) N (%) Complete Care 277 (26) 215 (26) Sporadic Care 740 (68) 556 (66) GA Care 26 (2) 5 (<1) Emergency-Only Care 39 (4) 68 (8) Total 1082 (100) 844 (100) Age 3 Age 8 GDs PDs GDs PDs (N=370) (N=40) (N=392) (N=28) Patterns of Care N (%) N (%) N (%) N (%) Complete Care 185 (23) 76 (39) 153 (21) 55 (53) Sporadic Care 585 (72) 102 (53) 507 (70) 38 (37) GA Care 17 (2) 8 (4) 4 (6) 1 (1) Emergency-Only Care 30 (4) 7 (4) 58 (8) 10 (10) Total 817 (100) 193 (100) 722 (100) 104 (100)
Table 3. Percentage of Children Seen by General vs. Pediatric Dentists in 1985–86
N=Number of children.
Utilization Age 3 Age 8
Class N (%) N (%)
Initial Examination 1008 (18) 695 (15) Emergency Examination 74 (1) 149 (3) Other Services 302 (5) 999 (21) No Dental Services 4213 (75) 2840 (61) Total (first cohort) 5597 (100) 4683 (100) Table 1. Utilization of Selected Dental Services for
was the same trend for the second cohort to receive more com-plete and less sporadic care (P <0.001).
For three-year-olds, following an examination by a pediat-ric dentist there was a statistically significant difference in comparing the first versus second cohort by pattern of care (P=0.006); there was a trend for the second cohort to receive more complete and GA care but less sporadic care. There was no statistically significant difference for eight-year-old children (P=0.817).
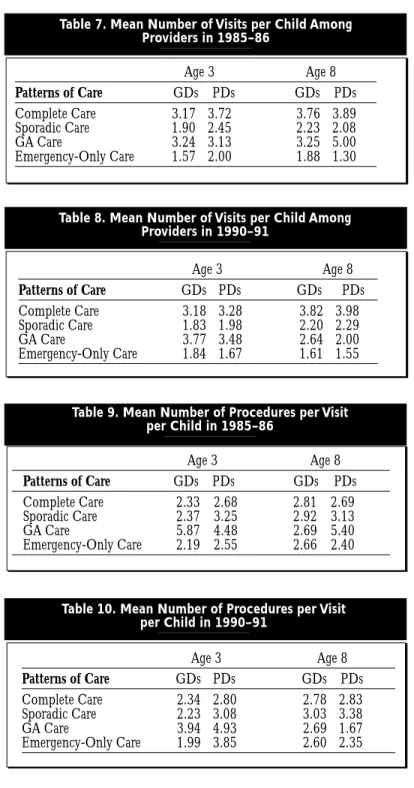
The final aim was to compare the mean number of visits per child and the mean number of procedures per visit per child by provider group. Tables 7 and 8 illustrate these finding. Following an examination, the complete care group and the sporadic care groups had main effect differences. For both co-horts by age, eight-year-olds had more visits than three-year-olds and by provider group pediatric dentists provided more visits than general dentists. There was no significant difference for the general anesthesia and emergency-only care groups.
Tables 9 and 10 illustrate that the complete care group had a significant interaction. The interaction of provider by age revealed that for three-year-olds, pediatric dentists provided more procedures than general
den-tists. For eight-year-olds, the average number of procedures was quite similar. For the gen-eral anesthesia care group there was a main effect difference. For both cohorts by age,three-year-olds received more procedures than eight-year-olds. For the emergency-only care group, there was a significant interac-tion. The interaction of provider by age revealed that for three-year-olds, pediatric dentists provided more procedures than gen-eral dentists. For eight-year-olds, gengen-eral dentists provided more procedures than
pe-diatric dentists. There was no significant difference for the spo-radic care group.
Discussion
One shortcoming of this study is that it is limited to Medic-aid patients. Similar analysis and comparison with an age-and date-matched non-Medicaid patient group is an intrigu-ing concept, but we do not currently have access to such a data set.
Limited utilization of dental services for Medicaid-eligible children appears to be a widespread phenomenon. For ex-ample, the 1996 OIG report found that only 20% of the Medicaid-eligible children received any dental services in 1993 and for NC, this figure was 14%.5 In this context, the focus of the current study on the small population of children able to utilize dental care seems reasonable.
The pilot-testing for arriving at our five categories of care involved laborious computer runs on the claims data to arrive at various algorithms that were judged to represent the pat-terns of care that we selected. Even so, we made many assumptions about the final categories. For example, it is likely that some children reached the recall examination stage with-out having the initial restorative needs completed. It is possible also that a few patients assigned to the sporadic care category may have received care that could be argued as complete care. We acknowledge these and other limitations in deriving our categories. Even so, in studying trial runs of the claims data using our final categorical definitions, the panel of clinicians endorsed the validity of the categories.
We point out that this data set had some features that may be unique to North Carolina. For example, some other states may not reimburse for the emergency examination per se. However, during this study period NC Medicaid did reim-burse for emergency examinations along with other emergency treatment procedures. Accordingly, we are confident that we captured accurate data for emergency care.
Across provider groups, the three-year-olds tended to receive more GA care and less emergency only care than eight-year-olds. These findings were not unexpected because the younger children probably exhibit more behavioral problems that result in a recommendation for GA care. This GA care would be expected to decrease the need for an emergency visit.
General dentists tended to provide more GA care and less emergency only care for three-year-olds than eight-year-olds, consistent with the age-related logic. Pediatric dentists tended to provide more sporadic care and GA care and less complete
N=Number of children.
Utilization Age 3 Age 8
Class N (%) N (%)
Initial Examination 1360 (10) 807 (9) Emergency Examination 146 (1) 237 (3)
Other Services 671 (5) 1935 (22)
No Dental Services 11,163 (84) 5650 (66) Total (second cohort) 13,340 (100) 8629 (100) Table 4. Utilization of Selected Dental Services for
Patients with 100% Enrollment in 1990–91
Age 3 Age 8 Patterns of Care N (%) N (%) Complete Care 610 (41) 400 (38) Sporadic Care 753 (50) 514 (49) GA Care 65 (4) 13 (1) Emergency-Only Care 78 (5) 117 (11) Total 1506 (100) 1044 (100)
Table 5. Patterns of Care Assigned by Categories in 1990–91 Age 3 Age 8 GDs PDs GDs PDs (N=395) (N=35) (N=409) (N=29) Patterns of Care N (%) N (%) N (%) N (%) Complete Care 417 (39) 137 (50) 337 (37) 55 (56) Sporadic Care 573 (54) 105 (38) 461 (51) 31 (31) GA Care 22 (2) 25 (9) 11 (1) 2 (2) Emergency-Only Care 50 (5) 9 (3) 101 (11) 11 (11) Total 1062 (100) 276 (100) 910 (100) 99 (100) Table 6. Percentage of Children Seen by General Versus Pediatric
and emergency-only care for three-year-olds than eight-year-olds. This finding is surprising in some respects. The increased GA care can be explained by age-related child behavior, which also helps to explain the decrease in the emergency-only care as stated earlier. The increase in sporadic care and decrease in complete care was unexpected. These findings may be due to the fact that this age group had difficulty obtaining access to the needed dental care and thus were receiving care in a more sporadic or as needed basis. Another explanation might be that parents are less aware of their children’s dental needs at age three, or less convinced that the younger children need regu-lar dental care.
In comparing general versus pediatric dentists by pattern of care in the first cohort, the pediatric dentists tended to
pro-vide more complete and GA care and less sporadic care for the three year olds and more complete and less spo-radic care for the eight year olds. Probably there are several explanations for this finding. Because pediatric dentists treat children exclusively, they may have been more successful in providing complete care because of their advanced clinical training, as well as additional expertise in behavior management. Pediatric dentists also rely more upon office-based conscious sedation as an alternative to hospital-based general anesthesia.
Our second aim was to characterize the patterns of care three- and eight-year-old children received during 1990–91. Across the provider groups combined, the three-year-olds tended to receive more GA care and less emergency-only care than eight-year-olds, and this was not unexpected because of the same trend noted in 1985–86. When care was provided by general dentists, three-year-olds tended to receive more GA care and spo-radic care and less emergency-only care than eight-year-olds. The same age-related logic can be used for this cohort. As was noted for the first cohort, pedi-atric dentists tended to provide more GA and sporadic care and less complete and emergency-only care for three- versus eight-year-olds in this cohort. Again this finding was surprising and related to the same issues stated for the first cohort.
In comparing general versus pediatric dentists, the pediatric dentists tended to provide more complete and GA care and less sporadic care for the three-year-olds and more complete and less sporadic for the eight-year-olds in the second cohort. This finding was noted for the first cohort also and the only explanation we can offer relates to the difference in training of the two provider groups.
In comparing 1985–86 to 1990–91, children in the latter group tended to receive more complete care and less sporadic care for both age groups. This finding was surprising in light of the fact that the second cohort in-cluded twice as many children as the first cohort. We expected a trend of decreasing complete care and in-creasing sporadic care based on the changes in Medicaid enrollment and anecdotal reports of growing frustration of providers with Medicaid. Even so, there were a larger percentage of children who received no care in 1990– 91 as compared to the 1985–86.
General dentists tended to provide more complete and less sporadic care for both age groups in the second cohort. This finding was encouraging and the possible logic was discussed previously. In contrast, the pediatric dentists tended to provide more complete and GA care but less spo-radic care for three-year-olds in the second cohort, but they did not differ for eight-year-olds between the two cohorts.
The average number of visits in both cohorts showed sig-nificant differences by age and provider type, but these differences were small and had limited clinical relevance. Con-sidering the fact that some categories were derived by the number of visits as a criteria for inclusion in a specific pattern of care (i.e., the complete care, sporadic care, and no dental services groups), this finding was not unexpected. Overall, the data showed a tendency for the pediatric dentists to provide more procedures per patient than the general dentists,but the
Age 3 Age 8 Patterns of Care GDs PDs GDs PDs Complete Care 3.17 3.72 3.76 3.89 Sporadic Care 1.90 2.45 2.23 2.08 GA Care 3.24 3.13 3.25 5.00 Emergency-Only Care 1.57 2.00 1.88 1.30 Table 7. Mean Number of Visits per Child Among
Providers in 1985–86 Age 3 Age 8 Patterns of Care GDs PDs GDs PDs Complete Care 3.18 3.28 3.82 3.98 Sporadic Care 1.83 1.98 2.20 2.29 GA Care 3.77 3.48 2.64 2.00 Emergency-Only Care 1.84 1.67 1.61 1.55 Table 8. Mean Number of Visits per Child Among
Providers in 1990–91 Age 3 Age 8 Patterns of Care GDs PDs GDs PDs Complete Care 2.33 2.68 2.81 2.69 Sporadic Care 2.37 3.25 2.92 3.13 GA Care 5.87 4.48 2.69 5.40 Emergency-Only Care 2.19 2.55 2.66 2.40 Table 9. Mean Number of Procedures per Visit
per Child in 1985–86
Table 10. Mean Number of Procedures per Visit per Child in 1990–91 Age 3 Age 8 Patterns of Care GDs PDs GDs PDs Complete Care 2.34 2.80 2.78 2.83 Sporadic Care 2.23 3.08 3.03 3.38 GA Care 3.94 4.93 2.69 1.67 Emergency-Only Care 1.99 3.85 2.60 2.35
differences were marginally important from a clinical perspec-tive. In both cohorts, pediatric dentists tended to provide more procedures per patient for the three-year-old children, but the general and pediatric dentists did not differ in the number of procedures per visit provided for the eight-year-old children in the complete care group.
Conclusions
1. Use of Medicaid dental services by eligible three- and eight-year-old children in North Carolina was severely limited in FYs 1985–86 and 1990–91. Even for chil-dren enrolled for 100% of fiscal years studied, a substan-tial majority received no services.
2. For those children who received any dental services, the proportion of children receiving complete care was low for both age groups and both FYs examined. This finding suggests that financing dental care through Medicaid results in very low levels of complete care among enrollees.
3. Pediatric dentists tended to provide more complete care and less sporadic care for both three- and eight-year old children in both the 1985–86 and 1990–91 cohorts. This finding suggests any plan that limits referrals to pe-diatric dentists might adversely affect the number of enrollees who receive complete care.
This study was supported by the Maternal and Child Health Training Grant #MCJ 379494.
References
1. Bolden AJ, Henry JL, Allukian M: Implication of access uti-lization and need for oral health care by low income groups and minorities on the dental delivery system. J Dent Educ 57:888–98, 1993.
2. US Department of Health, Education, and Welfare, Health Care Financing Administration: A Guide to Dental care for
the Early and Periodic Screening, Diagnosis, and Treatment Program (EPSDT) under Medicaid. Washington DC, 1980. 3. US Congress, House. January 2, 1968. An Act to amend the
Social Security Act. Public Law 90-24g, HR 12080. 4. US Congress, Office of Technology Assessment. Children’s
dental services under the Medicaid program. Washington, DC: US. Government Printing Office, September 1990. 5. Office of Inspector General. Children’s dental services
un-der Medicaid access and utilization. April 1996.
6. Millman M, Ed: Access to health care in America. Wash-ington, DC: National Academy Press, 1993.
7. Venezie RD, Vann WF, Jr: Pediatric dentists’ participation in the North Carolina Medicaid Program. Pediatr Dent 15:175–81, 1993.
8. Venezie RD, Vann WF, Jr, Cashion SW, Rozier RG: Pedi-atric and General Dentists’ Participation in the North Caro-lina Medicaid Program: Trends from 1986-92. Pediatr Dent 19:114–17, 1997.
9. Hayward RA, Meetz HK, Shapiro MF, Freeman HE: Utilization of dental services. J Public Health Dent 50: 147–52, 1989.
10. Waldman HB: Would you believe decreases in dental caries and increases in demand for dental care? ASDC J Dent Child 56:257–61, 1989.
11. Newman JF, Gift HC: Regular pattern of preventive dental services(a measure of access. Soc Sci Med 35: 997–1001, 1992.
12. Kanellis MJ, Damiano PC, Monany ET: Utilization of den-tal services by Iowa Medicaid-enrolled children younger than 6 years old. Pediatr Dent 19:310–14, 1997.
13. McCunniff MD, Damiano PC, Kanellis MJ, Levy SM: The impact of WIC dental screenings and referrals on utilization of dental services among low-income children. Pediatr Dent 20:181–87.
The purpose of this study was to determine the blood plasma concentrations of lidocaine in small children undergoing quadrant dentistry while deeply sedated. The data were reported descriptively.
It is commonly accepted that blood plasma concentrations of lidocaine between 5-10 micrograms/milliliter are toxic to children. Most dental texts on anesthesia use 4.4 mg/kg of lidocaine as the maximum safe dosage for children und ergoing treatment under sedation. This study challenges these dosage limitations
Twelve children ranging in age from 55-150 months were treated under IV sedation for are described as routine dental procedures. Half of the children had the IV started after a eutectic mixture of lidocaine and prilocaine (EMLA Cream ©) was applied over the venipuncture site. While the other half had only a small amount of lidocaine 2% injected subcutaneously prior to venipuncture. All children were sedated with midazolam, fentanyl and propofol. Blood was drawn out of the IV catheter at 5-minute intervals after the IV was started and the blood plasma concentrations were measured. All children received local anesthetic sufficient to prevent responses to painful stimuli. The dosages ranged from 2.6-6.4 mg/kg. The blood plasma concentration ranged from 0.7-3.8 microgram/ml. The children for who the EMLA Cream was used had higher plasma concentrations than the children who did not. In no cases did any of the plasma concentrations reach the toxic level. The authors concluded that dental anesthesia using lidocaine is safe and that higher amounts could be used without reaching toxic levels.
Comment: A look at the actual data shows quite a wide range of peak blood plasma concentrations as compared to the dosage. In some cases there was no real correlation between dose and the plasma concentrations reported. The authors made no attempt to explain this phenomenon. Also noted is the fact that the data in this study was so random that no statistical analysis was possible. More research in this area is needed. MGP
Jurevic, Richard, et al Anesth. Prog. 45:87-90 1998.