Creating Interactive Dashboard applications using the
LiveCycle Data Services Message Service
Table of contents
Introduction ... 1
Start the J2EE application server hosting LiveCycle Data Services ... 5
Create a Flash Builder project ... 5
Develop the application logic for the dashboard application ... 5
Configure LiveCycle Data Services ... 29
Introduction
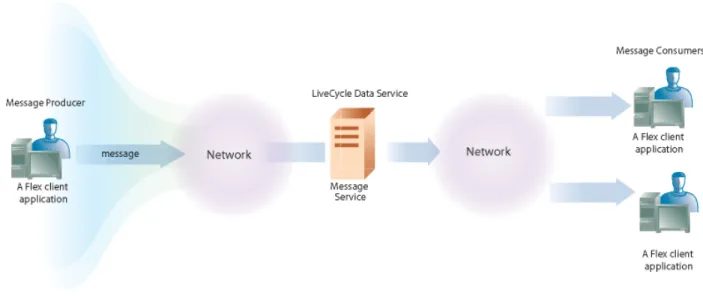
You can programmatically create a Rich Internet Application (RIA) that displays enterprise data by using the LiveCycle Data Services Message Service. You use the Flex client-side API and the server-side Message service to create messaging applications. A client application connects to a message destination on the server, sends messages to the server, and receives messages that were initiated by other client applications. Messages sent to the server are routed to other client applications that have subscribed to the same destination. Therefore if data is modified in one client application, other client applications that subscribe to the destination are updated in real time. That is, any other dashboard application that subscribes to the same destination has the exact same data view.
Client applications that send messages to LiveCycle Data Services are called message producers. You define a producer in a client application by creating a Producer object. Client applications that receive messages from LiveCycle Data Services are called message
consumers. You define a consumer in a client application by creating a Consumer object. An application can be both a message producer and a message consumer. When using both a message producer and a message consumer in the same application, ensure that they both reference the same destination.
For information about the LiveCycle Data Services Message service, see the Message Service chapter in the Using Adobe LiveCycle Data Services Guide.
The following illustration shows messages being passed between producer applications, consumer applications, and LiveCycle Data Services.
Figure 1 – Producer and Consumer client applications interacting with LiveCycle Data Services
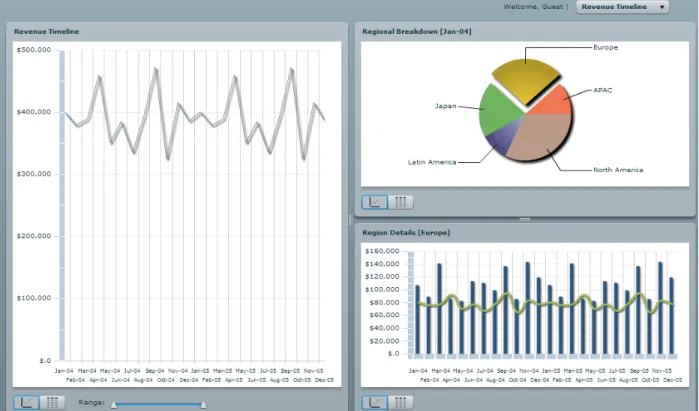
The dashboard application enables users to view data in controls such as a pie chart and a data grid control. When the user modifies data located in a control, for example, adjusts the range control, the view is changed. As a result, a message is created and sent to the
Message service. All client applications that subscribe to the destination are updated. The following illustration provides a visual representation of the dashboard application built using Flash Builder 4.0.
Figure 2 – The DashBoard application displaying data by using the LiveCycle Data Services Message service
For simplicity, the data that is used by the Dashboard application is located in an XML file named results.xml. Typically data is provided by Java server-side classes deployed on the LiveCycle Data Services server.
The following code represents a portion of the data located in the results.xml file.
<list>
<month name="Jan-04" revenue="400263" average="80052"> <region name="APAC" revenue="46130"/>
<region name="Europe" revenue="106976"/> <region name="Japan" revenue="79554"/>
<region name="Latin America" revenue="39252"/> <region name="North America" revenue="128351"/> </month>
<month name="Feb-04" revenue="379145" average="75829"> <region name="APAC" revenue="70324"/>
<region name="Europe" revenue="88912"/> <region name="Japan" revenue="69677"/>
<region name="North America" revenue="90804"/> </month>
</list>
The complete XML file that is used to populate the Dashboard application is available as a file attachment to the PDF document that corresponds to this development article. The data located in the XML file is retrieved by using a HTTPService object. The URL
property of the HTTPService object is set to result.xml, which means that the XML file is
located in the project’s root folder. The controls in the dashboard application display the data located in the XML file.
The objective of this development article is to guide you through how to build this
application and to explain some key concepts related to the Message service. To create a dashboard application by using the Message service, perform the following tasks:
1. Start the J2EE application server hosting LiveCycle Data Services. 2. Create a Flash Builder 4 project.
3. Develop the application logic for the dashboard application. 4. Configure LiveCycle Data Services.
Sample Files
Files created in this development article correspond to sample files that are available with LiveCycle Data Services. As you read through this article, it is recommended that you reference the sample files. This article explains the main application logic located in the MXML files that create this application. For example, the Consumer and Producer objects are explained. All the application logic that is required to run this application is provided in this article.
Prerequisite knowledge
This development article is intended for ActionScript developers whom want to create applications for LiveCycle Data Services.
About the author
Scott Macdonald is a senior SDK content and community lead at Adobe Systems with 13 years in the software industry working with Java, C/C++/C#, ActionScript as well as other programming languages.
Start the J2EE application server hosting LiveCycle Data Services
Start the J2EE application server hosting LiveCycle Data Services.
Click Start, All Programs, Adobe, LiveCycle Data Services ES 3.1, Start LiveCycle Data Services Server.
Create a Flash Builder project
Create a Flash Builder project that is used to create the client application. This project references the J2EE application server hosting LiveCycle Data Services. That is, when you create the project, select J2EE as the Application Server type and LiveCycle Data Services as the application server. After you create the project, all of the client libraries required to interact with the J2EE application server are added to your project’s class path.
To create a client project by using Flash Builder 4, perform the following steps: 1. Start Flash Builder 4 by clicking Start, All Programs, Adobe Flash Builder 4. 2. Create a new project.
3. In the Project Name box, specify a name for your project. 4. Under Application Type, select Web.
5. Specify version 3.5 for the Flex SDK version. 6. In the Application Server list, select J2EE.
7. Select the Use Remote Access Service check box. 8. Select LiveCycle Data Services check box.
9. In the Root folder box, specify the root folder value. For example, specify
C:\lcds\tomcat\webapps\lcds.
10.In the Root URL box, specify the root URL folder value. For example, specify
http://localhost:8400/lcds/.
11.In the Content root box, specify the Context root value. For example, specify /lcds.
12.Accept the Output folder default value. 13.Click Finish.
Develop the application logic for the dashboard application
dashboard.mxml - represents the main application file. This file defines the Consumer and the Producer objects that interact with LiveCycle Data Services. This file also defines a HTTPService object that retrieves data from the XML data source. The views defined in this file are separated into three sections: the regional
breakdown, regional details view, and the revenue timeline view. (The illustration of the Dashboard application shown at the beginning of this development article shows the three views.)
RegionalBreakdown.mxml - represents a pie chart control that displays the five
regions defined in the results.xml file. You can click a specific area to obtain information about the region.
RegionDetail.mxml - represents a column chart control that displays data located
in the results.xml file. For example, when you click a section in the pie chart, the view in the column chart is updated.
RevenueTimeline.mxml - represents a line chart control that displays revenue
data over a time period. A slider control located in the dashboard.mxml file is bound to the line chart control and enables you to change the time period view. Once the time period view is adjusted, the data in the column chart is updated.
SortUtils - represents a utility class that sorts data by dates.
The following illustration shows the Flash Builder project that creates the dashboard application.
The SWC files are automatically added to the project as described in the Create a Flash Builder project topic. The main.css file is available with the sample files available with
LiveCycle Data Services. Also, be sure to include the result.xml file to your project. This XML file is available as a file attachment to the PDF document that corresponds to this
development article.
Create the dashboard file
The dashboard.mxml file is the main application file for the Dashboard application. This file defines the Producer and Consumer objects that interact with the LiveCycle Data Services server. The destination for both objects is dashboard, which is defined in the messaging-config.xml file. For example, when data is modified in a control (for example, the time period is adjusted), a message is created and sent to the dashboard destination.
The following code snippet creates the Producer and Consumer objects using mxml tags. <!-- Define the Producer and Consumer that interacts with the Message Service -->
<mx:Producer id="producer" destination="dashboard"/> <mx:Consumer id="consumer" destination="dashboard" message="messageHandler(event)"/>
An HTTPService object is also defined in the dashboard.mxml file. This object is responsible
for retrieving data from the results.xml file. The following code snippet defines the
HTTPService object named srv.
<!-- Define the HTTPService component that retrieves data from the results.xml file -->
<mx:HTTPService id="srv" url="results.xml" useProxy="false" result="resultHandler(event)"/>
When the application is started, the initApp function defined in dashboard.mxml is
invoked. Within this method, the following tasks occur:
The Consumer object’s subscribe method is called. This method creates a subscription to
the dashboard destination, which is defined in the messaging-config.xml file. (See Configure
LiveCycle Data Services.)
The HTTPService object’s send method is invoked. Data located in the result.xml file is
retrieved. After the data is retrieved, the resultHandler method is invoked. This event
handler is defined in the MXML tag that defines the HTTPService object.
When the XML data that the HTTPService object references is retrieved, the resultHandler
method is invoked. The first task that occurs in resultHandler is a monthData array is
populated with the data returned by the HTTPService object:
//Populate the monthData array with XML data returned by the HTTP service monthData = event.result.list.month.source as Array;
The monthData array populates the HSlider object’s maximum and values data members.
The HSlider object represents the slider control that is displayed in the Revenue Timeline
view. When the user adjusts the slider control, the rangeChange method is invoked (the rangeChange method is defined in the HSlider object’s change field).
The following code snippet shows the MXML tag that defines a panel that represents the Revenue Timeline view.
<mx:Panel id="timelinePanel" title="Revenue Timeline" width="100%" height="100%">
<RevenueTimeline id="timeline" revenueData="{slicedMonthData.source}" monthChange="monthChange()"/>
<mx:ControlBar horizontalGap="4">
<mx:ToggleButtonBar dataProvider="{timeline}"/> <mx:Spacer width="10"/>
<mx:Label text="Range:"/>
<mx:HSlider id="slider" width="150" thumbCount="2" snapInterval="1"
minimum="0" dataTipFormatFunction="getSliderLabel" change="rangeChange()"/>
</mx:ControlBar> </mx:Panel>
The bolded code represents the HSlider object that is associated with the Revenue Timeline view.
Creating messages when the range control is adjusted
The rangeChange method creates an IMessage instance by using the AsyncMessage
constructor. This instance represents the message that is sent to LiveCycle Data Services when the user adjusts the slider range control. The HSlider object’s minimum and maximum
values are used to populate the body of the message. The message is sent to LiveCycle Data Services by invoking the Producer object’s send message and passing the IMessage
object. As a result, client applications that subscribe to the dashboard destination are
updated with the new range view.
The following code snippet shows the rangeChange method.
//Create a new message when the slider control is adjusted private function rangeChange():void
{
var message:IMessage = new AsyncMessage();
message.body = {min: slider.values[0], max: slider.values[1]+1}; producer.send(message);
}
Creating messages when the pie chart is clicked
The monthData array also populates the regionData array in the resultHandler method.
The regionData array is populated by iterating through the monthData array and calculating
data such as the monthly total for each region. The regionData array populates an ArrayCollection instance named slicedRegionData. The slicedRegionData instance
populates the Region Breakdown view (the pie chart control). When a user clicks the pie chart, then the regionChange method is invoked.
Like the rangeChange method, the regionChange method creates an IMessage instance by
using the AsyncMessage constructor. This message represents the message that is sent to
object’s selectedRegion data member populates the message body. The message is sent
to LiveCycle Data Services by invoking the Producer object’s send message and passing the IMessage object.
The following code snippet shows the regionChange method. //Create a new message when the pie chart is clicked private function regionChange():void
{
var message: IMessage = new AsyncMessage();
message.body = {region: regionBreakdown.selectedRegion}; producer.send(message);
}
Handling incoming messages
When the Consumer object is created, the message data member is assigned the value messageHandler. This results in the messageHandler method handling incoming messages
sent from LiveCycle Data Services. An Object instance is created by retrieving the massage
from the event parameter, as shown in the following code snippet.
var body:Object = event.message.body;
The remaining application logic in messageHandler populates the data collection objects
that are used to populate the controls located in the dashboard application. The following application logic represents the messageHandler method.
// Handle incoming messages
private function messageHandler(event:MessageEvent):void {
var body:Object = event.message.body;
if (body.min != null) //range {
slider.values = [body.min, body.max - 1]; if (monthData != null)
slicedMonthData.source = monthData.slice(body.min, body.max); if (regionData != null)
slicedRegionData.source = regionData.slice(body.min, body.max); }
else if (body.month != null) //month in timeline {
regionBreakdown.month = body.month; }
else if (body.region != null) //region from breakdown {
regionBreakdown.selectedRegion = body.region; regionDetail.region = body.region.name;
for (var i: Number = 0; i < monthData.length; i++) {
var regions: Array = monthData[i].region.source; for (var j: Number = 0; j < regions.length; j++) { if (regions[j].name == body.region.name) { regionData[i].revenue = regions[j].revenue; break; } } }
slicedRegionData.source = regionData.slice(slider.values[0], slider.values[1] + 1);
} }
dashboard.mxml file
The following code represents the entire dashboard.mxml file.
<?xml version="1.0" encoding="utf-8"?>
<mx:Application xmlns:mx="http://www.adobe.com/2006/mxml" xmlns="*" pageTitle="Collaborative Dashboard" creationComplete="initApp()">
<mx:Style source="main.css"/> <mx:Script> <![CDATA[ import mx.messaging.messages.AsyncMessage; import mx.messaging.messages.IMessage; import mx.collections.ArrayCollection; import mx.messaging.events.MessageEvent; import mx.rpc.events.ResultEvent; [Bindable]
public var slicedMonthData:ArrayCollection;
[Bindable]
private var monthData:Array; private var regionData:Array;
private function initApp():void {
consumer.subscribe(); srv.send();
slicedMonthData = new ArrayCollection(); slicedRegionData = new ArrayCollection(); }
private function resultHandler(event:ResultEvent):void {
monthData = event.result.list.month.source as Array; slider.maximum = monthData.length - 1;
slider.values = [0, monthData.length - 1]; slicedMonthData.source = monthData;
regionBreakdown.month = monthData[0]; regionData = new Array(monthData.length); var monthTotal:Number;
for (var i:Number = 0; i < monthData.length; i++) {
regionData[i] = {name: monthData[i].name, average: 0, revenue: 0}; var regions:Array = monthData[i].region.source;
monthTotal = 0;
for (var j:Number = 0; j < regions.length; j++) { monthTotal += regions[j].revenue; } regionData[i].average = monthTotal/monthData[i].region.length } slicedRegionData.source = regionData.slice(slider.values[0], slider.values[1]); }
private function getSliderLabel(value:String):String {
return monthData[parseInt(value)].name; }
// Send messages when user's selection changes private function monthChange():void
var message:IMessage = new AsyncMessage(); message.body = {month: timeline.selectedMonth}; producer.send(message);
}
private function rangeChange():void {
var message:IMessage = new AsyncMessage();
message.body = {min: slider.values[0], max: slider.values[1]+1}; producer.send(message);
}
private function regionChange():void {
var message: IMessage = new AsyncMessage();
message.body = {region: regionBreakdown.selectedRegion}; producer.send(message);
}
// Handle incoming messages
private function messageHandler(event:MessageEvent):void {
var body:Object = event.message.body; if (body.min != null) //range
{
slider.values = [body.min, body.max - 1]; if (monthData != null)
slicedMonthData.source = monthData.slice(body.min, body.max); if (regionData != null)
slicedRegionData.source = regionData.slice(body.min, body.max); }
else if (body.month != null) //month in timeline {
regionBreakdown.month = body.month; }
else if (body.region != null) //region from breakdown {
regionBreakdown.selectedRegion = body.region; regionDetail.region = body.region.name;
for (var i: Number = 0; i < monthData.length; i++) {
var regions: Array = monthData[i].region.source; for (var j: Number = 0; j < regions.length; j++)
{ if (regions[j].name == body.region.name) { regionData[i].revenue = regions[j].revenue; break; } } }
slicedRegionData.source = regionData.slice(slider.values[0], slider.values[1] + 1);
} }
private function toggleSeries():void {
var message: IMessage = new AsyncMessage(); if (currentState=="series") { currentState = ""; message.body.series = false; } else currentState = "series"; message.body.series = true; } producer.send(message); }
private function dataGridCurrencyFormat(item:Object, column:Object):String {
return cf.format(item[column.dataField]); }
]]>
</mx:Script>
<mx:Producer id="producer" destination="dashboard"/> <mx:Consumer id="consumer" destination="dashboard" message="messageHandler(event)"/>
<mx:HTTPService id="srv" url="results.xml" useProxy="false" result="resultHandler(event)"/>
<mx:HBox width="100%" verticalAlign="middle" horizontalAlign="right" paddingRight="40">
<mx:Label text="Welcome, Guest |"/> <mx:ComboBox id="cb"> <mx:dataProvider> <mx:String>Revenue Timeline</mx:String> </mx:dataProvider> </mx:ComboBox> </mx:HBox>
<mx:HDividedBox width="100%" height="100%">
<mx:Panel id="timelinePanel" title="Revenue Timeline" width="100%" height="100%">
<RevenueTimeline id="timeline" revenueData="{slicedMonthData.source}" monthChange="monthChange()"/>
<mx:ControlBar horizontalGap="4">
<mx:ToggleButtonBar dataProvider="{timeline}"/> <mx:Spacer width="10"/>
<mx:Label text="Range:"/>
<mx:HSlider id="slider" width="150" thumbCount="2" snapInterval="1" minimum="0"
dataTipFormatFunction="getSliderLabel" change="rangeChange()"/>
</mx:ControlBar> </mx:Panel>
<mx:VDividedBox width="100%" height="100%">
<RegionBreakdown id="regionBreakdown" regionChange="regionChange()" width="100%" height="50%" />
<RegionDetail id="regionDetail" revenueData="{slicedRegionData.source}" width="100%" height="50%" />
</mx:VDividedBox> </mx:HDividedBox> </mx:Application>
Create the RegionalBreakdown file
The RegionalBreakdown.mxml file displays the region data in the region.xml file within a pie chart control. The pie chart control is defined by using a PieChart MXML tag. The name of the PieChart instance is pcRegion, as shown in the following code snippet.
<mx:PieChart id="pcRegion" dataProvider="{_month.region}" showDataTips="true" width="100%" height="100%"
itemClick="regionChange(event.hitData.item)" dataTipFunction="formatDataTip">
As defined in this tag, when a user clicks the pie chart, the regionChange method is
invoked. A HitData object is dispatched to this method when a user clicks an item in the
series. The data provider for the pie chart control is an object named _month, as defined in
the following code snippet.
[Bindable]
private var _month:Object;
The _month data provider is populated by using the set month method, as shown in the
following code snippet.
public function set month(m:Object):void {
_month = m;
this.title = "Regional Breakdown [" + _month.name + "]"; }
This set method is invoked in the resultHandler method that is defined in the
dashboard.mxml file, as shown in the following code snippet.
regionBreakdown.month = monthData[0];
Each time a new message is detected, this set method is invoked in the messageHandler
method (defined in the dashboard.mxml file). That is, when the Consumer object detects a
new incoming message, the messageHandler method handles the incoming message and
the set method defined in the RegionalBreakdown.mxml file is invoked.
When a user clicks an item in the pie chart, the selectedRegion method is invoked. The
clicked item is exploded, as shown in the following code snippet.
public function set selectedRegion(item:Object):void {
_selectedRegion = item; var index:int = -1;
for (var i:int=0; i < _month.region.length && index == -1; i++) if (_month.region[i].name == item.name)
index = i; }
var explodeData:Array = []; explodeData[index] = 0.15;
pcRegion.series[0].perWedgeExplodeRadius = explodeData; }
A RegionBreakdown object named regionBreakdown is defined in the dashboard.mxml file
by using an MXML tag, as shown by the bolded line in the following code snippet.
<mx:VDividedBox width="100%" height="100%">
<RegionBreakdown id="regionBreakdown" regionChange="regionChange()" width="100%" height="50%" />
<RegionDetail id="regionDetail" revenueData="{slicedRegionData.source}" width="100%" height="50%" />
</mx:VDividedBox>
The following code represents the entire RegionalBreakdown.mxml file.
<?xml version="1.0" encoding="utf-8"?> <mx:Panel xmlns:mx="http://www.adobe.com/2006/mxml" xmlns="*"> <mx:Metadata> [Event("regionChange")] </mx:Metadata> <mx:Script> <![CDATA[ import mx.charts.HitData;
public function set month(m:Object):void {
_month = m;
this.title = "Regional Breakdown [" + _month.name + "]"; }
[Bindable]
private var _month:Object;
private function getSliceLabel(item:Object, arg2:String, arg3:Number, arg4:Number):String
{
return item==null?"":item.name; }
private var _selectedRegion:Object;
public function get selectedRegion():Object {
return _selectedRegion; }
public function set selectedRegion(item:Object):void {
_selectedRegion = item; var index:int = -1;
for (var i:int=0; i < _month.region.length && index == -1; i++) {
if (_month.region[i].name == item.name) index = i;
}
//we only want to explode the selected region var explodeData:Array = [];
explodeData[index] = 0.15;
pcRegion.series[0].perWedgeExplodeRadius = explodeData; }
private function regionChange(item:Object):void {
selectedRegion = item;
dispatchEvent(new Event("regionChange")); }
private function dataGridCurrencyFormat(item:Object, column:Object):String {
return cf.format(item[column.dataField]); }
private function formatDataTip(hitData:HitData):String {
var name:String = hitData.item.name;
var revenue:Number = hitData.item.revenue;
return "<b>Region: "+name+"</b><br>Revenue: "+cf.format(revenue); }
]]>
</mx:Script>
<mx:CurrencyFormatter id="cf"/>
<mx:SeriesInterpolate id="interpolate" elementOffset="10"/> <mx:ViewStack id="vs" width="100%" height="100%">
<mx:VBox width="100%" height="100%" icon="@Embed('icon_chart.png')" toolTip="View in Chart"
hideEffect="Fade" showEffect="Fade">
<mx:PieChart id="pcRegion" dataProvider="{_month.region}" showDataTips="true" width="100%" height="100%" itemClick="regionChange(event.hitData.item)" dataTipFunction="formatDataTip">
<mx:series> <mx:Array>
<mx:PieSeries field="revenue" nameField="name" labelPosition="callout" labelFunction="getSliceLabel" showDataEffect="{interpolate}"> <mx:fills> <mx:Array> <mx:RadialGradient> <mx:entries> <mx:Array>
<mx:GradientEntry color="#EF7651" ratio="0"/> <mx:GradientEntry color="#994C34" ratio="1"/> </mx:Array> </mx:entries> </mx:RadialGradient> <mx:RadialGradient> <mx:entries> <mx:Array>
<mx:GradientEntry color="#E9C836" ratio="0"/> <mx:GradientEntry color="#AA9127" ratio="1"/> </mx:Array> </mx:entries> </mx:RadialGradient> <mx:RadialGradient> <mx:entries> <mx:Array>
<mx:GradientEntry color="#6FB35F" ratio="0"/> <mx:GradientEntry color="#497B54" ratio="1"/> </mx:Array> </mx:entries> </mx:RadialGradient> <mx:RadialGradient> <mx:entries> <mx:Array>
<mx:GradientEntry color="#A1AECF" ratio="0"/> <mx:GradientEntry color="#47447A" ratio="1"/> </mx:Array>
</mx:RadialGradient> <mx:RadialGradient> <mx:entries> <mx:Array>
<mx:GradientEntry color="#BA9886" ratio="0"/> <mx:GradientEntry color="#AE775B" ratio="1"/> </mx:Array> </mx:entries> </mx:RadialGradient> </mx:Array> </mx:fills> </mx:PieSeries> </mx:Array> </mx:series> </mx:PieChart> </mx:VBox>
<mx:VBox width="100%" height="100%" icon="@Embed('icon_grid.png')" toolTip="View in Grid"
hideEffect="Fade" showEffect="Fade">
<mx:DataGrid dataProvider="{_month.region}" width="100%" height="100%" change="regionChange(DataGrid(event.target).selectedItem)">
<mx:columns> <mx:Array>
<mx:DataGridColumn dataField="name" headerText="Region"/> <mx:DataGridColumn dataField="revenue" headerText="Revenue" labelFunction="dataGridCurrencyFormat" /> </mx:Array> </mx:columns> </mx:DataGrid> </mx:VBox> </mx:ViewStack> <mx:ControlBar> <mx:ToggleButtonBar dataProvider="{vs}"/> </mx:ControlBar> </mx:Panel>
Create the RegionDetail file
The RegionDetail.mxml displays the data returned from the result.xml file in a column chart control. The column chart control is defined by using a ColumnChart MXML tag. The data source is an array named revenueData that contains region data, as shown in the following
code snippet.
<mx:ColumnChart dataProvider="{revenueData}" width="100%" height="100%" showDataTips="true" dataTipFunction="formatDataTip">
The revenueData array created in the ActionScript section of RegionDetail.mxml file is
bindable array, as shown in the following code snippet. The data stored in revenueData is
displayed in the column chart control.
[Bindable]
public var revenueData:Array;
A RegionDetail object named regionDetail is defined in the dashboard.mxml file by using
an MXML tag, as shown by the following bolded line.
<mx:VDividedBox width="100%" height="100%">
<RegionBreakdown id="regionBreakdown" regionChange="regionChange()" width="100%" height="50%" />
<RegionDetail id="regionDetail" revenueData="{slicedRegionData.source}" width="100%" height="50%" />
</mx:VDividedBox>
Notice that revenueData is referenced in the RegionDetail tag. An ArrayCollection object
named slicedRegionData (declared in the dashboard.mxml file) populates the
revenueData array. The revenueData array is populated in the resultHandler method
defined in dashboard.mxml file. (The resultHandler method is invoked when data from the HTTPService object is returned).
The second placed where revenueData is populated is in the MessageHandler method
defined in the dashboard.mxml file. The MessageHandler method is invoked when the Consumer object detects a new message from LiveCycle Data Services.
The following code represents the entire RegionDetail.mxml file.
<?xml version="1.0" encoding="utf-8"?> <mx:Panel xmlns:mx="http://www.adobe.com/2006/mxml" xmlns="*" title="Region Details"> <mx:Script> <![CDATA[ import mx.charts.HitData; import mx.controls.Alert; import mx.charts.chartClasses.ChartBase; private var _region:String;
[Bindable]
[Bindable]
public var selectedMonth:Object;
protected function monthChange(month:Object):void {
selectedMonth = month;
dispatchEvent(new Event("monthChange")); }
protected function currencyFormat(value:Object, arg2:Object, arg3:Object):String
{
return cf.format(value); }
private function dataGridCurrencyFormat(item:Object, column:Object):String {
return cf.format(item[column.dataField]); }
private function sortByDates(obj1:Object, obj2:Object):Number {
var n:Number = SortUtils.sortByDates(obj1, obj2, "name"); return n;
}
public function set region(r:String):void {
_region = r;
this.title = "Region Details [" + r + "]"; }
private function formatDataTip(hitData:HitData):String {
var month:String = hitData.item.name; var revenue:Number = hitData.item.revenue; var average:Number = hitData.item.average;
return "<b>Month: " + month + "</b><br>" + _region + ": " + cf.format(revenue) + "<br>Average: " + cf.format(average); }
]]>
</mx:Script>
<mx:CurrencyFormatter id="cf"/>
<mx:ViewStack id="vs" width="100%" height="100%">
<mx:VBox id="chartVBox" width="100%" height="100%" icon="@Embed('icon_chart.png')" toolTip="Chart View"
paddingLeft="4" paddingTop="4" paddingBottom="4" paddingRight="4">
<mx:ColumnChart dataProvider="{revenueData}" width="100%" height="100%" showDataTips="true" dataTipFunction="formatDataTip">
<mx:horizontalAxis>
<mx:CategoryAxis dataProvider="{revenueData}" categoryField="name"/> </mx:horizontalAxis>
<mx:verticalAxis>
<mx:LinearAxis maximum="160000" labelFunction="currencyFormat"/> </mx:verticalAxis>
<mx:series> <mx:Array>
<mx:ColumnSeries yField="revenue" showDataEffect="{interpolate}"> <mx:fill>
<mx:LinearGradient> <mx:entries>
<mx:Array>
<mx:GradientEntry color="#C6D5DD" ratio="0" alpha="100"/> <mx:GradientEntry color="#336699" ratio="0.1" alpha="100"/> <mx:GradientEntry color="#24496D" ratio="0.9" alpha="100"/> <mx:GradientEntry color="#000000" ratio="1" alpha="100"/> </mx:Array>
</mx:entries>
</mx:LinearGradient> </mx:fill>
</mx:ColumnSeries>
<mx:LineSeries yField="average" form="curve" showDataEffect="{interpolate}"> <mx:stroke>
<mx:Stroke color="#708EA4" weight="1"/> </mx:stroke>
</mx:LineSeries> </mx:Array> </mx:series>
<mx:Array> <!-- SDK4 <mx:GridLines gridDirection="both"> --> <!-- SDK3 --> <mx:GridLines direction="both"> <mx:verticalStroke>
<mx:Stroke weight="1" color="#CCCCCC"/> </mx:verticalStroke> </mx:GridLines> </mx:Array> </mx:backgroundElements> </mx:ColumnChart> </mx:VBox>
<mx:VBox width="100%" height="100%" icon="@Embed('icon_grid.png')" toolTip="Grid View"
hideEffect="Fade" showEffect="Fade">
<mx:DataGrid dataProvider="{revenueData}" width="100%" height="100%"
change="monthChange(DataGrid(event.target).selectedItem)"> <mx:columns>
<mx:Array>
<mx:DataGridColumn dataField="name" headerText="Month" sortCompareFunction="sortByDates" />
<mx:DataGridColumn dataField="revenue" headerText="Total Revenue" labelFunction="dataGridCurrencyFormat" />
<mx:DataGridColumn dataField="average" headerText="Average Across Regions" labelFunction="dataGridCurrencyFormat" /> </mx:Array> </mx:columns> </mx:DataGrid> </mx:VBox> </mx:ViewStack> <mx:ControlBar> <mx:ToggleButtonBar dataProvider="{vs}"/> </mx:ControlBar> </mx:Panel>
Create the RevenueTimeline file
The RevenueTimeline.mxml represents a LineChart control that displays revenue data over
a time period. An MXML tag in RevenueTimeline.mxml file defines a LineChart object
<mx:LineChart id="lc" dataProvider="{revenueData}" showDataTips="true" width="100%" height="100%" dataTipFunction="formatDataTip"
itemClick="monthChange(event.hitData.item)">
The RevenueTimeline.mxml file contains a bindable array named revenueData. This object
binds to the LineChart object.
The RevenueTimeline object located in dashboard.mxml file is created by using an MXML
tag. The following code snippet shows the RevenueTimeline instance named timeline that
is defined in the dashboard.mxml file.
<mx:Panel id="timelinePanel" title="Revenue Timeline" width="100%" height="100%">
<RevenueTimeline id="timeline" revenueData="{slicedMonthData.source}" monthChange="monthChange()"/>
The revenueData array defined in the RevenueTimeline.mxml file is populated by using an ArrayCollection instance named slicedMonthData. This ArrayCollection instance is
populated in the resultHandler method defined in dashboard.mxml. The data stored in the slicedMonthData object is displayed in the RevenueTimeline instance when the dashboard
application is started.
The RevenueTimeline.mxml file defines an event named monthChange. Notice that the monthChange event is associated with the monthChange method. That is, when the month is
changed, the monthChange method in dashboard.mxml is invoked. The following code
snippet shows the body of the monthChange method. // Send messages when user's selection changes private function monthChange():void
{
var message:IMessage = new AsyncMessage(); message.body = {month: timeline.selectedMonth}; producer.send(message);
}
A new message is created and sent to LiveCycle Data Services by invoking the Producer object’s send method. The selectedMonth data member defined in the
RevenueTimeline.mxml file is used to create the message.
The following code represents the entire RevenueTimeline.mxml file.
<mx:ViewStack xmlns:mx="http://www.adobe.com/2006/mxml" xmlns="*" width="100%" height="100%"> <mx:Script> <![CDATA[ import mx.charts.HitData; [Bindable]
public var revenueData:Array;
[Bindable]
public var selectedMonth:Object;
private var colors:Array = [0xFF0000, 0x00FF00, 0x0000FF, 0xFFFF00, 0x00FFFF];
protected function monthChange(month:Object):void {
selectedMonth = month;
dispatchEvent(new Event("monthChange")); }
protected function currencyFormat(value:Object, arg2:Object, arg3:Object):String
{
return cf.format(value); }
private function dataGridCurrencyFormat(item:Object, column:Object):String {
return cf.format(item[column.dataField]); }
private function sortByDates(obj1:Object, obj2:Object):Number {
var n:Number = SortUtils.sortByDates(obj1, obj2, "name"); return n;
}
private function formatDataTip(hitData:HitData):String {
var name:String = hitData.item.name;
var revenue:Number = hitData.item.revenue;
} ]]> </mx:Script> <mx:Metadata> [Event("monthChange")] </mx:Metadata>
<mx:SeriesInterpolate id="interpolate" elementOffset="10"/> <mx:CurrencyFormatter id="cf"/>
<mx:VBox id="chartVBox" width="100%" height="100%" icon="@Embed('icon_chart.png')" toolTip="Chart View"
paddingLeft="4" paddingTop="4" paddingBottom="4" paddingRight="4">
<mx:LineChart id="lc" dataProvider="{revenueData}" showDataTips="true" width="100%" height="100%" dataTipFunction="formatDataTip"
itemClick="monthChange(event.hitData.item)">
<mx:horizontalAxis>
<mx:CategoryAxis dataProvider="{revenueData}" categoryField="name"/> </mx:horizontalAxis>
<mx:verticalAxis>
<mx:LinearAxis labelFunction="currencyFormat"/> </mx:verticalAxis>
<mx:series>
<mx:LineSeries yField="revenue" showDataEffect="{interpolate}"> <mx:lineStroke>
<mx:Stroke color="#708EA4" weight="1"/> </mx:lineStroke>
</mx:LineSeries>
<mx:LineSeries yField="license" showDataEffect="{interpolate}"> <mx:lineStroke> <mx:Stroke weight="1"/> </mx:lineStroke> </mx:LineSeries> </mx:series> <mx:backgroundElements> <mx:Array> <!-- SDK4 <mx:GridLines gridDirection="both"> --> <!-- SDK3 -->
<mx:GridLines direction="both"> <mx:verticalStroke>
<mx:Stroke weight="1" color="#CCCCCC"/> </mx:verticalStroke> </mx:GridLines> </mx:Array> </mx:backgroundElements> </mx:LineChart> </mx:VBox>
<mx:VBox width="100%" height="100%" icon="@Embed('icon_grid.png')" toolTip="Grid View">
<mx:DataGrid dataProvider="{revenueData}" width="100%" height="100%" change="monthChange(DataGrid(event.target).selectedItem)"> <mx:columns>
<mx:DataGridColumn dataField="name" headerText="Month" sortCompareFunction="sortByDates" />
<mx:DataGridColumn dataField="revenue" headerText="Total Revenue" labelFunction="dataGridCurrencyFormat" />
<mx:DataGridColumn dataField="average" headerText="Region Average" labelFunction="dataGridCurrencyFormat" />
</mx:columns> </mx:DataGrid> </mx:VBox> </mx:ViewStack>
Create the SortUtils file
The SortUtils.as file is a helper class that sorts data values by dates. This class uses a
mx.utils.ObjectUtil instance to compare two date values. The ObjectUtil instance’s dateCompare method returns a numeric value. The following code represents the entire
SortUtils.as file.
package {
import mx.utils.ObjectUtil; public class SortUtils {
//lookup the index based on month abbreviation static public var monthMap:Object = {
Jan: 0, Feb: 1, Mar: 2, Apr: 3, May: 4,
Jun: 5, Jul: 6, Aug: 7, Sep: 8, Oct: 9, Nov: 10, Dec: 11 };
public function SortUtils() {
super(); }
static public function sortByDates(obj1:Object, obj2:Object, prop:String):Number
{
var month:String = obj1[prop].substr(0,3); var month1:Number = monthMap[month];
var year1:String = "20" + obj1[prop].substr(4,2); month = obj2[prop].substr(0,3);
var month2:Number = monthMap[month];
var year2:String = "20" + obj2[prop].substr(4,2); var date1:Date = new Date(Number(year1), month1, 01); var date2:Date = new Date(Number(year2), month2, 01); return ObjectUtil.dateCompare(date1, date2);
} } }
Configure LiveCycle Data Services
When a client application sends a message to LiveCycle Data Services, the message is sent to a destination on the server. You configure a destination by modifying XML files. Because the dashboard application uses the Message service, you configure the
messaging-config.xml file. Assuming that the name of the web application is named lcds, this xml file is located in the following folder:
[LiveCycle Data Services Install path]\tomcat\webapps\lcds\WEB-INF\flex
The Producer and Consumer objects defined in the dashboard.mxml file both reference the dashboard destination. The dashboard destination is defined in the messaging-config.xml
file, as shown in the following example. The unique id element value is referenced by the client application. <destination id="dashboard"> <properties> <network> <session-timeout>0</session-timeout> </network> <server> <max-cache-size>1000</max-cache-size> <message-time-to-live>0</message-time-to-live> <durable>true</durable> </server> </properties> <channels> <channel ref="my-rtmp"/> </channels> </destination>
For information about the elements in the messaging-config.xml file, see the Using Adobe LiveCycle Data Service ES2 guide.
Notice that the defined channel is my-rtmp (RTPM stands for real time messaging protocol). The my-rtmp channel is defined in the services-config.xml file, as shown in the following example.
<channel-definition id="my-rtmp" class="mx.messaging.channels.RTMPChannel"> <endpoint url="rtmp://{server.name}:2037"
class="flex.messaging.endpoints.RTMPEndpoint"/> <properties>
<idle-timeout-minutes>20</idle-timeout-minutes>
<!-- for deployment on WebSphere, must be mapped to a WorkManager available in the web application's jndi context.
<websphere-workmanager-jndi-name>java:comp/env/wm/MessagingWorkManager</websphere-workmanager-jndi-name> -->
</properties>
</channel-definition>
Notice that the class for the channel is flex.messaging.endpoints.RTMPEndpoint. There is
Where to go from here
For more information about creating Data Management applications, see the Using Adobe LiveCycle Data Services ES2 Guide.