Young People Attracted to the
Same Sex or Both Sexes
Findings from the Youth’12 national
youth health and wellbeing survey
2014
Adolescent Health Research Group
Youth2000 Survey Series
The Health and Wellbeing of New Zealand
Secondary School Students in 2012
Title: Youth’12 The Health and Wellbeing of Secondary School Students in New Zealand: Results for Young People Attracted to the Same Sex or Both Sexes.
ISBN 978-0-473-30205-4 (paperback) ISBN 978-0-473-30206-1 (electronic) To be referenced as:
Lucassen, M.F.G., Clark, T. C., Moselen, E., Robinson, E.M., & The Adolescent Health Research Group. (2014).
Youth’12 The Health and Wellbeing of Secondary School Students in New Zealand: Results for Young People Attracted to the Same Sex or Both Sexes. Auckland: The University of Auckland.
The Adolescent Health Research Group* (AHRG) investigators on the Youth’12 project are: Terryann Clark (Principal Investigator), School of Nursing
Theresa (Terry) Fleming, Department of Paediatrics: Child and Youth Health & Department of Psychological Medicine Pat Bullen and Ben Dyson, Faculty of Education
Simon Denny, Department of Paediatrics: Child and Youth Health Sarah Fortune, Department of Psychological Medicine
Roshini Peiris-John and Jennifer Utter, Section of Epidemiology & Biostatistics, School of Population Health Elizabeth Robinson and Sue Crengle, Auckland UniServices Limited
Fiona Rossen, Social and Community Health
Janie Sheridan, Centre for Addiction Research, and School of Pharmacy Tasileta Teevale, Pacific Health, School of Population Health
*The AHRG membership has changed over the three surveys. The AHRG investigators are all based at The University of Auckland in New Zealand.
Data analysis provided by Mathijs Lucassen and Elizabeth Robinson.
Data checking provided by Mathijs Lucassen, Elizabeth Robinson and Emma Moselen. Proofreading provided by Beccy Jones.
Oversight provided by Terryann Clark and the AHRG.
This report is based on the Youth’07 report “The Health and Wellbeing of Secondary School Students in New Zealand: Results for Young People Attracted to the Same Sex or Both Sexes”, which was prepared by co-authors led by Simon Denny.
Acknowledgements A big thank you to:
The students and staff who participated in the survey. Without their help the Youth’12 survey would not have been possible.
The Youth’12 project manager, Sarah Masson and administrator, Toni Jardine.
The research team members who implemented the survey in participating schools. Their names are listed under ‘Our Team’ at www.youthresearch.auckland.ac.nz
The Youth’07 team, led by Simon Denny, and the Youth2000 team, led by Peter Watson. RainbowYOUTH staff and volunteers who formed the advisory group for this report.
All the photographs in this report are used with the permission of the young people involved.
The Youth’12 project was funded by the Ministries of Youth Development, Social Development, Health, Education and Justice, the Department of Labour, the Families Commission and the Health Promotion Agency (formerly ALAC). We would also like to acknowledge the support of Toshiba (Australia) Pty. Limited.
This report was contracted by the Ministry of Youth Development and the Ministry of Education. Contact details:
Dr Terryann Clark (Youth’12 Principal Investigator) Adolescent Health Research Group
School of Nursing
The University of Auckland
Private Bag 92019, Victoria Street West, Auckland, 1142 Email: t.clark@auckland.ac.nz
Foreword
Kia ora,RainbowYOUTH is a peer-led charitable organisation that aims to support Queer and Trans* young people in New Zealand. Key to our vision - “The acceptance of diversity of sexuality and gender in Aotearoa” - is the education work that we, and other organisations, do in our nation’s high schools.
Education allows a young person to accept their own sexual attractions, or beliefs about their gender, as valid and not as something to be changed or ‘fixed’. Education of everyone is important, as the health and wellbeing of those who are same/both-sex attracted is influenced by the people around them. With the use of phrases such as “gay”, “lesbian” and “that’s so gay” still used commonly as insults in our schools, the impact of others is often negative in relation to the young people we work with.
While our own personal experiences reinforce the need for education, the Youth’01, Youth‘07 and now Youth‘12 reports have also provided nationally representative data to support the need for this education. With New Zealand having the highest youth suicide rate in the OECD (Organisation for Economic Co-operation and Development), and statistics from Youth’12 highlighting same/both-sex attracted youth are approximately five times more likely to have made a suicide attempt in the last 12 months, work to address this is urgently needed.
This Youth‘12 report is the third in a series, and it is interesting to be able to compare trends in the health and wellbeing of same/both-sex attracted youth with their opposite-sex attracted peers. For instance, whilst there has been some significant improvements in the health and wellbeing of opposite-sex attracted and same/both-sex attracted students, such as a decrease in weekly cigarette smoking between 2001 and 2012, same/both-same/both-sex attracted youth are often left behind. In particular same/both-sex attracted young people have remained over represented in negative health statistics, with the disparities between opposite-sex and same/both-sex attracted youth remaining across the three survey waves.
There are many awesome organisations committed to making life better for same/both-sex attracted youth. However it is clear that more needs to be done on a national level, especially in our schools.
To end on a more positive note, I always notice and value the ‘good news stories’ which come from these reports. One such statistic being that same/both-sex attracted youth are more likely to do volunteer work than their opposite-sex attracted peers, highlighting the resilience and sense of community I know our young people have.
Duncan Matthews
Contents
Executive Summary ... 5
Introduction ... 7
Do environments place same/ both-sex attracted youth ‘at risk’? ...7
Sexuality and terminology ...7
Sex, gender identity and terminology ...8
Coming out ...8
Adolescence ...9
The Adolescent Health Research Group (AHRG) ... 9
Youth2000 Survey Series ...9
How we did the 2012 survey ...10
Ethical issues ...10
Survey delivery and content ...10
NZ Deprivation Index ...11
Funding ...11
How to use the information in this report .... 11
How reliable are these findings? ...11
Interpreting the results ...11
Comparisons between 2001, 2007, and 2012 ...13
Using the data as an advocacy tool ...13
The Results ... 14
The participants ... 14
Sexual attraction by sex and age ...15
Sexual attraction by ethnicity ...15
Sexual attraction by neighbourhood characteristics and birthplace ...16
Coming out ...17
Family relationships ... 19
Comparisons 2001, 2007, and 2012 ...20
Health and wellbeing ... 20
General health and wellbeing ...20
Accessing healthcare ...21
Emotional wellbeing ... 22
Depression and self-harm ...22
Comparisons 2001, 2007, and 2012 ...22
Suicidality ...22
Comparisons 2001, 2007, and 2012 ...23
Substance use ... 24
Alcohol, cigarette, marijuana and other drug use ...24
Comparisons 2001, 2007, and 2012 ...24
Sexual health ... 25
Sexually active students ...25
Sexual health of sexually active male and female students ...25
Comparisons 2001, 2007, and 2012 ...26
School ... 27
Comparisons 2001, 2007, and 2012 ...27
Safety, bullying and discrimination ... 28
Comparisons 2001, 2007, and 2012 ...29 Community ... 30 Comparisons 2001, 2007, and 2012 ...30 Useful Links ... 32 Appendices ... 33 References ... 42
Executive Summary
Almost four percent (3.8%) of young people reported being attracted to others of the same sex or both sexes in Youth’12. This proportion is comparable to that found in the previous surveys conducted in 2001 and 2007, suggesting that over the past 11 years there has been no change in relation to the number of New Zealand secondary school students who are same/both-sex attracted. Furthermore these young people are ethnically, geographically, and socially diverse, and attend schools from around the country.
In 2012, the majority (53.1%) of same/both-sex attracted young people had ‘come out’ (i.e. told people close to them about their sexuality) whilst 31.3% of same/both-sex attracted students had come out in 2001. However, in Youth’12 only 14.4% of these young people said that they could easily talk to their family about their sexuality. Most same/both-sex attracted students reported feeling positive towards school and described caring relationships with their parents and friends. Same/both-sex attracted students were also generous with their time in that they were more likely (than their opposite-sex attracted counterparts) to work as volunteers in their communities.
Although most same/both-sex attracted students are doing well, there are significant and harmful disparities when these students are compared to their opposite-sex attracted peers. Same/both-sex attracted young people are often exposed to environments that are challenging and discriminatory, and this in turn affects their wellbeing. For example, same/both-sex attracted youth are more likely to be bullied, be physically harmed, and to be afraid that someone would hurt or bother them at school. Furthermore, 59.4% of same/both-sex attracted students had deliberately self-harmed, 41.3% had significant depressive symptoms, 18.3% had attempted suicide in the last 12 months, and 35.7% had difficulty getting help for their emotional concerns. These mental health issues have not improved since 2001, and worryingly the proportion of same/both-sex attracted students experiencing significant depressive symptoms has increased from 27.0% in 2001 to 41.3% in 2012, while the proportion of opposite-sex attracted students with these symptoms has remained fairly constant (9.5% in 2007 and 11.4% in 2001 and 2012). This suggests that poor progress is being made in terms of addressing mental health concerns. Overall this report highlights that while many same/both-sex attracted students are doing well, in comparison to opposite-sex attracted students, same/both-sex attracted young people continue to experience compromised health and wellbeing. Evidence from international studies suggest that reducing these disparities must focus on creating safe and nurturing environments which build upon the young person’s strengths and assets, and refrains from problematising (or pathologising) same/both-sex attracted young people.
Introduction
This report is the third report focused on sexual attraction from the Youth2000 survey series. The Youth2000 survey series has been conducted by the Adolescent Health Research Group (AHRG) at the University of Auckland. This group has carried out nationally representative surveys of New Zealand secondary school students in 2001, 2007, and 2012. The current document follows on from the previous reports published in 2005 (Le Brun, Robinson, Warren, & Watson, 2004) and 2009 (Rossen, Lucassen, Denny, & Robinson, 2009) which specifically focused on non-heterosexual or same/both-sex attracted students. This report presents findings on the students in Youth’12 (i.e. the Youth2000 survey conducted in 2012) who reported that they were sexually attracted to others of the same sex or to both sexes. Approximately 4% of secondary school students in New Zealand were same/both-sex attracted in 2001, 2007 and 2012. As such, these young people form a sizeable group, similar in proportion to other minority populations (e.g. minority ethnic groups). Internationally it has been estimated from population based samples that between 2.3% and 15.5% of adolescents report being same/both-sex attracted (Denny et al., in press). Recent meta-analyses have demonstrated that same/both-sex attracted young people are more likely to attempt suicide, experience depressive symptoms (Marshal et al., 2011) and to report higher rates of substance use (Marshal et al., 2008) than opposite-sex attracted young people. Furthermore, same/both-sex attracted young people are more likely to be sexually active at an earlier age (Hillier et al., 2010). They are also at an elevated risk of bullying at school (Birkett, Espelage, & Koenig, 2009; Hong & Garbarino, 2012) with the impacts of this bullying remaining with the students long after they leave high school (Henrickson, 2008; Rivers, 2004). Bullying on the basis of being sexuality and/or gender diverse is an especially salient issue in New Zealand with this being highlighted as a particular problem in secondary schools over recent years (Burford, Lucassen, Penniket, & Hamilton, 2013; Painter, 2009; Riches, 2014).
Do environments place same/both-sex
attracted youth ‘at risk’?
The elevated rates of ill-health and other disparities for same/both-sex attracted youth are not to do with their sexual orientation, but are to do with minority stress (Meyer, 2003). In particular, it is hostile and stressful surroundings that lead to the problems experienced by many same/both-sex attracted individuals (Adams, Dickinson, & Asiasiga, 2013; Stevens, 2013). This relationship has been demonstrated in recent studies where abuse on the basis of sexuality (and/or gender identity) has been directly linked to suicidality and depression for same/both-sex attracted adolescents (Adams et al., 2013; Burton, Marshal, Chisolm, Sucato, & Friedman, 2013; Denny et al., in press; Duncan & Hatzenbuehler, 2014). Fortunately, the issues faced by same/both-sex attracted young people can be addressed by improving social environments. However, these environmental changes must focus on addressing heteronormative culture (i.e. where anything other than being exclusively opposite-sex attracted is viewed as ‘wrong’ or ‘abnormal’) and should refrain from ‘problematising’ (or pathologising) same/both-sex attracted young people (Quinlivan, 2002).
Sexuality and terminology
In the report based on the 2001 survey (Le Brun et al., 2004) participants were categorised as either ‘heterosexual’ (i.e. students who reported being attracted to the opposite sex) or ‘non-heterosexual’ (i.e. students who reported being attracted to the same sex, both sexes, neither sex, or not sure). However, combining all the latter participants into a single ‘non-heterosexual’ group limited the usefulness of comparisons. For the current report based on the 2012 survey and the one based on the 2007 survey (Rossen et al., 2009), participants were divided into three groups: opposite-sex attracted; same/both-sex attracted; and not sure/neither sex attracted. Grouping students in this way allows for consistency between the two most recent Youth2000 reports. Furthermore, the term ‘non-heterosexual’ has the potential to perpetuate heteronormativity, by placing same/both-sex attracted young people in a ‘non’ or ‘other’ category. Therefore we have adopted a technically accurate (based on the survey item used) and more normalising approach by using neutral terms, such as same/both-sex attracted and opposite-sex attracted.
In all three of the Youth2000 surveys students were asked about their sexual attractions. Focusing on sexual attractions is both useful and developmentally appropriate when one considers the limitations of the other key dimensions of sexual orientation. For example, secondary school students in Western countries like New Zealand mostly report not having had sex (Clark, Fleming, Bullen, Crengle, et al., 2013), therefore using sexual behaviour as the primary means of determining adolescent sexuality is limited. Sexual identity labels, such as lesbian, gay, bisexual (LGB) and straight/heterosexual, are commonly used by young people (Russell, Clarke, & Clary, 2009), yet many adolescents who are sexually attracted to people of the same sex or both sexes do not necessarily identify themselves as LGB (Russell et al., 2009). Various reasons could account for this. For instance, many of those who will eventually identify as LGB may not have come out (i.e. disclosed their sexuality) to themselves or others (Savin-Williams, 2001), with some young people preferring other terms like ‘queer’ or ‘questioning’ (Russell et al., 2009). Moreover, after a systematic review of school-based health surveys Saewyc and colleagues (Saewyc et al., 2004) suggested that if only one sexuality item was permitted on a health survey it should be a sexual attraction question.
Sex, gender identity and terminology
In Youth’01, Youth’07, and Youth’12, students were asked “What sex are you?” with the response options “male” and “female” - no further sex response options were available to students. A specific question on sex or gender identity with multiple response options was not asked of students in the Youth2000 survey series, hence students could not indicate if they were intersex (i.e. a person whose body when born does not fit into the categories of male or female due to genital, chromosomal or hormonal variations). In Youth’12, students were asked if they were transgender. In particular all students were asked if they were “a girl who feels like she should have been a boy, or a boy who feels like he should have been a girl (e.g., Trans, Queen, Fa’afafine, Whakawahine, Tangata ira Tane, Genderqueer)?” Information regarding transgender youth is not included in this report, however a peer-reviewed open access academic paper (Clark et al., 2014) http://www.sciencedirect.com/science/article/ pii/S1054139X13007532 and fact sheet, which focus
specifically on transgender young people, are now freely available https://cdn.auckland.ac.nz/assets/ fmhs/faculty/ahrg/docs/Youth12-transgender-young-people-fact-sheet.pdf
Coming out
For many adolescents, understanding and making sense of their sexuality is a challenging learning process. For about 90% of young people the outcome of their experiences is an exclusive interest in the opposite sex and the acceptance of a heterosexual orientation is taken for granted (Udry & Chantala, 2005). For same/both-sex attracted young people the process of coming to understand their sexuality is often more complex and may involve many challenges. One particular challenge arises over the disclosure of one’s sexuality or ‘coming out’, which is an important part of sexual identity formation (Hegna & Wichstrom, 2007). Individuals may decide to not disclose that they are same/both-sex attracted in order to protect themselves and avoid negative reactions and stigma (D’Augelli & Patterson, 2001; Hegna & Wichstrom, 2007). Under these circumstances, relationships with friends and family may be based in part on fabrications and the creation of a ‘false self’ (D’Augelli & Patterson, 2001). The creation of a ‘false self’ can result in withdrawal, feelings of isolation, and mental health problems (Maguen, Floyd, Bakeman, & Armistead, 2002). Others may try to deny, alter or hide their same/both-sex attractions, feelings, or behaviour (Garofalo & Katz, 2001; Lewis, Derlega, Berndt, Morris, & Rose, 2001). While some adolescents can be ‘not sure’ or ambivalent with regard to their sexual orientation others may never have felt attractions to the opposite sex, to the same sex, or to either (Udry & Chantala, 2005). Whether they have experienced this ambivalence or not, given their developmental stage, issues surrounding disclosure to others for same/ both-sex attracted youth and the process of coming out are likely to be particularly relevant. Moreover, the challenges around this are compounded by the fact that adolescents are very concerned about peer group conformity and acceptance throughout this developmental stage (Sigelman & Rider, 2006). Differences that may be celebrated later in life are therefore especially difficult for young people to deal with because of their age. Despite these challenges, most same/both-sex attracted youth develop into healthy individuals (Garofalo & Katz, 2001; Lucassen
et al., in press) and fortunately there are known strategies that support this. For instance, promoting peaceful and accepting environments, as well as appreciating the importance of adolescent friendships and family relationships, assists in supporting same/ both-sex attracted young people to develop as healthy individuals (Williams, Connolly, Pepler, & Craig, 2005).
Adolescence
Adolescence is an important stage in life that presents unique opportunities and challenges. Adolescent wellbeing is of critical importance both for navigating the challenges of the teenage years and for establishing healthy patterns for adult life. Young people, families, schools, communities and governments have made considerable efforts to improve adolescent health and wellbeing more generally. This report provides an overview of how well same/both-sex attracted teenagers are doing in 2012 and how key health issues have changed over the past 11 years for these young people.
This report has been produced by the Adolescent Health Research Group (AHRG), which carries out the Youth2000 Survey Series. It provides a summary or snapshot of important health and wellbeing issues for same/both-sex attracted young people from Youth’12: The National Health and Wellbeing Survey of New Zealand Secondary School Students (Youth’12 Survey). This report is complemented by three Youth2000 peer-reviewed journal articles which detail the health and wellbeing of same/both-sex attracted students (Lucassen et al., in press; Lucassen et al., 2011), as well as students overall (Clark, Fleming, Bullen, Crengle, et al., 2013), and changes in adolescent health and wellbeing over time (Clark, Fleming, Bullen, Crengle, et al., 2013; Lucassen et al., in press). We cite these studies where appropriate in this report.
The Adolescent Health
Research Group (AHRG)
The Adolescent Health Research Group (AHRG) is a multidisciplinary team of researchers that is supported by youth, cultural, and stakeholder advisors. The purpose of the AHRG is to promote the healthy development and wellbeing of all New Zealand youth through scientific research that delivers high quality useable data to stakeholders. The group was first established in 1997. Over the years the membership of the AHRG has changed, but the vision and commitment remains. The AHRG works closely with many other researchers and groups. We welcome applications from other researchers and groups to use the Youth2000 Survey Series data. A protocol for potential collaborations can be found on our website.
Youth2000 Survey Series
The AHRG has carried out comprehensive national surveys of secondary school students in 2001 (Adolescent Health Research Group, 2003), 2007 (Adolescent Health Research Group, 2008) and now in 2012 (Clark, Fleming, Bullen, Denny, et al., 2013). The 2001 (Youth’01) and 2007 (Youth’07) surveys are similar to the 2012 (Youth’12) survey and selected comparisons of findings from these surveys are made in this report.
The group has also surveyed students in Alternative Education in 2000 (Adolescent Health Research Group, 2002; Denny, Clark & Watson, 2004) and 2009 (Clark et al., 2010), and in 2007 the AHRG also surveyed students in Teen Parent Units (Johnson & Denny, 2007). The Youth’07 and Youth’12 surveys of secondary school students were supplemented by surveys with school staff members about school characteristics. All of these surveys together make up the Youth2000 Survey Series.
The results of the Youth2000 Survey Series have been presented internationally and are listed on our website: www.youthresearch.auckland.ac.nz
How we did the 2012 survey
The Youth2000 Survey Series is designed to provide information about the health and wellbeing of New Zealand secondary school students. In 2012 we randomly selected 125 composite and secondary schools in New Zealand which met the inclusion criteria1 and invited them to participate in the survey.
For schools which had a roll of more than 150 Year 9-13 students, we randomly selected 20% of this roll and invited these students to take part in the survey. For participating schools with less than 150 Year 9 or higher students, 30 students were randomly selected and invited to take part. For more detailed information on the school selection process, please refer to the Youth’12 Prevalence Tables report which can be found on our website: www.youthresearch.auckland.ac.nz. Of the 125 schools invited, 91 took part in the survey (73%). The majority of participating schools were state funded, co-educational and large schools (at least 350 Year 9 or higher students). Of the 34 invited schools that did not participate, 26 schools declined, a further two schools initially agreed to participate but withdrew during 2012, and six did not respond to the invitation to participate. School participation was lowest for state-integrated schools (59%), boys’ schools (40%), Decile 6 (50%) and Decile 7 (64%) schools, rural schools (60%), and schools in the following regions: Wellington (50%), Nelson Marlborough, Tasman and West Coast (60%) and Otago or Southland (54%). Within the 125 participating schools, 12,503 students were invited to take part in the survey and 8,500 participated (68%). This represents 3% of the 2012 New Zealand secondary school roll. The most common reasons why students did not participate were not being at school on the day of the survey, not wanting to take part, and being unavailable during the time the survey was conducted.
Ethical issues
The Youth’12 survey built on the procedures used in the previous Youth2000 Survey Series. Like the previous surveys, Youth’12 was completely voluntary (students did not have to participate and could choose to not answer questions or to leave at any time) and anonymous (no personal identification details were collected). The survey had a ‘branching’ design, so that students were not asked detailed questions about things that did not apply to them.
1 New Zealand registered composite and secondary schools
The AHRG and a wide range of advisors reviewed the survey content and methods. Ethical approval was obtained from The University of Auckland Human Participants Ethics Committee (ref 2011/206).
School principals gave consent for their own school to take part. A few weeks before the survey, information was given to each school for distribution to parents and students. Parents were able to have their child excluded from the survey. On the day of the survey, an explanation was given to selected students and each student personally consented to participate. The survey was available in English and Te Reo Māori.
Survey delivery and content
The survey was delivered using handheld digital tablets. The survey questions were displayed on the tablet and were also available by voiceover via headphones. Students answered the questions by touching the appropriate checkbox on the tablet screen.
The Youth’12 survey covered important areas of health and wellbeing for young people in New Zealand, as well as risk and protective factors. The questionnaire contained a total of 608 questions, but students answered fewer than this number of questions due to the branching design of the survey. The complete list of survey questions and full wording for each question is available on our website: www. youthresearch.auckland.ac.nz. Most of the questions and measurements were the same as those used in previous Youth 2000 surveys.
Students were also asked to provide their usual home address. We used this to ascertain their census meshblock (grouping of approximately 100 households) so that neighbourhood characteristics such as deprivation levels and urban or rural setting could be ascertained. After the meshblock was identified the student’s address was deleted.
NZ Deprivation Index
In this report, students are grouped into high, medium, or low deprivation neighbourhoods, based on the New Zealand Deprivation Index (NZDI) for their geographical area or neighbourhood (meshblock). In 2006, the NZDI used eight dimensions of deprivation (including household income, employment, access to a telephone, access to a car, single parent families, qualifications, overcrowding, and home ownership) to calculate a deprivation score for each meshblock in New Zealand. It is important to remember that this score is an indicator of neighbourhood (rather than personal or family) deprivation, and some households might contend with quite different levels of hardship than is suggested by their meshblock.
Funding
The Youth2000 Survey Series has had a different set of funding bodies in 2001, 2007, and 2012. Without the support of these organisations it would not be possible to undertake the youth health and wellbeing surveys nationally or to analyse and publish the results. Without this research, organisations that are responsible for New Zealand youth would not be able to advocate for appropriate and accessible services, programmes and policy on behalf of young people. In 2012, the survey was funded by the Ministries of Youth Development, Social Development, Health, Education and Justice, the Department of Labour, the Families Commission, and the Health Promotion Agency (formerly ALAC). The AHRG thanks these organisations for their support to improve the health and wellbeing of New Zealand youth. This report was contracted by the Ministry of Youth Development and the Ministry of Education.
How to use the information
in this report
The Youth2000 Survey Series is the largest dataset on the health and wellbeing of young people in New Zealand and is of considerable importance for the purposes of planning and programme development for communities, schools and policy makers. However, caution needs to be taken when interpreting the results, especially in relation to whether the findings reflect the wider youth population, and in interpreting differences between groups of students. The sample of students surveyed does not include young people who were absent from school on the day of the survey, those who have left school, or those in Alternative Education settings; hence findings are likely to represent a slightly positive view of the health of students in schools.
How reliable are these findings?
We have taken steps to ensure that we can be confident the information is correct. Our large sample size, and rigorous methods for randomly selecting schools and students, ensure that these findings represent secondary schools and their students throughout New Zealand. The Adolescent Health Research Group has undertaken extensive quality checks to ensure data coding and analyses are correct.
Interpreting the results
This report presents findings about opposite-sex attracted, same/both-sex attracted, and not sure/ neither students from the Youth’12 Survey carried out in 2012. When we report statistics in this document a number of parameters are provided.
In the tables, for each question/item from the survey, we report ‘N’ which refers to the number of students who answered that particular question/item. The ‘N’ will vary by question as students could choose not to answer questions, and students were not asked detailed questions which did not apply to them. For example, only students who identified as being same/ both-sex attracted were asked whether they had ‘come out’ (told people close to them of their sexuality). The ‘n’ refers to the number of students who chose the particular response of interest for a question/item. For example, in the question regarding whether a student felt as though their parents (or someone who acts like a parent) care about them, the number of students
who answered this question was 7895 (N), and 260 (n) same/both-sex attracted students responded that they thought their parents cared about them a lot.
Opposite Sex Same/Both sexes n (95% CI)% n (95% CI)% Parents (or someone who acts like a parent) care about me a lot (N=7895) 6806 93.8 (93.1-94.6) 260 86.7 (83.3-90.0)
The percentage (%) refers to the proportion of the students who reported that particular response or behaviour for a question/item. This can be regarded as an estimate of the true proportion of the population. For example, 34.2% of same/both-sex attracted students reported having volunteered by giving time to help others in the community in the last 12 months.
Opposite Sex Same/Both sexes n (95% CI)% n (95% CI)% Volunteered by giving time to help others in the community in the last 12 months (N=6484) 1633 27.1 (25.4-28.8) 90 34.2 (28.7-39.8)
The confidence intervals (95% CI) indicate the precision of the percentage estimate by providing an interval within which we are relatively sure the true value lies (i.e. we are 95% confident that the actual prevalence of that particular behaviour or response lies between the two bounds given). For example, statistically speaking we are ‘95% certain’ that between 35.4% and 47.1% of same/both-sex attracted students have significant depressive symptoms (based on the RADS-short version).
Opposite Sex Same/Both sexes
n % (95% CI) n % (95% CI) Significant depressive symptoms (RADS-short version) (N=7817) 824 11.4 (10.3-12.5) 120 41.3 (35.4-47.1)
Wide confidence intervals indicate more uncertainty in the associated percentage estimate. The 95% CI are provided in the relevant tables and they have been included in the bar graphs (visually displayed as a black line towards the top of each bar). The percentages and 95% confidence intervals are adjusted for weighting and clustering, because the Youth2000 Survey Series utilise a complex sampling design. The percentages and 95% confidence intervals were used to compare responses between opposite-sex attracted, same/both-sex attracted and not sure or neither students.
As a ‘rule of thumb’, if the 95% confidence intervals around two percentage estimates do not overlap then the differences are more likely to be real or statistically significant. For example, with regards to having significant depressive symptoms the 95% confidence intervals associated with the opposite-sex attracted students (95% CI, 10.3%-12.5%) and same/ both-sex attracted students (95% CI, 35.4%-47.1%) do not overlap (i.e. 12.5% is considerably lower than 35.4%, indicating that same/both-sex attracted students are more likely to have depressive symptoms than opposite-sex attracted students), however, it is important not to place too much emphasis on apparent differences when the numbers of students reporting on a specific issue is small (i.e. ≤30). For the changes over time we refer to the relevant Youth2000 peer-reviewed papers and other selected comparisons between 2001, 2007, and 2012. Where these analyses were done we have noted whether there were any statistical differences or not. When we have conducted tests of statistical significance we have used a conservative cut-off of p ≤0.01 in this report (i.e. there is less than a 1% chance that there is a random difference; therefore, we can be very confident that the difference observed is real). For example, there have been no significant changes over time with regards to students reporting that they get to spend enough time with their parents when opposite-sex attracted students were compared to same/both-sex attracted students (p=0.41). However, there was a significant difference over time when same/both-sex attracted students were compared to opposite-sex attracted students in relation to whether they had significant depressive symptoms based on the RADS-short version (p=0.008).
Comparisons between 2001, 2007, and
2012
Key comparisons for same/both-sex attracted youth between the 2001, 2007, and 2012 survey findings are presented in this report, where items are directly comparable. As the purpose of this report is to provide a concise overview of ‘major indicators’ only a small number of important areas are compared here. For further information about changes over time refer to the peer-reviewed academic paper (Lucassen et al., in press) specifically focused on this topic.
It is possible to compare findings across the surveys as similar methods were utilised in all three surveys. For example, the procedures for sampling schools and students were very similar, as were the survey technology and the questions asked. However, it is important to realise there are some differences between the surveys.
The overall target sample size in 2001, 2007 and 2012 was 10,000 students. The response rates among schools and students have changed somewhat between the three surveys. In 2012, 73% of invited schools took part, compared to 84% in 2007, and 86% in 2001. In 2012, 68% of invited students took part, compared to 74% in 2007, and 75% in 2001.
The 2001, 2007, and 2012 surveys included similar proportions of students of each age and year of schooling, but there were differences in the numbers of participating single sex schools. As a result, the ratio of male and female participants differs between the surveys. In 2012, 54% of the sample was female and 46% was male, while in 2007 the sample was 46% female and 54% male. In 2001 it was 54% female and 46% male.
Some questions were not included in the 2001 survey or were changed slightly between the three surveys. This was done in order to gain new or clearer information.
Using the data as an advocacy tool
We encourage people to use the information in this report to advocate for the health and wellbeing of same/both-sex attracted young people. However, there is a tricky balance between advocacy and contributing toward the stigma associated with health disparities between same/both-sex attracted and opposite-sex attracted young people. We urge all those who utilise this data to be mindful of not stigmatising same/ both-sex attracted youth, as these young people are an important and vibrant sub-population. They are also diverse in terms of their experiences and most same/ both-sex attracted young people are healthy and well.
The Results
The participants
In the Youth’12 questionnaire, all students were asked the question “Which are you sexually attracted to...?” and they could choose from the response options: ‘the opposite sex’, ‘the same sex’, ‘both sexes’, ‘not sure’, ‘neither’ or ‘I don’t understand this question’. Of the 8,500 students who agreed to take part in the Youth’12 survey, 8,166 responded to this question, it is those 8,166 students who responded that constitute the sample analysed in this report. Of the responding students 178 students reported that they did not understand the Youth’12 sexual attraction question. The majority (77.1%) of these students were younger, in that they were 15 years old or less. Of note, this response option was not available in Youth’07 or Youth’01.
The pattern of responses is very similar to that in the 2001 and 2007 surveys. In all three surveys the great majority of students (about 92%) responded that they were sexually attracted to the opposite sex. A very small proportion responded that they were sexually attracted to the same sex (0.9% in 2007 and 0.7% in 2012 and 2001), with approximately four times that many reporting that they were sexually attracted to both sexes (approximately 3% in all three surveys). The combined ‘same/both-sex attracted’ group thus represents 3.8% of students in Youth’12. A further 2.3% (compared to 1.8% in 2007 and 2.3% in 2001) were not sure who they were sexually attracted to, and a similar proportion 2.1% in 2012 (compared to 1.8% in 2007 and 1.7% in 2001) were not attracted to either sex. The combined ‘not sure/neither’ group thus represents 4.3% of students (see Table 1 for details).
Table 1. Reported sexual attractions of students in 2012
Opposite Sex Same Sex Both Sexes Not Sure Neither
n 7335 60 243 182 168 % (95% CI) 91.9 (90.9-92.9) 0.7 (0.5-0.9) 3.0 (2.6-3.5) 2.3 (1.8-2.7) 2.1 (1.6-2.6)
Same/Both Sexes Not Sure/Neither
n 302 350 % (95% CI) 3.8 (3.3-4.2) 4.3 (3.6-5.1)
Sexual attraction by sex and age
In 2012 there was little difference in the prevalence of opposite-sex attractions between male (93.2%) and female (90.8%) students. There was also little difference in the prevalence of not sure/neither sex attraction according to sex, however a higher proportion of females than males reported same/both-sex attraction in Youth’12. The proportion of students reporting same/both-sex attractions increased with age, from 2.0% of students aged 13 or less to 5.2% of those aged 17 or older. There was a corresponding decrease in the proportions of students who reported being not sure/neither in these age brackets, while the proportion reporting opposite-sex attraction remained fairly constant from 13 and under to 17 and older. Taken together this pattern suggests that many students move progressively (with increasing age) from the not sure/neither group to the same/both-sex attracted group. Given that the Youth’12 survey results represent what students were prepared to disclose in a private and anonymous survey, these results apparently reflect a process of gradual awareness of same/both-sex attraction during the adolescent years. Some same/both-sex attracted youth reach this milestone by age 13, but more come to this later.
Table 2. Prevalence of different sexual attractions by age and sex in 2012 Opposite Sex Same/Both Sexes Not Sure/Neither
n % (95% CI) n % (95% CI) n (95% CI)% Total 7335 91.9 (90.9-92.9) 302 3.8 (3.3-4.2) 350 4.3 (3.6-5.1) Sex Female 3978 90.8 (89.7-92.0) 196 4.5 (3.8-5.1) 210 4.7 (3.9-5.6) Male 3357 93.2 (92.0-94.5) 106 2.9 (2.3-3.5) 140 3.9 (2.9-4.8) Age 13 or less 1526 90.5 (88.5-92.5) 34 2.0 (1.2-2.8) 130 7.5 (5.9-9.1) 14 1663 93.1 (91.9-94.3) 47 2.6 (1.9-3.3) 77 4.3 (3.2-5.5) 15 1528 92.4 (90.7-94.1) 61 3.7 (2.6-4.8) 65 3.9 (2.8-5.0) 16 1376 91.5 (89.9-93.1) 90 6.0 (4.7-7.3) 38 2.5 (21.6-3.5) 17 or older 1235 91.9 (90.5-93.3) 70 5.2 (4.2-6.2) 40 2.9 (1.9-4.0)
Sexual attraction by ethnicity
In general, the results confirm that same/both-sex attracted students come from a range of ethnic backgrounds with about 4% of students reporting being same/both-sex attracted in all the main ethnic groups in New Zealand. Where the proportion of students who were opposite-sex attracted was higher (e.g. for European and Māori students this was approximately 93%), the corresponding proportion of students who were not sure/neither was lower (e.g. about 3% for European and Māori students) relative to other ethnic groups. Conversely, where the proportion of not sure/ neither students was greater (i.e. for Pacific and Asian students, where this was approximately 8%), the proportion of students who reported being opposite-sex attracted was lower relative to European and Māori students.
Table 3. Prevalence of different sexual attractions by ethnicity in 2012
Opposite Sex Same / Both Sexes Not Sure / Neither
n % (95% CI) n % (95% CI) n % (95% CI) Ethnicity European 3660 93.6 (92.8-94.3) 147 3.8 (3.2-4.3) 106 2.7 (2.2-3.2) Māori 1469 92.7 (91.2-94.2) 61 3.8 (2.8-4.8) 58 3.5 (2.5-4.6) Pacific 912 87.7 (85.0-90.5) 41 3.9 (2.7-5.2) 87 8.3 (6.1-10.6) Asian 849 89.0 (86.9-91.2) 32 3.4 (2.4-4.4) 73 7.6 (5.7-9.5) Other 438 90.8 (87.4-94.2) 20 4.0 (2.3-5.7) 26 5.2 (2.7-7.7)
Sexual attraction by neighbourhood characteristics and birthplace
No major differences were observed in the prevalence of same/both-sex attracted students between neighbourhoods of differing levels of deprivation; urban or rural areas; or, students born in New Zealand or born overseas. There were, however, differences in both the other groups - opposite-sex attracted and not sure/neither - in particular in neighbourhoods of high socio-economic deprivation and among students born overseas where there were lower proportions of opposite-sex attracted and higher proportions of not sure/neither students.
Table 4. Prevalence of different sexual attractions by neighbourhood characteristics and birthplace in 2012
Opposite Sex Same/Both Sexes Not Sure/Neither
n % (95% CI) n % (95% CI) n % (95% CI) Neighbourhood deprivation1 Low deprivation 2466 93.2 (92.2-94.2) 105 3.9 (3.3-4.6) 76 2.9 (2.2-3.5) Medium deprivation 2682 93.6 (92.6-94.6) 86 3.0 (2.4-3.6) 100 3.4 (2.8-4.1) High deprivation 2114 88.5 (86.3-90.7) 107 4.5 (3.2-5.7) 170 7.0 (5.3-8.8) Geography Urban 6123 91.7 (90.6-92.8) 249 3.7 (3.2-4.2) 310 4.6 (3.7-5.5) Rural 1139 93.3 (91.9-94.6) 49 3.9 (2.9-4.9) 36 2.8 (1.7-3.9) Country of Birth NZ born 5841 92.8 (91.9-93.7) 237 3.7 (3.2-4.3) 223 3.5 (2.8-4.1) Born overseas 1491 88.7 (86.7-90.8) 65 3.8 (3.0-4.7) 125 7.4 (5.6-9.2)
1 Using the New Zealand 2006 Census meshblock data (Salmond, Crampton, Sutton, & Atkinson, 2006)
A minority of students (3.8%) are same/both-sex attracted; they make a diverse group and are represented across age, sex, ethnicity, degrees of deprivation, geographical locations, and countries of birth.
Coming out
Of those students who reported being same/both-sex attracted many had been aware of their sexual attractions at a relatively young age, but the majority became aware of their same-sex attractions during their secondary school years. In each of the surveys approximately a third of same/both-sex attracted students were aware of their sexual attractions by the age of 11 (see Figure 1). About half the same/both-sex attracted students first became aware of their sexual attractions during the secondary school years (i.e. from the age of 13 years upwards), with a small proportion of approximately 5% (for the 2001, 2007, and 2012 surveys) probably becoming aware of their same/ both-sex attractions in the last year of school (at 17 or older).
Figure 1. Age when same/both-sex attracted students were first aware of same-sex attraction in 2001, 2007, and 2012
While reporting a same-sex sexual attraction in the anonymity of the Youth’12 survey amounts to a form of disclosure it was evidently not perceived as equivalent to coming out as 46.9% of the students who identified as being same/ both-sex attracted in the Youth’12 survey reported that they had not come out.
The proportion of same/both-sex attracted students who had come out had increased significantly between the survey waves p<0.0001 (see Lucassen et al., in press for more details). In 2001 approximately a third (31.3%) of same/both-sex attracted students reported that they were ‘out’ compared to 40.0% in 2007, and over half (53.1%) in 2012. However, as Table 5 highlights, of those students who had come out less than 15% reported that they could easily talk to their family about their sexuality in the most recent Youth2000 survey.
• In 2001, 2007, and 2012 many same/both-sex attracted students were aware of their same-sex attractions by the time they started secondary school. • In 2012 the majority of same/both-sex attracted students had come out,
whereas in 2001 about a third had come out.
• Across all three surveys less than a quarter of same/both-sex attracted students were able to easily talk to their family about their sexuality.
Table 5. Coming out by same/both-sex attracted students in 2001, 2007, and 2012
2001 2007 2012
n (95% CI)% n (95% CI)% n (95% CI)% Have you come out? (Told people close to you openly of your sexuality?)
Yes 109 31.3 (26.6-36.1) 136 40.0 (33.9-46.1) 158 53.1 (48.2-58.0) No 236 68.7 (63.9-73.4) 200 60.0 (54.0-66.1 139 46.9 (42.0-51.8)
Students who have come out (told people close to you openly of your sexuality) by sex
Female 56 32.2 (24.3-40.2) 77 43.3 (34.9-51.7) 110 56.2 (50.2-62.3) Male 53 30.4 (23.9-36.9) 59 36.4 (29.9-42.9) 47 46.6 (36.3-56.9)
Students who have come out (told people close to you openly of your sexuality) by age
13 or less 20 28.2 (18.3-38.2) 12 30.6 (14.0-47.2) 15 43.3 (27.1-59.4) 14 24 33.0 (21.7-44.3) 20 28.3 (17.3-39.3) 21 46.9 (33.5-60.3) 15 23 30.5 (20.5-40.5) 50 53.4 (44.1-62.7) 35 60.1 (48.6-71.6) 16 23 32.4 (22.4-42.5) 19 31.5 (19.1-44.0) 48 52.9 (42.6-63.3) 17 or older 19 33.5 (19.2-47.9) 35 46.6 (35.1-58.0) 39 56.9 (42.4-71.5)
Were you able to talk to your family about this?
Yes I could easily talk with them 25 23.3
(15.6-31.1) 33
23.7
(16.4-31.0) 43
14.4 (11.0-17.8)
Yes but it was difficult 13 12.1
(5.5-18.7) 18
12.9
(7.4-18.4) 43
14.4 (9.9-18.9)
No, I could not talk to my family 64 61.1
(51.5-70.7) 71 54.2 (44.4-64.0) 176 58.9 (53.5-64.4) Doesn’t apply to me 3 3.5 (0.0-7.8) 12 9.3 (3.3-15.3) 36 12.3 (8.3-16.2)
Family relationships
All young people need adults who care about them, support them, supervise and look after them. They also need meaningful participation in family life, high expectations for their behaviour, and safety from harm (Gray & Steinberg, 1999). Supportive, safe and caring families are particularly important for the health and wellbeing of same/both-sex attracted young people as these youth are at an elevated risk of physical and emotional harm (Lucassen et al., in press; Lucassen et al., 2011). In all three surveys, students were asked questions about their family and their perceptions of themselves within their family. In 2012, the great majority of same/both-sex attracted students felt that their parents (or someone who acts like a parent) cared about them a lot (86.7%), and many reported
that they got to spend enough time with their parents (49.6%), had fun together as a family (54.6%), and were happy with their family relationships (69.4%). However, on all these measures, same/both-sex attracted students’ relationships with their families (though mostly positive) were proportionately less so than the relationships enjoyed by opposite-sex attracted students. Furthermore, same/both-sex attracted students appeared to be more than twice as likely to have run away from home overnight (25.8%) than opposite-sex attracted students (10.6%).
Figure 2. Parental and family relationships in 20121
1 This figure and all the following figures exclude data on not sure/neither students.
Same/both-sex attracted students were more likely to find it difficult to talk to their mothers and fathers about problems or worries when compared to their opposite-sex attracted peers. For example, only 12.1% of same/both-sex attracted students reported that they could talk to their dad a lot about problems or worries, compared to 24.7% of opposite-sex attracted students. On a more positive note, same/both-sex attracted students appeared almost as comfortable as their opposite-sex attracted peers talking to siblings and other family members (see Figure 3).
Figure 3. Ability to talk to family members about problems/worries in 2012
• Over 80% of same/both-sex attracted students felt that their parents cared about them a lot in 2001, 2007, and 2012.
• Same/both-sex attracted students reported less positive family relationships and functioning compared to their opposite-sex attracted peers.
Comparisons 2001, 2007, and 2012
Across the three surveys, over 80% of same/both-sex attracted students felt that their parents cared about them a lot and about half got to spend enough time with their parents. However, opposite-sex attracted students were proportionately more likely to report positive family relationships than same/both-sex attracted students in 2001, 2007, and 2012. This pattern was consistent across survey waves, as the changes over time (when opposite-sex attracted students were compared to same/both-sex attracted students) were not significant for ‘parents care about me a lot’ (p=0.45) and ‘gets to spend enough time with parents’ (p=0.41) (see Figures 4 & 5).
• The overall health and wellbeing of same/both-sex attracted students is compromised relative to opposite-sex attracted students.
Figure 4. Parents care about me a lot in 2001, 2007, and 2012
Figure 5. Gets to spend enough time with parents in 2001, 2007, and 2012
Health and wellbeing
General health and wellbeing
In 2012, half (50.3%) of the same/both-sex attracted students were categorised as having good emotional wellbeing, based on a WHO-5 Well-being Index Score, whilst more than three-quarters of opposite-sex attracted students had good emotional wellbeing (77.2%). The majority of same/both-sex attracted students reported ‘good to excellent’ general health (77.4%). However, this was not as high as the proportion among opposite-sex attracted students (91.9%). Furthermore, a greater proportion of same/ both-sex attracted students reported having a long term health problem (34.0%), compared to their opposite-sex attracted peers (19.9%). Only 22.2% of same/both-sex attracted students were very satisfied or happy with life, compared to 49.6% of opposite-sex attracted students. Approximately one in ten (10.6%) same/both-sex attracted students reported having severe difficulties with their emotions, concentration, behaviour, or getting along with others.
Figure 6. Overall health, wellbeing and health problems in 2012
• The overall health and wellbeing of same/both-sex attracted students is compromised relative to opposite-sex attracted students.
Comparisons 2001, 2007, and 2012
Across the three surveys, over 80% of same/both-sex attracted students felt that their parents cared about them a lot and about half got to spend enough time with their parents. However, opposite-sex attracted students were proportionately more likely to report positive family relationships than same/both-sex attracted students in 2001, 2007, and 2012. This pattern was consistent across survey waves, as the changes over time (when opposite-sex attracted students were compared to same/both-sex attracted students) were not significant for ‘parents care about me a lot’ (p=0.45) and ‘gets to spend enough time with parents’ (p=0.41) (see Figures 4 & 5).
• The overall health and wellbeing of same/both-sex attracted students is compromised relative to opposite-sex attracted students.
Accessing healthcare
Same/both-sex attracted students experienced more difficulties accessing health services than their opposite-sex attracted peers. For example, 35.2% of same/both-sex attracted students reported that in the previous 12 months they had wanted to see a health professional but were unable to, compared to 17.6% of opposite-sex attracted students. However, proportionately more same/both-sex attracted students than opposite-sex attracted students had spoken to a health provider in private and had been told by a health professional that their health care would be confidential. Forty-one percent of same/both-sex attracted students had seen a health professional for emotional worries in the last 12 months, compared to 16.6% of opposite-sex attracted students.
Figure 7. Access to private and confidential health services and help for emotional worries in 2012
Figure 8 highlights that same/both-sex attracted students were more likely to experience difficulty accessing help for contraception/sexual health, an emotional worry, or a pregnancy test compared to their opposite-sex attracted peers.
Figure 8. Difficulty accessing health services for emotional, sexual, or reproductive health concerns in 2012
A small proportion of same/both-sex attracted students refrained from going to see their doctor either because they were worried that their doctor would disclose their sexuality to other people (6.3%) or because of concerns about the doctor’s views on ‘gay people’ (6.3%).
• Same/both-sex attracted students reported greater difficulty (than opposite-sex attracted students) in accessing healthcare.
• Same/both-sex attracted students were more likely than their opposite-sex attracted peers to seek help for an emotional worry. However they experienced greater difficulties accessing this help.
Emotional wellbeing
Depression and self-harm
While most same/both-sex attracted students were not depressed and had not attempted suicide, Figure 9 highlights some concerning mental health disparities between same/both-sex attracted and opposite-sex attracted students. In particular, same/both-sex attracted students were more than three times more likely to exhibit significant depressive symptoms as assessed by the Reynolds Adolescent Depression Scale/RADS – Short Version (Milfont et al., 2008) when compared to their opposite-sex attracted peers (41.3% and 11.4% respectively). Same/both-sex attracted students were also more than twice as likely to have deliberately self-harmed in the previous 12 months than their opposite-sex attracted counterparts (59.4% compared to 23.0%).
Figure 9. Depressive symptoms and deliberate self-harming in 2012
Comparisons 2001, 2007, and 2012
Across all three survey waves same/both-sex attracted students were proportionately more likely to have depressive symptoms than opposite-sex attracted students. Furthermore the percentage of same/both-sex attracted students with depressive symptoms has increased from 27.0% in 2001 to 41.3% in 2012 whilst the percentage of opposite-sex attracted students with depressive symptoms has remained relatively stable (i.e. 11.4% in 2001, 9.5% in 2007, and 11.4% in 2012). These changes over time (when opposite-sex attracted students were compared to same/both-sex attracted students) were statistically significant (p=0.008).
Figure 10.
Depressive symptoms 2001, 2007, and 2012
Suicidality
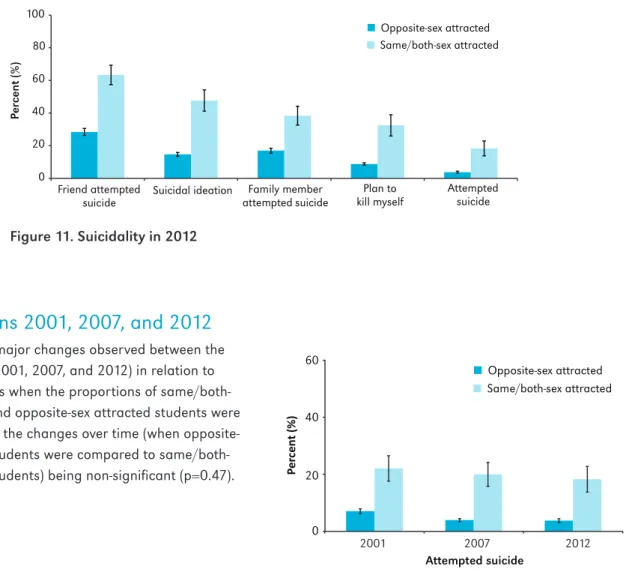
Almost half of the same/both-sex attracted students (47.7%) reported seriously thinking about attempting suicide and approximately one-in-five (18.3%) had attempted suicide in the last 12 months. In comparison much smaller proportions of opposite-sex attracted students reported the same, with 14.7% having seriously thought about attempting suicide and 3.8% reporting having attempted suicide.
• Same/both-sex attracted students reported higher rates of depression, suicide attempts, and self-harming compared to opposite-sex attracted students.
• The proportion of same/both-sex attracted students with significant depressive symptoms has increased from 2001 to 2012.
Figure 11. Suicidality in 2012
Comparisons 2001, 2007, and 2012
There were no major changes observed between the three surveys (2001, 2007, and 2012) in relation to suicide attempts when the proportions of same/both-sex attracted and opposite-same/both-sex attracted students were compared, with the changes over time (when opposite-sex attracted students were compared to same/both-sex attracted students) being non-significant (p=0.47).
Figure 12. Attempted suicide2001, 2007, and 2012
Substance use
• Same/both-sex attracted students are at an elevated risk of alcohol and drug use in comparison to their opposite-sex attracted peers.
• Weekly cigarette smoking among same/both-sex attracted students has decreased considerably between 2001 and 2012.
Substance use
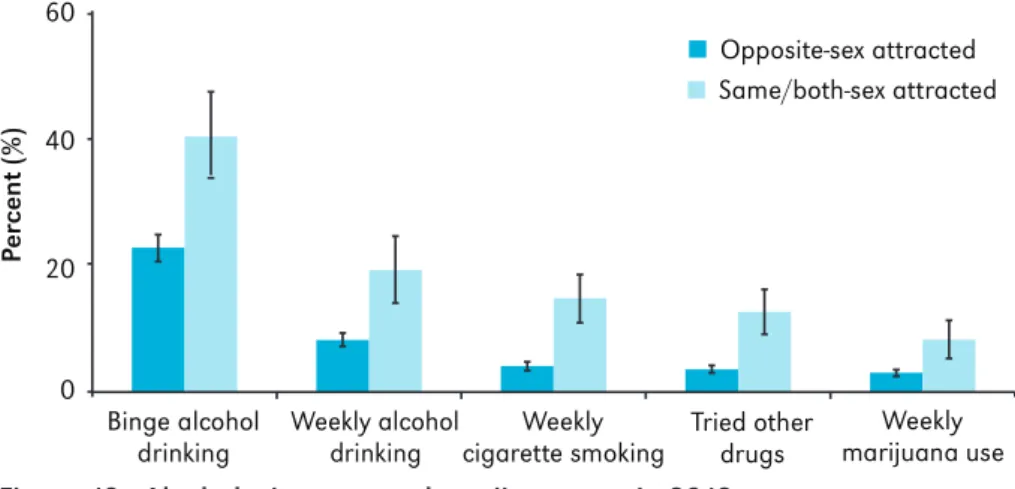
Alcohol, cigarette, marijuana and other drug use
Most same/both-sex attracted students do not use alcohol or other drugs on a regular basis. However, as
highlighted in Figure 12, sizeable proportions do. They are also more likely than opposite-sex attracted students to: drink alcohol weekly; smoke cigarettes weekly; use marijuana on a weekly basis; have tried other drugs; or, binge drink alcohol (defined as consuming five or more alcoholic drinks within four hours at least once in the last four weeks).
Figure 13. Alcohol, cigarette and marijuana use in 2012
Comparisons 2001, 2007, and 2012
Between 2001 and 2012 there has been a general pattern of binge alcohol drinking decreasing for same/ both-sex attracted and opposite-sex attracted students (although this reduction has been more pronounced amongst opposite-sex attracted students). Opposite-sex attracted students in 2001, 2007, and 2012 were proportionately less likely to report binge drinking alcohol than same/both-sex attracted students. This pattern was consistent across survey waves, as the changes over time (when opposite-sex attracted students were compared to same/both-sex attracted students) were not significant for binge drinking alcohol (p=0.06).
Figure 14.
Following a similar trend to binge alcohol drinking, between 2001 and 2012 there has been a general pattern of weekly cigarette smoking decreasing for same/both-sex attracted and opposite-sex attracted students (although this reduction has been more pronounced amongst opposite-sex attracted students). For example the proportion of same/both-sex attracted students who smoke cigarettes weekly has decreased from 26.7% in 2001 to 15.0% in 2012. This pattern of decreasing weekly cigarette use was consistent across survey waves, as the changes over time (when opposite-sex attracted students were compared to same/both-sex attracted students) were not significant (p=0.05).
Sexual health
Sexually active students
Greater proportions of same/both-sex attracted students reported that they have ever had sexual intercourse/‘ever had sex’ (52.1%) and are currently sexually active (41.0%) compared to opposite-sex attracted students (23.7% and 18.5% respectively). It is important to highlight that the ‘ever had sexual intercourse’ question used in the Youth2000 surveys asked about ‘sexual intercourse or going all the way’. Therefore this item needs to be interpreted with caution, as for some young people (especially same/ both-sex attracted youth) sex will not equate to ‘sexual intercourse’.
Figure 16. Students who have ever had sex or are sexually active currently in 2012
Sexual health of sexually active male
and female students
The statistics on the sexual health of those students who are currently sexually active (i.e. had sex in the last three months), where the results have been presented separately for male and female participants according to sexual attraction, need to be interpreted with caution. This is because many of the numbers (‘n’) are small (i.e. ≤30), with wide and overlapping 95% confidence intervals. Furthermore, ‘contraception use’ may not be relevant for many same/both-sex attracted students and condom use will not be applicable to numerous same/both-sex attracted females. About half of the sexually active male same/both-sex attracted and opposite-same/both-sex attracted students indicated regular condom and/or contraceptive use. Just over half (53.8%) of the male same/both-sex attracted students had used a condom the last time they had sexual intercourse. This suggests that condom use amongst these students needs to be further promoted, as prevention of HIV should focus on raising condom use in males having sex with males (Saxton, Dickson, Griffiths, Hughes, & Rowden, 2012).
Figure 17. Condom/contraceptive use and sexually transmitted infections among sexually active males in 2012
• Most same/both-sex attracted students have had sex, whereas the majority of opposite-sex attracted students have not.
• Just over half of the same/both-sex attracted male students used a condom the last time they had sexual intercourse.
When one considers the sexual health needs of many same/both-sex attracted female students, it is not surprising that there were lower proportions of sexually active female same/both-sex attracted students consistently utilising condoms and contraceptives relative to female opposite-sex attracted students. This general trend needs to be interpreted cautiously as the 95% confidence intervals overlap. However, it is important to note there is international evidence to suggest that same/both-sex attracted females are more vulnerable to sexually transmitted infections and unplanned pregnancy than their heterosexual or opposite-sex attracted peers (Saewyc, 2014).
Figure 18. Condom/contraceptive use and sexually transmitted infections among sexually active females in 2012
Comparisons 2001, 2007, and 2012
Over half of the same/both-sex attracted students in 2001, 2007, and 2012 had ever had sex and they were more likely to have ever had sex relative to opposite-sex attracted students. In 2012 there was a general pattern of proportionately fewer same/both-sex attracted students and opposite-same/both-sex attracted students ever having had sex when compared to their 2007 counterparts. The overall trends were consistent across survey waves, as the changes over time (when opposite-sex attracted students were compared to same/both-sex attracted students) were not significant (p=0.37). However, with students overall there has been a significant reduction in students ever having sex between 2001 and 2012 (Clark, Fleming, Bullen, Crengle, et al., 2013).
School
Over eighty percent (80.5%) of same/both-sex attracted students reported that they liked school (i.e. they liked it ‘a lot’, ‘a bit’, or thought that it was ‘okay’) and nearly three-quarters felt part of their school (73.3%). However, they were less likely than their opposite-sex attracted peers to report liking school and feeling part of their school. About one-quarter of same/both-sex attracted (24.2%) and opposite-sex attracted students (26.9%) reported that adults at school cared about them a lot.
Figure 20.
Feelings of connection with school in 2012 In Youth’12 a higher proportion of same/both-sex attracted (36.3%) than opposite-sex attracted students (22.0%) had truanted (wagged or skipped school for a full day or more without an excuse) in the last year. Of the same/both-sex attracted students who had truanted, most had missed just a few days of school with only a small proportion (13.4%) missing more than 10 days. Most same/both-sex attracted students intended to get more training or education after they left school (67.2%), whilst approximately a quarter planned to start work or look for a job. Less than six percent (5.4%) of same/both-sex attracted students had no plans for when they left school.
Comparisons 2001, 2007, and 2012
Between 2001 to 2012 the proportion of same/ both-sex attracted students who felt part of school remained about the same. In comparison, the proportion of opposite-sex attracted students who felt part of their school increased from 82.2% in 2001 to 87.7% in 2012. The overall patterns were consistent across survey waves, as the changes over time (when opposite-sex attracted students were compared to same/both-sex attracted students) were not significant (p=0.07).
Figure 21.
Feels part of school 2001, 2007, and 2012
• The majority of same/both-sex attracted students liked school and felt part of their school.
• Most same/both-sex attracted students had not been truant.
Safety, bullying and discrimination
Three-quarters (74.8%) of same/both-sex attracted students felt safe at school all or most of the time, however this proportion was considerably lower than among opposite-sex attracted students (87.5%). Additionally, same/both-sex attracted students were more concerned than their opposite-sex attracted peers about their safety and about being bullied at school. For example, the majority (57.9%) had been afraid that someone would hurt or bother them at school (one or more times in the previous year) and 43.3% had been hit or physically harmed on purpose in the last 12 months.
Figure 22. Rates of bullying in 2012
Almost one-in-five same/both-sex attracted students reported being bullied at school on a weekly or more frequent basis (16.5%). Of those students who had been bullied, over eight times as many same/ both-sex attracted students (46.1%) reported that they were bullied because they were gay or because people thought that they were gay compared to their opposite-sex attracted peers (5.4%). This indicates that same/both-sex attracted students (as well as some opposite-sex attracted students) experience bullying because others thought they were gay. This also suggests that same/both-sex attracted students are subjected to additional harassment, ‘over and above’ the bullying related to their sexuality. In their neighbourhoods too, fewer same/both-sex attracted students (45.3%) than opposite sex attracted students (54.9%) reported feeling safe all of the time.
Figure 23. Proportions of students bullied because they were thought to be gay in 2012
• Most same/both-sex attracted students had been afraid that someone would hurt or bother them at school in 2012.
• There have been no improvements in relation to school bullying for same/ both-sex attracted students (or opposite-sex attracted students) between 2001 and 2012.
Comparisons 2001, 2007, and 2012
There has been a small general pattern of
improvement in relation to same/both-sex attracted and opposite-sex attracted students and feeling safe at school between 2001 and 2012. However, for each survey wave opposite-sex attracted students were proportionately more likely to report feeling safe at school than same/both-sex attracted students. For example, in 2012, 87.5% of opposite-sex attracted and 74.8% same/both-sex attracted students reported feeling safe at school all or most of the time. These patterns were consistent across survey waves, as the changes over time (when opposite-sex attracted students were compared to same/both-sex attracted students) were not significant (p=0.25).
Figure 24.
Feels safe at school 2001, 2007, and 2012
In 2001, 2007, and 2012 almost one-in-five same/both-sex attracted students had experienced bullying at school on a weekly or more frequent basis. There have been no improvements across survey waves in relation to weekly bullying for same/both-sex attracted and opposite-sex attracted students, and these patterns were consistent across survey waves, as the changes over time (when opposite-sex attracted students were compared to same/both-sex attracted students) were not significant (p=0.60).
Figure 25.
Community
Overall, same/both-sex attracted and opposite-sex attracted students reported having similar levels of connectedness in relation to having friends they could talk to about anything and feeling okay talking to an adult outside their family about serious problems. However, despite the majority of same/both-sex attracted students reporting having friends that care about them a lot (64.5%), this was lower than amongst opposite-sex attracted students (72.7%).
Figure 26. Connectedness of students with friends and adults outside the family in 2012
Same/both-sex attracted students were considerably less likely than opposite-sex attracted students to belong to a sports team or group (23.4% versus 46.5%), but they were more likely to work as a volunteer in the community.
Figure 27. Involvement in sports, cultural, volunteer and other teams/groups in 2012
In 2012 comparable proportions of same/both-sex attracted and opposite-sex attracted students reported spiritual/religious beliefs being very important; attending a place of worship weekly (or more often); and, belonging to a church group (see Table 16).
Comparisons 2001, 2007, and 2012
Between the three surveys there has been a general pattern of proportionately fewer same/both-sex attracted and opposite-sex attracted students reporting that spiritual beliefs or religious faith were very important to them. For example, in 2001 44.2% of same/both-sex attracted students reported this was important to them compared to 27.0% of same/ both-sex attracted students in 2012. These reductions over time have been more pronounced for same/both-sex attracted students than for opposite-same/both-sex attracted students, but the changes over time (when opposite-sex attracted students were compared to same/both-sex attracted students) were not significant (p=0.05).
Figure 28. Spiritual beliefs or religious faith 2001, 2007 and 2012
• A greater proportion of same/both-sex attracted students worked as volunteers in comparison to opposite-sex attracted students. • Most same/both-sex attracted students had
friends that cared about them a lot, friends they could talk to about anything, and they had an adult who was a non-family member that
Useful Links
General Health and Wellbeing
Health Information for Young People www.youthline.co.nz/
Youth2000 – Youth Health Information and Statistics www.youthresearch.auckland.ac.nz/
Lesbian, Gay, Bisexual, Transgender (LGBT) and Questioning Youth
Advocacy and support for LGBT youth
www.rainbowyouth.org.nz
http://curious.org.nz (for details of LGBT groups found throughout New Zealand)