STATISTICAL METHODS AND ANALYSIS IN GENOME WIDE ASSOCIATION STUDIES AND NEXT-GENERATION SEQUENCING
by
Wei Chen
A dissertation submitted in partial fulfillment of the requirements for the degree of
Doctor of Philosophy (Biostatistics)
in The University of Michigan 2011
Doctoral Committee:
Professor Gonçalo R. Abecasis, Chair Professor Michael L. Boehnke
Professor Bin Nan
Research Assistant Professor Hyun Min Kang Professor Anand Swaroop, National Eye Institute
© Wei Chen 2011
ii
Acknowledgements
I would like to thank many people including my committee members, friends, colleagues and my family. Without the guidance and help from them, this dissertation will not be possible.
First of all, I would like to express my deepest gratitude to my thesis advisor, Dr. Gonçalo Abecasis, who brought me to this exciting area, led me to the challenging and interesting genetic problems and offered excellent guidance. During my Ph.D. study, I also benefit a lot from the wonderful group atmosphere and the worldwide collaborations, provided by my advisor. I would like to thank Dr. Michael Boehnke, who is always willing to help and gave me great advice on many things ranging from problem solving, presentation skills, job hunting and communication experience. I would like to thank Dr. Bin Nan and Dr. Hyun Min Kang for guiding my research for the past few years. My special thanks are delivered to Dr. Anand Swaroop, who provided unique opportunity for me to work on wonderful eye-related genetic problems and broaden my knowledge in biology and medical science.
iv
I am very thankful to knowledgeable faculty members, CSG members and fellow students in the Department of Biostatistics at the University of Michigan. I enjoy being a graduate student and doing research in this nice community.
My deep gratitude is given to my beloved wife Ying. Ying keeps encouraging and supporting me at my good and bad times. My daughter Claire always gives me a lot of happiness and working energy. I would like to thank my parents for their caring and supporting and Ying’s parents for their encouragements.
TALBE OF CONTENTS
DEDICATION ... ii
ACKNOWLEDGEMENTS ... iii
LIST OF FIGURES ...vi
LIST OF TABLES ... vii
ABSTRACT ... viii
CHAPTER 1 INTRODUCTION AND THE SCOPE OF THIS DISSERTATION ... 1
1.1GENETIC STUDY OF COMPLEX DISEASES ... 1
1.2STATISTICAL AND COMPUTATIONAL CHALLENGES IN GWAS AND NGS ... 2
1.3THE SCOPE OF THIS DISSERTATION ... 3
CHAPTER 2 GENOME-WIDE ASSOCIATION STUDY AND PREDICTION FOR AGE-RELATED MACULAR DEGENERATION ... 7
2.1INTRODUCTION ... 7
2.2GENOTYPING DATA ... 8
2.3STATISTICAL METHODS ... 8
2.4RESULTS AND DISCUSSION ... 11
CHAPTER 3 GRAPHICAL BROWSER FOR GWAS WITH HIGH-DIMENSIONAL PHENOTYPES ... 41
3.1INTRODUCTION ... 41
3.2FEATURES OF GWASGUIBROWSER ... 42
3.3EXAMPLES OF APPLICATION ... 44
3.4IMPLEMENTATION ... 45
CHAPTER 4 GENOTYPE CALLING AND HAPLOTYPING IN PARENT-OFFSPRING TRIOS . 47 4.1INTRODUCTION ... 47
4.2MATERIAL AND METHODS ... 49
4.3DATA SETS ... 55
4.4RESULTS ... 57
4.5DISCUSSION ... 63
CHAPTER 5 STATE SPACE REDUCTION MODEL FOR HAPLOTYPING AND GENOTYPE CALLING ... 80
5.1INTRODUCTION ... 80
5.2METHOD ... 81
5.3RESULTS AND DISCUSSION ... 90
CHAPTER 6 SUMMARY AND DISCUSSION ... 101
6.1SUMMARY AND FUTURE WORK OF CHAPTER 2-5 ... 101
6.2ONGOING WORK AND FUTURE PLAN ... 104
6.3CONCLUSION ... 107
vi
LIST OF FIGURES
Figure 2.1 Summary of genomewide association scan results ... 36
Figure 2.2 Regional plots for association signals in five previously reported loci ... 37
Figure 2.3 Regional plot for association signals in the three new loci ... 38
Figure 2.4 Regional plot of association signals in HDL-c and AMD ... 39
Figure 2.5 Multi-locus genotypes and disease risk ... 40
Figure 3.1 An illustration of the GWAS GUI browser interface ... 46
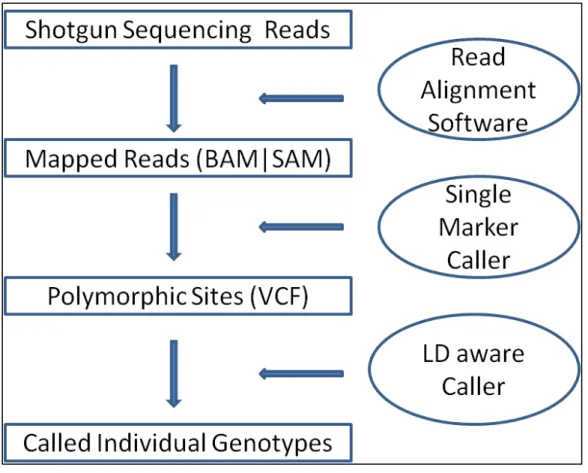
Figure 4.1 Workflow of SNP discovery and genotype calling ... 75
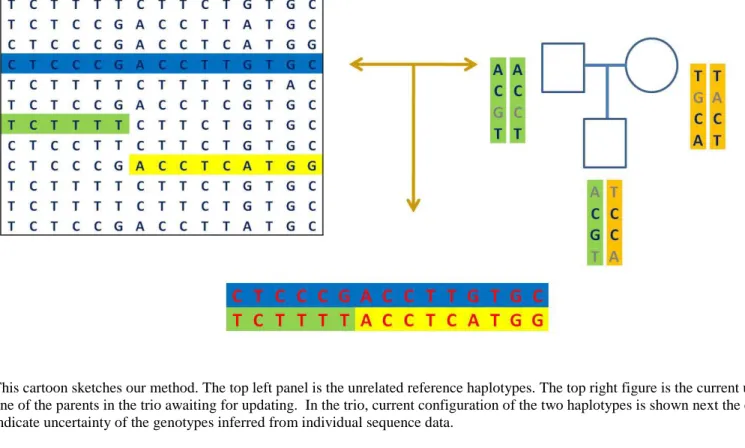
Figure 4.2 Cartoon view of LD-aware method for unrelated samples and parent-offspring trios ... 76
Figure 4.3 Frequency stratified mismatch rate at heterozygote sites at different depths for 30 trios, 60 unrelated and 90 unrelated samples at base error rate 0.01 ... 77
Figure 4.4 Genotype distributions and disconcordance for heterozygotes, reference homozygotes and alternative homozygotes ... 78
Figure 5.1 Cartoon view of the standard hidden Markov model for imputation and haplotype inference ... 96
Figure 5.2 The pattern of the number of unique haplotypes (for a fixed window of 10kb) ... 97
Figure 5.3 Decomposition of template haplotypes ... 98
Figure 5.4 Cartoon view of the state space reduction method in an exampled window.. 99
Figure 6.1 A comparison of some conventional methods, homogeneous HMM approach and non-homogeneous HMM approach ... 108
LIST OF TABLES
Table 2.1 Summary description of discovery samples used in the genome-wide
association and replication studies ... 22
Table 2.2 Confirmation of previously reported association signals in the discovery samples ... 23
Table 2.3 New Locus with Confirmed Association to AMD (p < 5x10⁻⁸) ... 24
Table 2.4 Association of HDL-C loci with AMD... 25
Table 2.5 Association results of some published candidate SNPs in our scan ... 26
Table 2.6 Complete Results for All SNPs Where Replication Attempted ... 27
Table 2.7 Sample by Sample Results for Newly Reported Loci ... 28
Table 2.8 Best genotyped proxy SNPs for reported loci ... 33
Table 2.9 Association Results in Discovery Sample for Different Analysis Models ... 34
Table 2.10 Evaluation of Association of Loci with p < 5x10⁻⁸ Overall In Specific AMD Subtypes (OR, 95 C.I., p-value) ... 35
Table 4.1 Error rates for genotype calling ... 67
Table 4.2 Quality of estimated haplotypes in simulated 1Mb regions ... 68
Table 4.3 Family structures of the SardiNIA data sets ... 69
Table 4.4 Overall genotype concordance between metabochip and low-pass sequence data from Sardinia project ... 70
Table 4.5 Stratified genotype concordance between metabochip and low-pass sequence data from Sardinia project ... 71
Table 4.6 Improvement of genotype accuracy with phased input from Beagle ... 72
Table 4.7 Error rates stratified by frequency at heterozygotes for genotype calling ... 73
Table 4.8 Comparisons of mismatch rate between the child and the parents for the simulation of 30 trios ... 74
Table 5.1 Estimate of running time and memory for haplotype inference using MaCH. 93 Table 5.2 Comparisons of the computing time and memory in simulations ... 94
viii
ABSTRACT
STATISTICAL METHODS AND ANALYSIS IN GENOME WIDE ASSOCIATION STUDIES AND NEXT-GENERATION SEQUENCING
by
Wei Chen
Chair: Gonçalo R. Abecasis
Genome-wide association studies (GWAS), which examine common genetic variants in thousands of individuals, have identified many genetic loci associated with a variety of complex diseases and phenotypes. New Next-Generation Sequencing (NGS) technologies allow us to extend these studies to rarer variants not typically evaluated by GWAS. In this dissertation, I present novel statistical methods and software to dissect the genetic basis of complex traits in the context of both GWAS and NGS.
First, I present a large-scale GWAS for Age-related Macular Degeneration (AMD). Our studies extend the catalog of AMD associated loci and provide clues about underlying cellular pathways. A novelty in our study is that I propose a prediction method using all susceptibility loci to help identify individuals at high risk of disease. The prediction can be extended to the general population with a weighted scheme combining both disease prevalence and case-control ratio in GWAS sample.
Second, I describe an interactive package that provides graphical overviews of the results of whole-genome association studies in datasets with rich multi-dimensional phenotypic information, such as global surveys of gene expression.
Third, I propose and implement an efficient Hidden Markov Model (HMM) based method for genotype calling and haplotype inference in parent-offspring trios. Our method considers both linkage disequilibrium (LD) patterns and the constraints imposed by the family structure in assigning individual genotypes and haplotypes. Using simulations and sequencing data from ongoing projects, I show that trios provide higher genotype calling accuracy across the frequency spectrum, both overall and at hard-to-call heterozygous sites. In addition, sequencing trios can provide greatly improved haplotype phasing accuracy.
Finally, I describe an efficient state space reduction method for haplotype inference and genotype calling. This method is motivated by the increasing computational challenge of HMM-based approaches used to describe haplotype sharing in GWAS and NGS data. Our method takes advantage of local similarity between haplotypes and reduces the HMM state space dynamically, while preserving the same accuracy of full state space method. Through simulation and real data analysis, I show that this method can have substantial savings in both memory and CPU time.
1
Chapter 1
Introduction and the Scope of this Dissertation
1.1 Genetic Study of Complex Diseases
Modern genetics originated from simple Mendelian disorders back to a century ago. In the past decades, more attention has been paid to complex traits, which are much more complicated and caused by both genetic and environmental factors. To understand the genetic basis of complex diseases and many common phenotypes, linkage analysis and association analysis, have made substantial progress in the past few decades [1, 2]. Due to the high experimental cost and limitations of biology technology, only a small fraction or a few short regions of the genome were studied and thus the localization of the disease-associated variants was very limited. Shortly after the completion of Human Genome Project, genome-wide association study (GWAS) became a feasible and powerful approach to uncover genetic variants with much better resolution by examining hundreds of thousands of Single Nucleotide Polymorphisms (SNPs) across the whole genome. Over one thousand loci susceptible to common diseases and phenotypes have been revealed [3-5] and have led to subsequent functional analysis in biomedical area. Despite the number of loci identified, GWAS are based on the hypothesis of common disease / common variant (CDCV) and a large proportion of heritability has not been explained [6]. Rare variants are believed to play an important role in the missing heritability. To study rare variants and pinpoint the causal alleles more accurately,
sequencing technology has been advanced rapidly in the past few years, boosted by several worldwide giant projects such as 1000 Genomes Project (ww.1000genomes.org). Next-generation sequencing (NGS) allows us to detect more variants, including SNPs and structural variations, and explore rare variants systematically beyond common variants assayed by GWAS.
1.2 Statistical and Computational Challenges in GWAS and NGS
Compared to the genetic studies back to thirty years ago, GWAS and NGS generate a huge amount of data. For GWAS, thousands of samples are collected and genotyped using commercial or customized microarray chips examining hundreds of thousands to millions of variants across the genome. Statistical methods are crucial to analyze such data sets [7]. A few successful examples include but are not limit to a) power calculation for study design; b) genotype imputation for meta-analysis and examining more variants; c) methods for adjusting population stratification; d) methods for adjusting multiple testing. For NGS, the data scale grows to another level. The statistical and computational challenges mainly lie on two levels: a) lower level variants calling and haplotype inference from sequencing data; b) upper level association tests involving rare variants and structural variations. Unlike very accurate genotypes from GWAS, high throughput sequencing machine generates millions of short fragments of the genome. This process requires accurate and efficient statistical algorithms for mapping and genotype calling. The accuracy of genotypes is critical to follow-up association studies. New association tests are required in the context of NGS. For example, traditional association methods might be underpowered if disease is caused by multiple rare variants. The successful
3
greatly increased number of samples and DNA variants. Efficient computational methods and updated computer hardware are required to overcome these practical issues.
1.3 The Scope of this Dissertation
In this dissertation, I will present both methodologies and software developments about imputation, SNP calling, haplotype inference and multiple testing motivated by the challenges previously described; I will also present novel scientific findings on age-related macular degeneration and visualization tools developed for efficiently storing and displaying GWAS results with high-dimensional phenotypes.
In chapter 2, I present a genome-wide association study for age-related macular degeneration (AMD) in 2,157 cases and 1,150 controls [4]. Our results validate AMD susceptibility loci near CFH (P < 10-75), ARMS2 (P < 10-59), C2/CFB (P < 10-20), C3 (P < 10-9), and CFI (P < 10-6). I compared our top findings with the Tufts/Massachusetts General Hospital genome-wide association study of advanced AMD (821 cases, 1,709 controls) and genotyped 30 promising markers in additional individuals (up to 7,749 cases and 4,625 controls). With these data, I identified a susceptibility locus near TIMP3 (overall P = 1.1 × 10⁻¹¹), a metalloproteinase involved in degradation of the extracellular matrix and previously implicated in early-onset maculopathy. In addition, our data revealed strong association signals with alleles at two loci (LIPC, P = 1.3 × 10⁻⁷; CETP, P = 7.4 × 10⁻⁷) that were previously associated with high-density lipoprotein cholesterol (HDL-c) levels in blood. Consistent with the hypothesis that HDL metabolism is associated with AMD pathogenesis, I also observed association with AMD of HDL-c—
associated alleles near LPL (P = 3.0 × 10⁻³) and ABCA1 (P = 5.6 × 10⁻⁴). Multilocus analysis including all susceptibility loci showed that 329 of 331 individuals (99%) with the highest-risk genotypes were cases, and 85% of these had advanced AMD. In addition, I propose a novel method to facilitate the AMD prediction with GWAS data in general population. Our studies extend the catalog of AMD associated loci, help identify individuals with a high risk of developing the disease, and provide clues about underlying cellular pathways that could eventually lead to new therapies.
Following DNA microarray, NGS technologies allow us to explore more variants beyond GWAS. Much progress has been made for efficient and accurate genotype call from NGS data and simulations have been performed to study the efficiency and accuracy at different sample sizes and sequencing depths. However, most of the current variant calling algorithms can only handle unrelated samples; systematic evaluations of sequencing data of families are not available up to date. In Chapter 4, I propose an efficient and accurate method for genotype calling and haplotype inference in sequencing parent-offspring trios. This method combines both linkage disequilibrium (LD) patterns and family constraints within the trio together into a widely used hidden Markov model in imputation, which takes advantage of similar stretches of chromosomes shared between individuals. This method provides a tool of variant calling and haplotype phasing for many ongoing sequencing projects that have parent-offspring trios. In addition, I am able to explore the potential advantages of sequencing additional family members. I simulated shotgun sequencing data in genotype likelihood format (GLF) for trios and unrelated samples at various depths with two sequencing error rates. For same
5
number of sequenced samples, our simulations show that sequencing trios are preferable to unrelated samples at low depth 1X, 2X and 4X in terms of detecting polymorphic sites. Generally, trios have higher calling accuracy across different frequency spectra. Furthermore, sequencing trios can greatly increase the haplotyping accuracy, which is crucial for follow-up imputation with existing GWAS data. However, at depth 8X and above, the gain of trios are limited and design of unrelated samples are more preferable in terms of variant calling. The method can be extended to the designs of nuclear family and general pedigree structure.
There have been great successes of linkage disequilibrium (LD) based imputation and haplotype haplotype inference methods in detecting additional analysis and performing meta analysis across different platforms [4, 8, 9]. A commonly used approach is based on a hidden Markov model treating sample haplotype as a mosaic of a pool of reference haplotypes [10-14]. The size of the reference panel is usually limited to less than one hundred. As the reference panel expands quickly (e.g. 1000 Genomes Project) to a few hundred individuals or even more, the computing cost, including time and memory, increases as well. The type of method using full state space thus becomes less feasible in practice. On the other hand, the method using approximated reduced state space can be applied but will result in losing efficiency and accuracy, especially for genotype calling of rare variants. In chapter 5, I propose a state space reduction method to overcome the above two limitations. The method defines a set of quantities in a reduced state space to keep track of all information in full state space by taking advantage of local similarity between different haplotypes. The results from simulation and real data sets show that the
new method can substantially save computing memory and time while preserving the accuracy of the full sate space method.
In Chapter 6, I will summarize the work of Chapter 2-5 and discuss limitations and future plans. In addition, I will describe ongoing effort to address a multiple testing problem. I extend a hidden Markov model based FDR control procedure to account for non-homogeneous dependency structures. I developed a general EM algorithm for parameter estimation. I aim to explore its application in GWAS and sequencing, where hundreds of thousands of SNPs are examined with specific dependency structures.
Overall, my research will facilitate current biomedical research in different aspects including understanding the biology of retina, accurate genotype calling and haplotype inference program for next generation sequencing and improvement of existing
7
Chapter 2
Genome-wide Association Study and Prediction for Age-related Macular Degeneration
The content of this chapter has been published in Chen et al. 2010 [4].
2.1 Introduction
AMD is a progressive neurodegenerative disease and a common cause of blindness in the elderly population, particularly in developed countries [15, 16]. The disease affects primarily the macular region of the retina, which is necessary for sharp central vision. An early hallmark of AMD is the appearance of drusen, which are extracellular deposits of proteins and lipids under the retinal pigment epithelium (RPE). As the disease progresses, drusen grow in size and number. In advanced stages of AMD, atrophy of the RPE (geographic atrophy) and/or development of new blood vessels (neovascularization) result in death of photoreceptors and central vision loss [15, 17, 18].
Multiple genetic linkage studies provided strong evidence of susceptibility loci, notably on chromosomes 1q31 and 10q36 [19-23]. Disease-associated variants near CFH (1q31) and in a cluster of genes near ARMS2 (10q26) were first identified both through genomewide association studies (GWAS) [24, 25] and fine mapping of linkage signals [26-29]. Discovery of association between AMD and the CFH locus lead researchers to discovery of association signals near other complement genes, including C2/CFB, C3, and CFI [30-33].
2.2 Genotyping Data
The participants in genome-wide association study were mainly collected at the University of Michigan in Ann Arbor (collection coordinated by AS), at the University of Pennsylvania in Philadelphia (coordinated by DS), and at the Mayo Clinic in Rochester, Minnesota (coordinated by AE). Detailed information about the number of cases and controls and the distribution of age, sex and disease severity in each collection is summarized in Table 2.1.
Genotyping was performed at the Center for Inherited Disease Research (CIDR) at Johns Hopkins University using Illumina Human370 Bead Chips (Illumina, San Diego, CA, USA) and the Illumina Infinium II assay protocol [34]. Allele cluster definitions for each SNP were determined using Illumina BeadStudio Genotyping Module version 3.2.32 and the combined intensity data from 99% of the samples according to CIDR protocol; the resulting cluster definitions were then used on all samples. Genotypes were not called if the quality threshold (gencall score) was below 0.25. Genotypes were not released from CIDR for SNPs which failed technical filters for call rates less than 85%, more than 1 HapMap replicate error, more than a 4% (autosomal) or 5% (X chromosome) difference in call rate between sexes, more than 0.5% male heterozygote frequency for X chromosome. Y and XY SNPs were manually reviewed and clusters adjusted or genotypes dropped as appropriate. Genotypes were released from CIDR for 344,942 (99.46%) of the attempted SNPs. Blind duplicate reproducibility was 99.992%.
9
Population Stratification: The samples are all European descent. I used the software EIGENSTAT to adjust for the modest population stratification. After adjustment for the first two principal components of ancestry, the genomic control parameter was 1.007.
Genotype Imputation: To expand the genome coverage, I performed a genome-wide imputation using haplotypes from the HapMap CEU samples as templates (release 22).
Imputation was done using MACH (Yun Li
For downstream analyses, I filtered out poorly imputed SNPs and focused on markers with estimated r2 between imputed and true genotypes > 0.3.
Statistical Analyses: To investigate the association between each genotyped or imputed SNP and AMD, I first carried out a logistic regression for each SNP assuming an additive genetic model and adjusting for the top two eigenvectors from EIGENSTRAT. At p < 10
-6
, I identified a total of seven independently associated SNPs in previously reported loci (CFH, ARMS2, C3, C2/CFB and CFI). These SNPs were included as covariates in logistic regression analyses designed to identify additional loci associated with AMD.
Analysis for Follow-up Study: To combine the statistics across different groups for replication, I first selected an arbitrary reference allele for each marker and then calculated a z-statistic summarizing the evidence for association in each study (summarizing both the p-value, in its magnitude, and the direction of effect, in its sign). I then calculated an overall z-statistic as a weighted average of the individual statistics and calculated the corresponding p-value. Weights were proportional to the square root of the
number of individuals examined in each study and were selected such that the squared weights sum up to 1.0.
Association Testing: For samples including unrelated individuals only (all discovery samples, the Tufts/MGH samples and the Johns Hopkins, Oregon and Penn-NJ sample sets) the data were analyzed using simple logistic regression models with age and sex as covariates. For the discovery samples, the first two principal components of ancestry were used as covariates in all reported analyses and genotypes for the markers listed in Table 2.2 were used as covariates in a subset of the analyses (described in the text). For follow-up samples, genotypes at CFH and ARMS2 were included as covariates where available. For samples including related individuals, the data were analyzed with the test of Thornton and McPeek [35].
Risk Prediction Approach. To evaluate the cumulative contribution of the alleles identified here to disease risk, I fitted a simple logistic regression model to the data. The effect of each genotype was modeled on a log-additive scale, with no interaction terms between genotypes:
Then fitted probability is calculated for each sample
I sorted samples according to their fitted probability of disease and organized individuals into deciles of fitted risk yi. Then I counted the proportion of affected individuals in each
risk decile. In a subsequent analysis, I assigned different weights to cases and controls, designed to reflect the fact that cases are enriched in our sample. The weight is defined as
∑
+ = j ij j i) x it(y α β log ) 1 /( 1 ˆ ) ˆ ˆ ( +∑ − + = j j ij x i e y β α
=
11 and weighted fitted probability is defined as
where pcase = 0.65and pcontrol = 0.35are the fractions of cases and controls in our sample
and fcase = 0.20 and fcontrol = 0.80 are the expected fractions of cases and controls in an
elderly population at age ~75. Cases were assigned weight fcase/pcase and controls were
assigned weight fcontrol/pcontrol. I sort zi in an ascending order and denote as z(1),z(2),…,z(m)
with corresponding weight w(1),w(2),…,w(m). Taking these weights into account, I then
divided the sample into deciles ensuring that summed weights in each decile were identical. zi is used to estimate the case fraction in general population.
2.4 Results and Discussion
The execution of progressively larger GWAS typically results in the gradual discovery of new susceptibility loci (see the examples of Crohn’s disease [36], type 2 diabetes [37], obesity [38], and lipids [5, 39]). To identify additional susceptibility loci and biochemical pathways contributing to AMD, I performed GWAS in a large collection of cases and controls (Table 2.1) using a genotyping platform that captures >90% of common variants in European ancestry samples.
I genotyped study samples, including 75 blind duplicates, together with HapMap controls at the Center for Inherited Disease Research (CIDR, Johns Hopkins) with Illumina Human370 chips. After genotyping, I excluded 18 individuals with an unexpected 1st or 2nd degree relative in the dataset and 13 individuals with evidence for a non-European
i i
i
w
y
ancestry component[40] resulting in a total of 2,157 unrelated cases and 1,150 unrelated controls for analyses. I excluded markers with <95% call rate, minor allele frequency <1%, or evidence for deviation from Hardy-Weinberg equilibrium at p<10-6, resulting in a total of 324,067 autosomal SNPs for analysis. The average call rate for analyzed markers and samples was 99.94%. I identified short stretches of haplotype shared between individuals in our study and those in the HapMap CEU [41] and used these to impute missing genotypes, expanding the number of analyzed SNPs to about 2.5 million imputed or genotyped SNPs. Complete GWAS data and results are available from dbGaP accession phs000182.v1.p1.
An initial comparison of allele frequencies between cases and controls resulted in a genomic control parameter [42] of 1.056; adjustment for the first two principal components of ancestry [PCA, 40] reduced this to 1.007. PCA can account for subtle differences among European ancestry samples (such as North-South or East-West gradients in allele frequency, see [43]) and provide a useful safeguard against population stratification. All results reported here refer to this PCA adjusted analysis.
Reassuringly, I observed strong evidence of association at established susceptibility loci (see Table 2.2, Figure 2.1 and 2.2); near CFH (strongest association at rs10737680, odds ratio 3.11(2.76, 3.51), with p<1.6x10-75), near ARMS2 (at rs3793917, OR=3.40 (2.94,3.94), p=4.1x10-60), near complement component 2 (C2) and complement factor B (CFB) (at rs429608, OR=2.16 (1.84,2.53), p=2.5x10⁻²¹), and near complement component 3 (C3) (at rs2230199, OR=1.74 (1.47,2.06), p=1.0x10⁻⁹). Our study provides
13
confirmation of a recently reported association between AMD and complement factor I (CFI) (at rs2285714, OR=1.31 (1.18,1.45), p=3.4x10⁻⁷) [30]. Conditioning on the strongest associated variant at each of these loci identified additional, strong association signals near CFH (at rs1329424, p=6.4x10⁻¹⁶) and in the C2/CFB locus (at rs9380272, p=2.3x10⁻⁸), consistent with previous reports of multiple disease-associated alleles at the two loci [29, 31, 44, 45]. Where possible, I evaluated evidence for association at other previously suggested susceptibility loci using genotypes or imputed data. The results are summarized in Table 2.5; although none of these loci show p<.05 in our data, note that 8 of 9 signals trend in the same direction as the original report.
To identify new AMD susceptibility loci, I conditioned on the seven strongly associated SNPs (see Table 2.2) and repeated the genomewide analysis. No single SNP was significant at p<5x10⁻⁸ in this conditional analysis. Next, I exchanged initial results with the Tufts/MGH GWAS for 1358 SNPs that could be assayed directly with Affymetrix 6.0 genotyping arrays and that were significant at p<.001 in either study. Tufts/MGH GWAS results were adjusted for possible population stratification using genomic control[42], consistent with the analysis presented in the companion paper. After excluding 158 AREDS study participants that were genotyped in both studies, this allowed us to examine promising SNPs in an additional 821 cases with geographic atrophy or neovascularization and 1,709 controls. Twenty-five SNPs showing consistent evidence of association in both groups of participants and five other SNPs with strong evidence for association in our data alone were genotyped in additional samples (see Table 2.1). Summary results from follow-up experiments are presented in Table 2.6. Detailed results
for the three most strongly associated loci (near TIMP3, CETP, and LIPC) and two other loci discussed below (LPL, ABCA1) are provided in Table 2.7.
To validate our results, I examined Hardy-Weinberg equilibrium statistics and evidence for heterogeneity at these new loci. I also genotyped a subset of the imputed SNPs in our discovery sample. At each of these loci, Hardy-Weinberg equilibrium p-values in cases, in controls and in the combined dataset were all >.20, suggesting no data quality problems. Furthermore, I found no evidence for heterogeneity at any of these loci (all Cochran's Q heterogeneity p-values >.20). Finally, when I genotyped a subset of the 1,161 samples for 6 of the imputed SNPs near TIMP3 (our strongest new locus), I observed >99.4% concordance between imputed and genotyped alleles. Association results for this set of individuals were essentially the same whether imputed or actual genotypes were used for analysis. A comparison of results with genotyped and imputed SNPs at each locus is given in Table 2.8.
Our strongest new locus maps near TIMP3 and SYN3 on chromosome 22 (see Fig. 3, top panel, and Table 2.3). There, I found that very common alleles (frequency of ~.94 in controls) at rs9621532 and nearby markers were associated with increased risk of AMD (OR=1.41 (1.27,1.57), overall p=1.1x10⁻¹¹, one sided p-value in newly genotyped follow-up samples pfollow-up=3.3x10⁻⁷). Consistent with the expectation that GWAS tend to
estimate effect sizes (the “winner’s” curse effect), I found that odds-ratios estimates in the discovery samples were larger than in the follow-up samples [46]. Results at the TIMP3 locus were robust to a variety of analysis models (including different combinations of PCA, adjustment for previously known loci, and inclusion of age and
15
sex as covariates, see Table 2.9), are supported by nearby directly genotyped SNPs (see Table 2.8), and remain significant when data from the companion paper are excluded from analysis (overall p=7x10-11 excluding all Tufts/MGH data).
Two other loci also exhibited strong evidence for association. Near LIPC on chromosome 15, the common allele at rs493258 (frequency of ~.53 in controls) was associated with increased risk of AMD (OR=1.14 (1.09,1.20), overall p=1.3x10⁻⁷, pfollow-up=.0012). Near
CETP on chromosome 16, the rare allele at rs3764261 (frequency ~.36 in controls) was associated with increased risk of AMD (OR=1.19 (1.12,1.27), overall p=7.4x10⁻⁷, p follow-up=.009). The signals near CETP and LIPC do not reach p <5x10⁻⁸, corresponding to
genomewide significance after adjustment for one million independent tests. However, note that: (a) both LIPC and CETP show nominally significant association in follow-up samples alone; (b) less than 0.3 loci per scan are expected to reach p < 3x10⁻⁷ by chance, suggesting that one or both of these signals are real; (c) LIPC association with AMD reaches genomewide significance in a companion paper; (d) in a sample of Japanese individuals, top SNPs at CETP (p=.001), LIPC (p=.10)and TIMP3 (p=.09) trend in the right direction (see Table 2.7).
Additional experiments will be required to identify the functional alleles at each locus and the genes/pathways they impact. The challenges in identifying functional alleles are illustrated by the controversy over causal alleles near ARMS2 (where the PLEKHA1, ARMS2, and HTRA1 genes have been implicated [25-27, 47, 48]) and CFH (where non-coding variants may contribute to disease [44, 45] independently of the Y402H non-coding
variant that was the initial focus of attention). Despite these caveats, the new loci reported here suggest biological pathways influencing disease susceptibility and possibly new therapies.
Our top novel signal maps to a large intron of the synapsin III (SYN3) gene involved in neurotransmission and synapse formation [49]. The SNP is located about 100 kb upstream of TIMP3, a metalloproteinase encoded within the same intron of SYN3. TIMP3 is involved in degradation of the extracellular matrix and mutated in Sorby's Fundus Dystrophy [50], an early onset macular degenerative disease that shares clinical features with AMD but typically presents before age 40. Sorby's is extremely rare, presents with a highly penetrant autosomal dominant family history, and unlikely to be misclassified as AMD. When I excluded all patients with age of onset <60 from our sample, evidence for association at TIMP3 was essentially unchanged. Linkage of AMD to the TIMP3/SYN3 region has been reported previously [22]. The effects of the common alleles reported here are too small to account for the observed linkage signal, but it is possible that missed rare high penetrance alleles could reside in the same locus and explain the linkage.
Outside known loci and TIMP3, our two strongest signals are located near the hepatic lipase (LIPC) gene on chromosome 15q22 (initial evidence of association at rs493258 came from Tufts/MGH GWAS) and the cholesterylester transfer protein (CETP) gene on 16q21. The AMD associated alleles at these loci have been associated with HDL-c levels in blood [5, 39]. This prompted us to examine whether other common HDL-c associated polymorphisms might contribute to AMD risk. The three common alleles showing
17
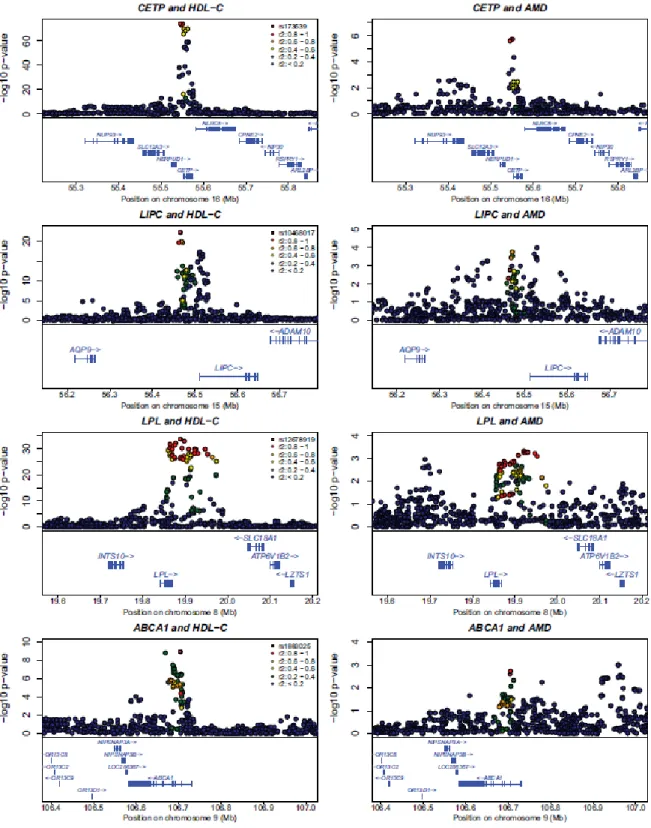
strongest association to blood HDL-c levels in an analysis of 19,840 individuals [5] also reveal evidence of association with AMD in our discovery cohort (rs173539 near CETP with p=2.4x10⁻⁶; rs12678919 near LPL with p=.0016; rs10468017 near LIPC with p=.0018). Table 2.4 and Suppl. Fig. 1 show that the same clusters of SNPs (colored) associated with HDL-C (each cluster has lead SNP with p < 5x10⁻⁸) are associated with macular degeneration; association signals are sharper for HDL-C given the much larger sample sizes (and greater power) of that analysis. Multiple common alleles near CETP and LIPC are associated independently with HDL-c levels [5]. In our sample, I find modest association of the secondary HDL-associated alleles in each of these loci with AMD (rs289714 near CETP with p=.062; rs2070895 near LIPC with p=.051). Finally, HDL-associated alleles near ABCA1 also show evidence of association with AMD (rs1883025, p=.0026). The probability that four or more of the 14 reported HDL-associated alleles [5] would show association with AMD with p<.0026 is extremely low (4x10⁻⁸), and the probability that the top three HDL- associated alleles would reveal association with p<.0018 is 6x10⁻⁹ (the probability of p<.14 or better, as in the replication samples alone, is .003). Importantly, since I found association specifically for alleles with the largest impact on HDL levels, it seems likely that additional signals may have been missed due to lack of power. Just as for CETP and LIPC, association signals at LPL and ABCA1 were consistent in follow-up samples and discovery samples; combining all available data I observed association with p=3.0x10⁻³ near LPL and 5.6x10⁻⁴ near ABCA1 (Table 2.4).
Cholesterol and lipids accumulate underneath the RPE with age [51] and are present in the drusen that characterize early AMD [52, 53]. Genetic variants that impact cholesterol levels in the macula and RPE might impact drusen formation and thus modulate the risk of AMD. Since alleles near CETP and LPL associated with decreased HDL-c levels in blood appear to increase the risk of AMD, but alleles near LIPC and ABCA1 associated with decreased HDL-c levels in blood appear to decrease the risk of AMD, I speculate that some alleles impact cholesterol levels in blood and in the macula in opposite directions. For example, a variant that impacts cholesterol transport between tissues could facilitate transport of HDL-c from the macula to the blood (or vice-versa). CETP and LPL play major roles in the synthesis and degradation of HDL-c, whereas LIPC and ABCA1 are involved in mediating the uptake of HDL-c at the cell surface. Previously, epidemiological studies have indicated a link between cardiovascular risk factors (including HDL-c) and incidence of AMD [54, 55], but these findings have not been definitive. Our data therefore suggest an important role for HDL-c metabolism in AMD pathogenesis but also that (a) blood HDL-cholesterol levels may be a poor surrogate for the impact of HDL-c on disease risk and that (b) further work is needed to characterize the relationship between AMD and HDL-c associated alleles. It would be particularly interesting to examine samples with information on AMD classification and direct measurements of HDL-c levels in the retina.
To investigate whether identified risk alleles contributed preferentially to one disease subtype, I carried out a series of subgroup comparisons (Table 2.10). When I compared different case subgroups, I found ARMS2 risk alleles were more common in cases with
19
neovascular disease than in cases with large drusen (OR=1.79 (1.50-2.13), p=4.3x10⁻¹¹) or with geographic atrophy (OR=1.36 (1.13-1.63), p=.0009). In contrast, CFH risk alleles were more common in cases with geographic atrophy than in those with large drusen (OR=1.38 (1.11-1.73), p=.0012) or neovascular disease (OR=1.32 (1.08-1.64), p=.009). Risk alleles near other complement genes appeared to be somewhat more common in cases with geographic atrophy than in those with neovascularization, whereas the reverse was true for risk alleles near TIMP3 (differences not significant). In our discovery sample, I tested for, but did not find, evidence of interactions between associated alleles at the seven loci listed in Tables 2.2 and 2.3. I also tested for, but did not find, significant interactions of risk alleles with sex and smoking.
Although the other GWAS paper did not identify TIMP3, targeted follow-up of the markers identified in our scan confirms our findings. The difference in the initial results of the two studies derives from different choices of markers to follow-up after the initial GWAS: a costly experiment with maximum power would involve genotyping all discovery and follow-up samples for all markers. Practical considerations meant that each study could only examine a subset of interesting markers in available follow-up samples. Ultimately, I expect that further genotyping of follow-up samples and meta-analysis of our results with those of future GWAS will identify more disease susceptibility loci. The variants identified here have only a modest impact on the risk of age-related macular degeneration. However, they do point to potentially important biological targets (such as the TIMP3 gene and HDL-cholesterol), whose effectiveness for therapeutic intervention remains to be evaluated. I note that genes like IL23 and HMGCR2 are extremely effective
drug targets (for the treatment of psoriasis and for LDL-cholesterol lowering medications, respectively) despite the fact that naturally occurring common variants in the corresponding loci account for only small changes in the risk of psoriasis [56] and in blood lipid levels [5], respectively.
Genetic susceptibility variants may be used to predict individual risk of AMD [57, 58]. To evaluate the effectiveness of the approach, I fitted a simple logistic regression model to the data. The model included the SNPs listed in Tables 2.2, 2.3 and 2.4 as predictors. For each SNP, a single variable encoding the number of risk alleles was modeled; no interaction terms or dominance effects were considered. In effect, the model calculates a weighted sum of risk alleles for each individual (with weights proportional to the log odds-ratio for each allele) and assigns individuals with large weighted sums the largest risk. Among the 331 individuals (10% of our sample) with the highest risk genotypes only 2 are controls and 329 are cases (see Fig. 5, top panel, for information on other genotype risk bands). Assuming a disease prevalence of 20% at age ~75, I predict that ~80% of individuals with genotypes in the top decile of risk will develop AMD, but <5% of individuals in the bottom 3 deciles will develop disease (see Fig. 5, bottom panel). Furthermore, I find that, among cases, individuals with high risk genotypes will present with severe disease more often (in the top risk decile for our sample, 15% of our cases have large drusen, 22% geographic atrophy and 63% have neovascularization) than individuals with lower risk genotypes (in the bottom risk decile, 51% of cases have large drusen, 19% geographic atrophy only and 30% have neovascularization). A productive strategy to identify rare alleles that impact disease susceptibility might involve a detailed
21
examination of DNA sequences in individuals with severe disease but whose common variant genotypes predict low disease risk.
Despite these encouraging contrasts between individuals with low and high risk genotypes, AMD susceptibility alleles must be evaluated in population-based cohorts before genotypes can become routine diagnostic tools [58]. While trends pointing to increased frequency of severe disease in individuals with high-risk genotypes should hold, the absolute risk of developing severe disease is difficult to estimate accurately in samples collected in tertiary clinics. In the meantime, our results point to new molecular pathways and encourage new directions in the search for treatment and prevention of this common blinding disease.
22
Table 2.1 Summary description of discovery samples used in the genome-wide association and replication studies
Cases Controls N Male (%) Age (Average) Large Drusen (%) Geographic Atrophy (%) Neovascular (%) N Male (%) Age (Average) Total Discovery Samples Michigan 786 36.9 79.8 14.2 21.6 64.2 516 41.5 76.6 1,302 Mayo Clinic 535 36.1 77.3 46.5 13.6 39.8 433 46.7 70.2 968
AREDS 440 41.0 80.8 none genotyped 26.8 73.2 0 0 0 440
Pennsylvania 396 40.4 75.7 42.7 26.3 31.0 201 45.3 76 597
Total 2,157 38.2 78.6 24.5 21.6 53.9 1,150 44.1 74.1 3,307 Parallel Discovery Samples
Tufts/MGH† 821 46.0 80.3 none genotyped 27.5 72.5 1,709 46.0 76.0 2,530
Replication Samples
Pittsburgh* 1,308 36.7 69.9 9.7* 18.9 70.0 229 49.8 76.7 1,537
Miami/Duke/Vanderbilt 1,157 35.1 75.7 28.3 13.6 58.2 514 40.5 68.4 1,671
Tufts/MGH II 868 40.0 79.7 none genotyped 28.3 71.7 789 40.0 73.0 1,657
Johns Hopkins* 665 32.8 75.5 21.8* 12.4 57.2 131 31.3 74.7 796
Penn-NJ 556 39.8 79.8 19.1 6.8 65.5 347 47.0 75.6 903
Oregon 515 34.0 79.8 none genotyped 27.2 72.8 263 45.0 74.0 778
Massachusetts E. E. I. 391 40.4 76.0 10.5 1.3 73.6 194 44.6 75.4 585
Spain (IDIS-Sgo) 353 46.2 76.7 none genotyped 16.1 83.9 282 44.7 75.1 635
Case Western Reserve 1,258 43.5 78.5 32.6 9.2 40.5 1,540 50.7 72.5 2,798
Total 7,071 41.1 76.2 14.9 14.0 65.8 4,289 45.5 73.0 11,360 Non-European
Samples
Japan 678 69.0 74.8 none genotyped 0.0 100.0 336 42.0 74.2 1,014
Grand Total* 10,727 40.9 77.0 15.7 16.6 64.0 7,484 45.3 73.9 18,211 *Proportions of cases with large drusen, geographic atrophy, and neovascular disease do not add up to 100.0% because 8.6% of cases from Johns Hopkins and 0.4% of cases from
23
Table 2.2 Confirmation of previously reported association signals in the discovery samples
Position (basepair) Notable Nearby Genes Alleles
Frequency (risk allele) OR p-value
SNP Chrom. (risk/non-risk) Cases Controls λsib
Primary Association Signals
rs10737680* 1 194,946,078 CFH A/C 0.801 0.566 3.11 (2.76, 3.51) 1.6 × 10-76 1.24
rs3793917* 10 124,209,265 ARMS2/HTRA1 G/C 0.371 0.164 3.40 (2.94, 3.94) 4.1 × 10-60 1.45
rs429608 6 32,038,441 C2/CFB G/A 0.920 0.842 2.16 (1.84, 2.53) 2.5 × 10⁻²¹ 1.05
rs2230199* 19 6,669,387 C3 C/G 0.224 0.163 1.74 (1.47, 2.06) 1.0 × 10⁻¹⁰ 1.06
rs2285714 4 110,858,259 CFI T/C 0.464 0.395 1.31 (1.18, 1.45) 3.4 × 10⁻⁷ 1.02
Secondary Association Signals
rs1329424* 1 194,912,799 CFH T/G 0.603 0.351 1.88 (1.68, 2.10) 6.4 × 10⁻¹⁶ 1.11
rs9380272* 6 32,013,989 C2/CFB A/G 0.016 0.012 4.31 (2.76, 6.87) 2.3 × 10⁻⁸ 1.12
Association peaks at previously reported loci. For two of these loci (near CFH and C2/CFB), I found significant secondary signals after adjusting for the strongest initial signal. At C2/CFB locus, rs9380272 shows no significant association before adjusting for the primary signal because its risk allele is in linkage disequilibrium with the protective allele at
rs429608. Conditioning on either of these two SNPs enhances the signal at the other SNP. The recurrence risk ratio λsib quantifies the increase in risk to siblings of affected
individuals attributable to a specific allele. For example, a λsib of 1.24 implies that alleles at the first locus are responsible for 24% increase in risk to siblings of AMD patients
24
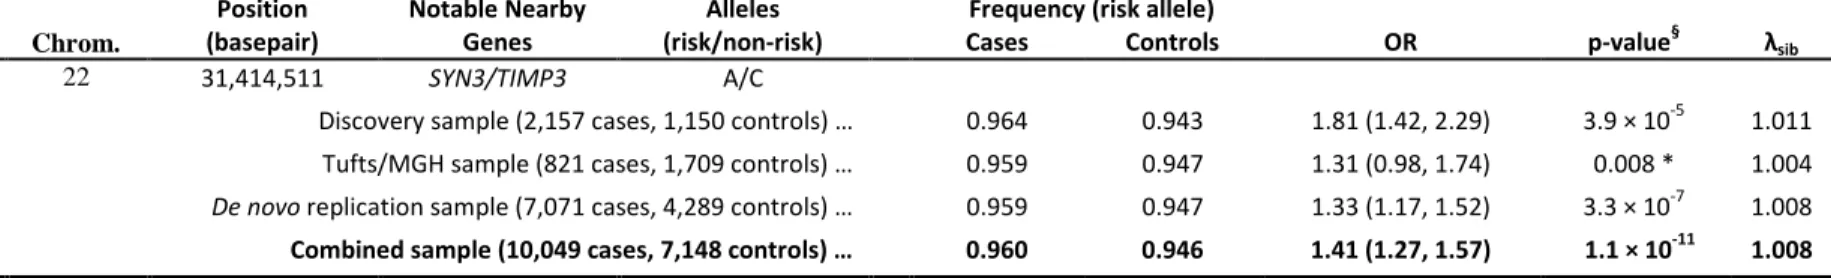
Table 2.3 New Locus with Confirmed Association to AMD (p < 5x10⁻⁸)
Position (basepair)
Notable Nearby Genes
Alleles Frequency (risk allele)
OR p-value§ λ sib
SNP Chrom. (risk/non-risk) Cases Controls rs9621532 22 31,414,511 SYN3/TIMP3 A/C
Discovery sample (2,157 cases, 1,150 controls) … 0.964 0.943 1.81 (1.42, 2.29) 3.9 × 10⁻⁵ 1.011
Tufts/MGH sample (821 cases, 1,709 controls) … 0.959 0.947 1.31 (0.98, 1.74) 0.008 * 1.004
De novo replication sample (7,071 cases, 4,289 controls) … 0.959 0.947 1.33 (1.17, 1.52) 3.3 × 10⁻⁷ 1.008
Combined sample (10,049 cases, 7,148 controls) … 0.960 0.946 1.41 (1.27, 1.57) 1.1 × 10⁻¹¹ 1.008
Cochran's Q Heterogeneity Test P-value = 0.245
This table summarizes results for a new confirmed association signal near TIMP3 (overall p < 5x10⁻⁸; corresponding to an adjustment for ~1 million independent tests). *Excluding overlapping AREDS samples in the Tufts/MGH study. §P-values for the discovery and combined samples are two sided. P-values for the Tufts/MGH and de novo replication samples are one sided.
25
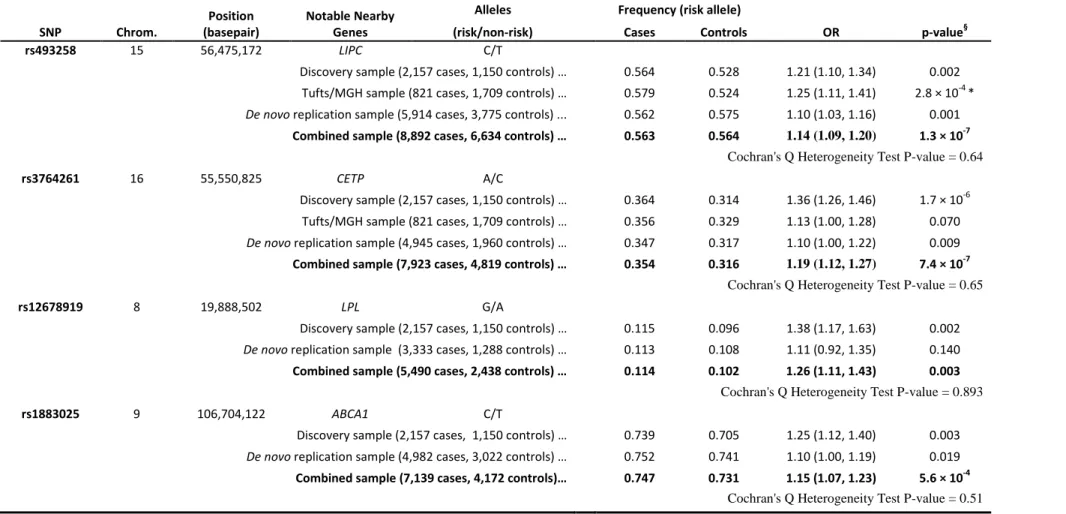
Table 2.4 Association of HDL-C loci with AMD
Position (basepair)
Notable Nearby Genes
Alleles Frequency (risk allele)
OR p-value§
SNP Chrom. (risk/non-risk) Cases Controls
rs493258 15 56,475,172 LIPC C/T
Discovery sample (2,157 cases, 1,150 controls) … 0.564 0.528 1.21 (1.10, 1.34) 0.002
Tufts/MGH sample (821 cases, 1,709 controls) … 0.579 0.524 1.25 (1.11, 1.41) 2.8 × 10⁻⁴*
De novo replication sample (5,914 cases, 3,775 controls) ... 0.562 0.575 1.10 (1.03, 1.16) 0.001
Combined sample (8,892 cases, 6,634 controls) … 0.563 0.564 1.14 (1.09, 1.20) 1.3 × 10⁻⁷ Cochran's Q Heterogeneity Test P-value = 0.64
rs3764261 16 55,550,825 CETP A/C
Discovery sample (2,157 cases, 1,150 controls) … 0.364 0.314 1.36 (1.26, 1.46) 1.7 × 10⁻⁶
Tufts/MGH sample (821 cases, 1,709 controls) … 0.356 0.329 1.13 (1.00, 1.28) 0.070
De novo replication sample (4,945 cases, 1,960 controls) … 0.347 0.317 1.10 (1.00, 1.22) 0.009
Combined sample (7,923 cases, 4,819 controls) … 0.354 0.316 1.19 (1.12, 1.27) 7.4 × 10⁻⁷ Cochran's Q Heterogeneity Test P-value = 0.65
rs12678919 8 19,888,502 LPL G/A
Discovery sample (2,157 cases, 1,150 controls) … 0.115 0.096 1.38 (1.17, 1.63) 0.002
De novo replication sample (3,333 cases, 1,288 controls) … 0.113 0.108 1.11 (0.92, 1.35) 0.140
Combined sample (5,490 cases, 2,438 controls) … 0.114 0.102 1.26 (1.11, 1.43) 0.003
Cochran's Q Heterogeneity Test P-value = 0.893
rs1883025 9 106,704,122 ABCA1 C/T
Discovery sample (2,157 cases, 1,150 controls) … 0.739 0.705 1.25 (1.12, 1.40) 0.003
De novo replication sample (4,982 cases, 3,022 controls) … 0.752 0.741 1.10 (1.00, 1.19) 0.019
Combined sample (7,139 cases, 4,172 controls)… 0.747 0.731 1.15 (1.07, 1.23) 5.6 × 10⁻⁴
Cochran's Q Heterogeneity Test P-value = 0.51
* Excluding overlapping AREDS samples in the Tufts/MGH study. Before excluding these samples, Tufts/MGH results differ slightly (for example, p-value at rs493258 was 2.2x10⁻⁵). §P-values for the discovery and combined samples are two sided. P-values for the Tufts/MGH and de novo replication samples are one sided.
26
Table 2.5 Association results of some published candidate SNPs in our scan
Gene SNP RiskAllele/Other
P-value In Original
Report Original Report
P-value in Discovery Sample P-value in Discovery Sample, After Adjusting For Known Loci
Direction Of Effect, Vs. Original Report TLR3 rs3775291 C/T 1.2 × 10⁻⁷ Yang Z et al. NEJM 2008 0.526 0.885 opposite TLR4 rs4986790 G/A 0.001 Zareparsi S et al. HMG 2005 0.552 0.091 same SERPING1 rs2511989 G/A 7.5 × 10⁻⁸ Ennis S et al. Lancet 2008 0.944 0.923 same ERCC6 rs3793784 G/C 0.020 Tuo J et al. PNAS 2005 0.961 0.480 same LRP6 rs7294695 C/G 0.020 Haines JL et al. IOVS 2006 0.543 0.867 same CX3CR1 rs3732378 A/G 0.002 Tuo J et al. FASEB J. 2004 0.150 0.100 same IL8 rs4073 T/A 0.037 Goverdhan SV et al. Br. J. Ophthalmol 2008 0.578 0.301 same VEGF rs2010963 C/G 0.020 Haines JL at al. Invest Ophthalmol Vis Sci. 2006 0.302 0.320 same VLDLR rs2290465 C/G 0.010 Haines JL at al. Invest Ophthalmol Vis Sci. 2006 0.782 0.402 same Previously associated SNPs near APOE and ABCA4 are not listed because they were not genotyped in our sample and could not be imputed confidently using either 1000 Genomes or HapMap reference haplotypes.
27
Table 2.6 Complete Results for All SNPs Where Replication Attempted
SNP Risk/ Nonrisk GWAS Tufts/MGH GWAS Tufts/MGH
Replication JHU Penn-NJ Oregon Spain IDIS MEEI Case Western Pitt Miami Duke
Vanderbilt Japan Combined rs9621532 A/C 3.9 × 10⁻⁵ 0.008 0.175 0.005 0.001 0.018 0.249 0.060 0.150 0.006 0.037 0.093 1.1 × 10⁻¹¹ rs493258 C/T 2.1 × 10⁻³ 0.0003 0.062 0.045 0.229 0.118 0.456 0.441 0.095 0.052 -- 0.101 1.3 × 10⁻⁷ rs3764261 A/C 1.7 × 10⁻⁶ 0.070 -- 0.866 0.153 0.114 0.126 0.166 -- 0.530 0.007 0.004 7.4 × 10⁻⁷ rs2958154 C/T 3.8 × 10⁻⁵ 0.475 -- -- -- -- -- 0.453 -- 0.950 0.039 -- 2.0 × 10⁻⁶ rs11878133 T/C 3.5 × 10⁻⁴ 0.002 -- -- -- -- -- 0.136 -- 0.531 0.091 -- 4.4 × 10⁻⁶ rs2142541 T/G 6.5 × 10⁻⁵ 0.035 -- -- -- -- -- 0.265 -- 0.459 0.044 -- 1.1 × 10⁻⁵ rs17628762 A/C 8.6 × 10⁻³ 0.0002 -- -- -- -- -- 0.080 -- 0.001 0.932 -- 2.4 × 10⁻⁵ rs6022766 A/C 1.5 × 10⁻² 0.0005 -- -- -- -- -- -- -- 0.439 0.073 -- 3.3 × 10⁻⁵ rs9973159 C/T 2.0 × 10⁻³ 0.010 0.485 -- -- 0.071 -- -- 0.095 0.453 0.071 -- 4.4 × 10⁻⁵ rs2127740 A/G 1.6 × 10⁻³ 0.493 -- -- -- -- -- 0.100 -- -- 0.361 -- 5.2 × 10⁻⁵ rs6484926 A/G 6.5 × 10⁻⁵ 0.012 0.053 0.495 -- 0.875 -- -- 0.060 0.385 0.520 -- 6.3 × 10⁻⁵ rs6982567 T/C 9.5 × 10⁻⁷ -- 0.060 0.162 -- 0.242 -- 0.375 0.100 0.047 0.845 -- 8.9 × 10⁻⁵ rs10103849 A/G 5.2 × 10⁻⁶ 0.003 -- 0.265 -- 0.649 -- -- 0.425 0.621 0.560 -- 1.7 × 10⁻⁴ rs 8052081 G/C 3.8 × 10⁻⁵ 0.024 -- -- -- -- -- -- -- 0.417 0.636 -- 2.0 × 10⁻⁴ rs655464 G/A 1.9 × 10⁻³ 0.004 -- -- -- -- -- -- -- 0.631 0.322 -- 2.7 × 10⁻⁴ rs13142235 A/G 6.9 × 10⁻⁵ 0.045 -- -- -- -- -- -- -- -- 0.675 -- 4.1 × 10⁻⁴ rs1884807 G/A 8.3 × 10⁻⁴ 0.002 -- -- -- 0.711 -- -- -- 0.113 0.923 -- 5.2 × 10⁻⁴ rs1883025 C/T 2.6 × 10⁻³ -- -- -- -- 0.020 0.119 0.798 0.135 0.109 0.429 -- 5.7 × 10⁻⁴ rs7737931 C/G 8.6 × 10⁻⁵ 0.055 -- -- -- -- -- -- -- 0.382 0.638 -- 6.5 × 10⁻⁴ rs12914520 T/C 1.3 × 10⁻³ 0.002 -- 0.050 -- 0.84 -- -- -- 0.466 0.714 -- 7.6 × 10⁻⁴ rs7704053 A/G 5.7 × 10⁻² 0.0001 -- -- -- -- -- -- -- 0.631 0.353 -- 7.7 × 10⁻⁴ rs17121872 A/G 1.3 × 10⁻⁴ 0.003 -- -- -- -- -- -- -- 0.908 0.825 -- 1.0 × 10⁻³ rs16848791 G/T 1.4 × 10⁻⁴ 0.006 0.343 0.139 -- 0.319 -- 0.841 0.305 0.834 0.549 -- 1.3 × 10⁻³ rs10468017 C/T 1.8 × 10⁻³ -- -- -- 0.170 0.105 0.671 0.365 -- 0.050 0.484 -- 1.5 × 10⁻³ rs12678919 G/A 1.8 × 10⁻³ -- -- -- -- 0.392 0.416 -- -- 0.243 0.193 0.334 3.2 × 10⁻³ rs12001032 T/C 8.5 × 10⁻⁴ 0.023 0.751 -- -- 0.302 -- -- -- 0.112 0.779 -- 5.4 × 10⁻³ rs2892715 G/A 8.5 × 10⁻⁶ 0.711 -- -- -- -- -- 0.872 -- 0.642 0.401 -- 2.0 × 10⁻² rs6445063 C/T 1.4 × 10⁻⁵ 0.814 -- -- -- -- -- -- -- 0.446 0.667 -- 2.8 × 10⁻²
28
Table 2.7 Sample by Sample Results for Newly Reported Loci PART 1/3
rs9621532 (A/C) near TIMP3
Cases Controls
OR P
A/A A/C C/C P(A) A/A A/C C/C P(A)
Discovery 2005 149 3 0.964 1022 125 3 0.943 1.81 (1.42, 2.29) 3.9 × 10⁻⁵ Tufts/MGH 732 62 4 0.957 1466 163 3 0.947 1.31 (0.98, 1.74) 0.016 Tufts/MGH II 777 69 4 0.955 703 75 1 0.951 1.09 (0.85, 1.51) 0.350 Johns Hopkins 626 37 1 0.971 113 16 0 0.938 2.21 (1.22, 4.03) 0.008 Penn-NJ 510 46 0 0.959 295 52 0 0.925 1.90 (1.26, 2.86) 0.002 Oregon 452 24 0 0.975 229 23 0 0.954 1.88 (1.05, 3.37) 0.036 Spain(IDIS-Sgo) 330 17 0 0.976 259 17 0 0.969 1.27 (0.64, 2.50) 0.498 Massachusetts E.E. I.** 345 39 0 0.949 163 26 1 0.926 1.49 (0.90, 2.46) 0.119 Case Western Reserve 1124 95 8 0.955 1370 147 3 0.950 1.12 (0.87, 1.44) 0.300 Pittsburgh** 169 10 0 0.972 130 10 1 0.957 1.55 (0.66, 3.63) 0.011 Miami/Duke/Vanderbilt** 629 69 4 0.945 218 30 1 0.936 1.18 (0.77, 1.81) 0.074
Japan 617 37 1 0.970 303 27 0 0.959 1.38 (0.84, 2.28) 0.195
Test of heterogeneity: Q d.f. p.value
29 PART 2/3 rs493258 (C/T) near LIPC Cases Controls C/C C/T T/T P( C) C/C C/T T/T P( C) OR P Discovery 691 1053 413 0.564 323 569 258 0.528 1.21 (1.10, 1.34) 0.002 Tufts/MGH 260 391 147 0.579 470 782 380 0.524 1.25 (1.11, 1.41) 0.001 Tufts/MGH II 254 428 172 0.548 213 387 182 0.520 1.12 (0.98, 1.29) 0.124 Johns Hopkins 203 315 119 0.566 35 58 33 0.508 1.26 (0.96, 1.66) 0.090 Penn-NJ 193 273 90 0.593 110 179 58 0.575 1.08 (0.89, 1.31) 0.458 Oregon 167 228 104 0.563 78 111 63 0.530 1.14 (0.92, 1.42) 0.235 Spain(IDIS-Sgo) 104 164 79 0.536 82 128 64 0.533 1.01 (0.81, 1.27) 0.911
Massachusetts E.E. I.** 128 159 88 0.553 52 88 35 0.549 1.02 (0.79, 1.31) 0.822
Case Western Reserve 366 595 217 0.563 404 726 300 0.536 1.12 (1.00, 1.24) 0.190
Pittsburgh** 66 70 39 0.577 52 64 35 0.556 1.09 (0.80, 1.49) 0.104 Miami/Duke/Vanderbilt** 222 337 131 0.566 65 149 31 0.569 0.99 (0.80, 1.21) --
Japan 35 200 408 0.210 10 102 217 0.185 1.17 (0.94, 1.46) 0.202
Test of heterogeneity: Q d.f. p.value
30
rs3764261 (A/C) near CETP
Cases Controls
A/A A/C C/C P(A) A/A A/C C/C P(A) OR P
Discovery 296 979 882 0.364 118 486 546 0.314 1.36 (1.26, 1.46) 1.7 × 10⁻⁶ Tufts/MGH 104 377 340 0.356 216 784 709 0.329 1.13 (1.00, 1.28) 0.140 Tufts/MGH II -- -- -- -- -- -- -- -- -- -- Johns Hopkins 87 293 261 0.364 24 50 48 0.402 0.85 (0.70, 1.04) 0.268 Penn-NJ 58 251 247 0.330 31 151 165 0.307 1.11 (0.96, 1.29) 0.306 Oregon 60 252 197 0.365 26 117 110 0.334 1.15 (0.98, 1.34) 0.227 Spain(IDIS-Sgo) 33 145 170 0.303 22 107 147 0.274 1.15 (0.97, 1.37) 0.252 Massachusetts E.E. I. ** 45 178 163 0.347 17 87 86 0.318 1.14 (0.95, 1.37) 0.332
Case Western Reserve -- -- -- -- -- -- -- -- -- --
Pittsburgh ** 24 77 69 0.368 18 55 70 0.318 1.25 (0.99, 1.58) 0.940
Miami/Duke/Vanderbilt ** -- -- -- -- -- -- -- -- -- --
Japan 31 228 395 0.222 17 80 236 0.171 1.39 (1.17, 1.65) 0.008
Test of heterogeneity: Q d.f. p.value
31
PART 3/3
rs12678919 (G/A) near LPL
Cases Controls
G/G G/A A/A P(G) G/G G/A A/A P(G) OR P*
Discovery 23 448 1686 0.115 9 206 939 0.097 1.38 (1.17, 1.63) 0.002 Tufts/MGH -- -- -- -- -- -- -- -- -- -- Tufts/MGH II -- -- -- -- -- -- -- -- -- -- Johns Hopkins -- -- -- -- -- -- -- -- -- -- Penn-NJ -- -- -- -- -- -- -- -- -- -- Oregon 6 85 416 0.096 2 42 208 0.091 1.06 (0.73, 1.53) 0.783 Spain(IDIS-Sgo) 2 81 162 0.173 5 63 149 0.168 1.04 (0.74, 1.46) 0.832 Massachusetts. E.E. I. ** -- -- -- -- -- -- -- -- -- --
Case Western Reserve -- -- -- -- -- -- -- -- -- --
Pittsburgh ** 1 32 141 0.098 1 21 127 0.077 1.30 (0.75, 2.27) 0.486 Miami/Duke/Vanderbilt ** 5 139 555 0.107 3 40 203 0.093 1.17 (0.83, 1.66) 0.385
Japan 10 141 496 0.124 6 64 253 0.118 1.06 (0.80, 1.42) 0.668
Test of heterogeneity: Q d.f. p.value
32
rs1883025 (G/A) near ABCA1
Cases Controls
G/G G/A A/A P(G) G/G G/A A/A P(G) OR P*
Discovery 1171 845 141 0.739 571 480 99 0.705 1.25 (1.12, 1.40) 0.003 Tufts/MGH -- -- -- -- -- -- -- -- -- -- Tufts/MGH II -- -- -- -- -- -- -- -- -- -- Johns Hopkins -- -- -- -- -- -- -- -- -- -- Penn-NJ -- -- -- -- -- -- -- -- -- -- Oregon 299 180 27 0.769 126 111 15 0.720 1.29 (1.01, 1.65) 0.039 Spain(IDIS-Sgo) 174 155 17 0.727 143 97 35 0.696 1.16 (0.91, 1.49) 0.238 Massachusetts. E.E. I. ** 205 138 42 0.712 98 79 10 0.735 0.89 (0.67, 1.17) 0.405
Case Western Reserve 713 418 67 0.770 821 563 77 0.755 1.09 (0.96, 1.23) 0.270
Pittsburgh ** 104 66 7 0.774 89 45 12 0.764 1.06 (0.73, 1.53) 0.318 Miami/Duke/Vanderbilt ** 378 275 47 0.736 130 98 20 0.722 1.08 (0.86, 1.36) 0.858
Japan -- -- -- -- -- -- -- -- -- --
Test of heterogeneity: Q d.f. p.value
4.25 5 0.5137
** Note that for datasets that include related individuals (Pittsburgh, Miami/Due/Vanderbilt and Massachusetts. E.E. I.), this samples counts include only unrelated individuals. Thus, the results differ from those in Table 3 in the main paper where all available samples were analyzed using the method of Thornton and McPeek. The tabulated p-values are calculated from the complete family data set. P values are two sided.
33
Table 2.8 Best genotyped proxy SNPs for reported loci
SNP Chrom Position Gene P-value
at Imputed SNP Best Genotyped Proxy Allele1/ Allele2 Cases 1/1 1/2 2/2 Controls 1/1 1/2 2/2 Rsq P-value at Genotyped SNP* rs10737680 1 194,946,078 CFH 1.6 × 10-76 rs1329428 A/G 86/685/1384 214/571/365 1.00 5.2 × 10-76 rs3793917 10 124,209,265 ARMS2/HTRA1 4.1 × 10-60 rs6585827 G/A 377/993/782 335/557/256 0.32 7.5 × 10⁻²² rs429608 6 32,038,441 C2/CFB 2.5 × 10⁻²¹ rs429608 A/G 18/311/1827 27/311/812 1.00 2.5 × 10⁻²¹ rs2230199 19 6,669,387 C3 1.0 × 10⁻¹⁰ rs2250656 G/A 139/775/1243 107/491/552 0.08 1.3 × 10⁻⁷ rs2285714 4 110,858,259 CFI 3.4 × 10⁻⁷ rs2285714 T/C 462/1076/617 187/534/429 1.00 3.4 × 10⁻⁷ rs1329424 1 194,912,799 CFH 6.4 × 10⁻¹⁶ rs2019724 G/A 271/998/886 432/546/172 0.79 1.3 × 10⁻¹⁴ rs9380272 6 32,013,989 C2/CFB 2.3 × 10⁻⁸ rs9332702 G/C 0/67/2089 0/27/1123 0.50 1.1 × 10⁻⁷ rs9621532 22 31,414,511 SYN3/TIMP3 3.9 × 10⁻⁵ rs135150 C/T 45/519/1592 32/330/787 0.14 0.001 rs493258 15 56,475,172 LIPC 2.1 × 10⁻³ rs1532085 A/G 255/949/951 179/509/462 0.64 0.002 rs3764261 16 55,550,825 CETP 1.4 × 10⁻⁶ rs3764261 T/G 296/979/882 118/485/546 1.00 1.4 × 10⁻⁶
*The second cluster is conditional on the five SNPs in the first cluster. The third cluster is conditional on the 7 SNPs above. Marginally, the SNPs in second cluster are not significant.
34
Table 2.9 Association Results in Discovery Sample for Different Analysis Models
Analysis Covariates SNP Notable Nearby Genes None Principal Components of Ancestry (PCA)
PCA and Index SNPs at Previous Loci
PCA, Previous Loci Age and Sex
rs10737680 CFH 2.5 × 10-78 1.6 × 10-76 -- -- rs3793917 ARMS2 1.7 × 10-60 4.1 × 10-60 -- -- rs429608 C2/CFB 4.7 × 10⁻²¹ 2.5 × 10⁻²¹ -- -- rs2230199 C3 3.6 × 10⁻¹¹ 1.0 × 10⁻¹⁰ -- -- rs2285714 CFI 8.0 × 10⁻⁸ 3.4 × 10⁻⁷ -- -- rs9621532 TIMP3 5.9 × 10⁻⁵ 2.6 × 10⁻⁴ 4.5 × 10⁻⁵ 7.1 × 10⁻⁴ rs493258 LIPC 5.1 × 10⁻³ 6.9 × 10⁻³ 3.6 × 10⁻³ 1.1 × 10⁻² rs3764261 CETP 5.8 × 10⁻⁵ 1.2 × 10⁻⁴ 4.6 × 10⁻⁶ 9.5 × 10⁻⁶ rs12678919 LPL 1.7 × 10⁻² 2.0 × 10⁻² 4.0 × 10⁻³ 2.9 × 10⁻³ rs1883025 ABCA1 3.4 × 10⁻³ 6.4 × 10⁻³ 5.2 × 10⁻³ 4.9 × 10⁻³
35
Table 2.10 Evaluation of Association of Loci with p < 5x10⁻⁸ Overall In Specific AMD Subtypes (OR, 95 C.I., p-value)
rs10737680 (CFH) rs3793917 (ARMS2) rs429608 (C2/CFB) rs2230199 (C3) rs2285714 (CFI) rs9621532 (TIMP3) Alleles (A/C) Alleles (G/C) Alleles (G/A) Alleles (C/G) Alleles (T/C) Alleles (T/C)
Large Drusen (529) vs Control (1150)
2.69 (2.27,3.20) 2.36 (1.94,2.87) 2.03 (1.59,2.59) 1.66 (1.32,2.08) 1.26 (1.08,1.45) 1.47 (1.03,2.12) 2.2 × 10⁻²⁹ 4.4 × 10⁻²⁶ 1.8 × 10⁻⁸ 1.2 × 10⁻⁵ 2.3 × 10⁻³ 0.03 GA (465) vs Control (1150) 3.85 (3.15,4.71) 3.68 (3.07,4.42) 2.46 (1.95,3.10) 2.00 (1.62,2.46) 1.38 (1.21,1.57) 1.31 (0.91,1.88) 1.0 × 10-39 1.7 × 10-44 2.0 × 10⁻¹⁴ 6.3 × 10⁻¹¹ 1.4 × 10⁻⁶ 0.14 Neovascular (1163) vs Control (1150) 3.15 (2.73,3.63) 4.28 (3.63,5.04) 2.16 (1.79,2.61) 1.67 (1.38,2.00) 1.34 (1.19,1.50) 1.91 (1.42,1.91) 1.4 × 10-57 1.1 × 10-66 1.3 × 10⁻¹⁵ 7.9 × 10⁻⁸ 1.3 × 10⁻⁶ 1.9 × 10⁻⁵ GA (465) vs Large Drusen (529) 1.38 (1.11,1.73) 1.26 (1.02,1.55) 1.12 (0.81,1.55) 1.22 (0.93,1.60) 1.09 (0.91,1.30) 1.12 (0.72,1.73) 4.3 × 10⁻³ 0.032 0.48 0.15 0.36 0.62
Neovascular (1163) vs Large Drusen (529) 1.13 (0.95,1.35) 1.79 (1.50,2.13) 1.07 (0.83,1.39) 0.99 (0.80,1.24) 1.06 (0.92,1.23) 1.30 (0.88,1.92) 0.16 4.3 × 10⁻¹¹ 0.59 0.95 0.43 0.19 Neovascular (888) vs GA (465) 0.76 (0.61,0.93) 1.36 (1.13,1.63) 0.90 (0.67,1.20) 0.78 (0.62,1.00) 0.95 (0.81,1.12) 1.39 (0.93,1.39) 0.009 0.0009 0.47 0.046 0.54 0.11
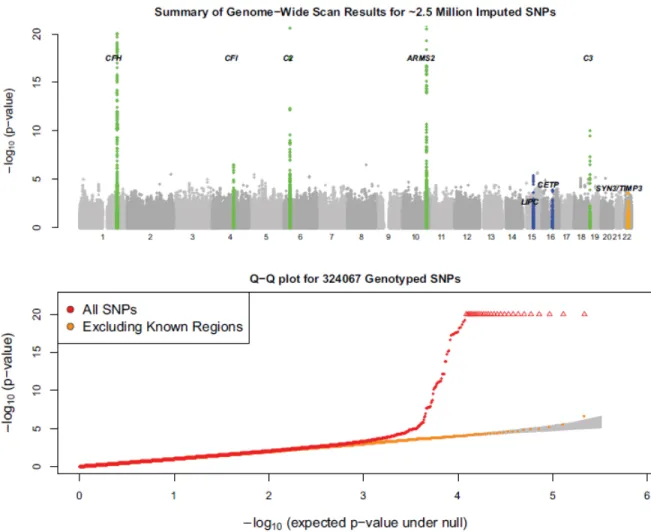
Figure 2.1 Summary of genomewide association scan results
The top panel summarizes the significance of the association signal at each examined SNP in the discovery samples.
The five known loci are highlighted in green. The three strongest loci after follow (TIMP3, LIPC, CETP) are
highlighted in blue. The bottom panel displays a quantile-quantile plot for test statistics. The shaded region in the bottom panel corresponds to a 90% confidence interval for the test statistics.
37
Figure 2.2 Regional plots for association signals in five previously reported loci
Detailed plots of association in the discovery samples in five confirmed regions (CFH, ARMS, C2/CFB, C3 and CFI)
are shown. The most significant SNP in each region is highlighted in a red square and other SNPs are drawn as colored circles reflecting linkage disequilibrium (LD) with the top selected SNP. Exons and transcript direction for genes in each region are indicated in bottom panel.
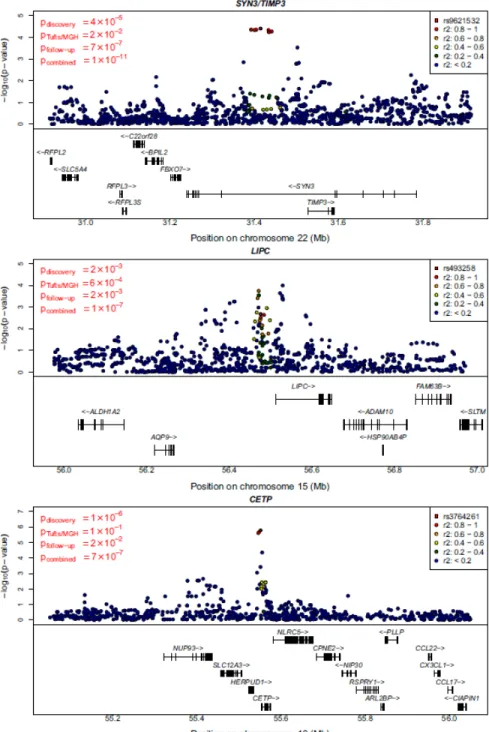
Figure 2.3 Regional plot for association signals in the three new loci
Detail plots for the regions surrounding the SYN3/TIMP3, LIPC and CETP regions. Original, follow-up, and combined
p-values for the SNP selected for replication are indicated on the left. Discovery sample p-values for the index SNP and other nearby SNPs are plotted.
39
Figure 2.4 Regional plot of association signals in HDL-c and AMD
Detailed plots comparing HDL-cholesterol association signals (from the discovery sample of Kathiresan et al27; left column) and AMD association signals (from the discovery sample in the scan reported here; right column). The same marker and linkage disequilibrium proxies are highlighted in each row.
Figure 2.5 Multi-locus genotypes and disease risk
The top panel summarizes the proportion of affected individuals in each risk decile, with the highest risk decile on the left, when our sample is segregated according to the risk of disease predicted by a simple logistic regression model. The bottom panel makes equivalent predictions at the population level, after weighting cases and controls to take into account that our sample is enriched for cases (see methods for details).
41
Chapter 3
Graphical Browser for GWAS with High-dimensional Phenotypes
The content of this chapter has been published in Chen et al. 2009 [59].
3.1 Introduction
Recently, genome wide association scans (GWAS) have been used to successfully dissect a variety of complex traits, ranging from discrete clinical outcomes such as asthma and diabetes [60-62] to continuous traits as diverse as height, weight, global gene expression and blood lipid levels [63, 64]. The amount of informa