Capturing and Analyzing the Web Experience
Jeffrey Heer
PARC (Palo Alto Research Center)
3333 Coyote Hill Road
Palo Alto, CA 94304
[email protected]
AbstractThe rapid expansion of the web has made it increasingly important to develop scalable tools for understanding web behavior and identifying usability issues on sites. Research in recent years has explored different methods of capturing and analyzing web usage data for these purposes. In this article we explore two approaches we have developed for capturing web usage data, and highlight two analysis sys-tems that use web usage data to make sense of user activity and determine the goals of web users.
Keywords
Web usability, web logging, web usage, automated analy-sis, visualization, remote usability testing, web mining INTRODUCTION
As the Web continues to engrain itself into the fabric of our society, it becomes increasingly important to under-stand the activities and goals of users and build usable sites that help users achieve these goals. Making sense of the activities of millions of users is an impossible task for an unaided analyst, and so automated means of analyzing web usage data are becoming increasingly popular. Addition-ally, it can be quite difficult to collect accurate and detailed web usage data in the numbers sufficient to determine sig-nificant usage trends and site design problems. As a conse-quence, remote usability testing is becoming more popular as an affordable and scalable means for evaluating the us-ability of sites.
This article describes a number of emerging systems that seek to tackle these issues through the automatic capture, representation, and analysis of user behavior. First we ex-plore two different approaches developed for automatically capturing web usage data and examine the tradeoffs in-volved with each. Next we turn to automated and semi-automated analysis tools for understanding users’ surfing actions and inferring the user goals. The goal of such sys-tems is to provide accurate, automated tools that can scale with the growth of the Web, enabling us to understand user behavior and build a more usable web.
CAPTURING WEB USAGE
Over the last few years we have developed systems at both UC Berkeley and PARC for capturing web usage at a higher level of detail than that provided by web server logs. These tools can be used as adjuncts to standard usability testing or to conduct remote usability evaluations. We first
introduce WebQuilt, a proxy-based approach to logging user interactions. Next we describe WebLogger, a client-side application which captures a rich array of data. WebQuilt
WebQuilt is a system we developed at UC Berkeley for conducting remote usability evaluations and logging the resulting clickstreams [6]. What is unique about WebQuilt is its proxy-based approach to web usability logging. It doesn’t require users to download and run special software nor does it require web masters to instrument their servers. It can be deployed on any site, or across sites, allowing analysts to run evaluations on any subset of the web that they choose, regardless of who owns the sites in question. The proxy-based approach also allows any client web browser to be used, including those on handheld devices and cellular phones. Furthermore, WebQuilt doesn’t func-tion like a standard web proxy that requires configuring the client browser. The end result is that WebQuilt is easy for usability professionals to deploy and easy for participants to use.
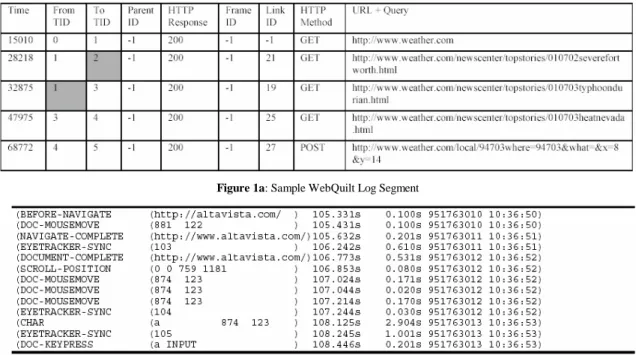
WebQuilt works by encoding the necessary information within URLs. When a page is requested by a client, Web-Quilt retrieves the page and dynamically rewrites all the links to point back through the proxy before passing the page on to the client. The rewritten URLs contain other useful data, such as an identifier for the current page and individual identifiers for each page link. WebQuilt logs each transaction as it occurs, recording the times, referring pages, links traversed, HTTP methods used, URLs, and any query data (see Figure 1a below for an example of the WebQuilt log format). Additionally, WebQuilt caches each page the user sees, leaving a record of the viewed content. This allows the system to later reconstruct the sessions for analysis purposes, such as that performed by WebQuilt’s visualization front-end, discussed later in the paper. During the implementation of the WebQuilt logger we ran into a number of issues. As the proxy itself must retrieve all the pages a user requests, it must be able to handle all the intricacies of the web. This includes encryption (SSL) support, cookie management, and browser scripting lan-guages (e.g. JavaScript). While we were able to tackle the first two problems, the use of scripting languages can cause a number of complications. It is not uncommon for lan-guages such as JavaScript to dynamically write hyperlinks into the webpage. Since these links aren’t created until the
page is loaded by the client, the links do not point back to the proxy, creating the opportunity for “runaway” sessions. While a number of heuristics and/or site-dependent hacks can be employed to ameliorate the problem, there does not seem to be a complete, general solution short of including a full script parser into the system. Some scripting languages (or language subsets), however, are browser dependent, further complicating the issue.
Another issue is that analysts may want to capture more data than WebQuilt currently supports. Page scrolling, mouse movements and clicks, window resizes and other low level events are not currently captured. While it may be possible to capture these events by inserting browser-specific scripting code into the proxied pages (see [3]) we have yet to see if this is a truly viable option.
WebLogger and WebLogger-Remote
Another tool for capturing web usage data is WebLogger, a client-side browser monitoring system. Developed at PARC, WebLogger was originally intended as both a stand-alone logging tool and as a component of an inte-grated web eye-tracking system [7]. We have since further developed the system to support remote usability testing. WebLogger is an application for Microsoft Windows™ that launches an instance of the Internet Explorer browser and monitors and logs user events by using the Component Object Model (COM) and Windows Event hooks. In addi-tion to standard web log informaaddi-tion such as viewing times and requested URLs, WebLogger captures a rich set of low-level interaction data such as window resizes, scrolling events, keystrokes, and mouse movements. The WebLog-ger log format is illustrated in Figure 1b. Pages viewed by users were also cached for later analysis. Since WebLogger uses the Internet Explorer browser, it need not concern itself with many of the intricacies of the web. Secure
com-munication, session management, and scripting languages are all handled by the browser. The caveat is that testing is confined to a single platform and a single browser.
Earlier work at PARC used WebLogger in conjunction with another program named WebEyeMapper. This pro-gram maps screen co-ordinates to actual page features such as text segments and interface widgets. It then combines this analysis with eye-tracking data to analyze user surfing patterns. Components of this system were used by Card et al to perform web protocol analysis and automatically gen-erate Web Behavior Graphs [1].
Previously confined to the laboratory, WebLogger has re-cently been extended to support remote usability evalua-tions [8]. The augmented system, named WebLogger-Remote, is sent to an evaluation participant who must then run the program on their own machine. WebLogger-Remote then presents them with tasks, and logs the user’s actions. The user log is stored in an encrypted format, pre-venting the user’s data from being used for unintended purposes.
Once a task has been completed, WebLogger-Remote sends the resulting encrypted log back to a central server and removes the log from the client machine. As a large number of users still connect to the Internet using modems, and we do not want to tie up their bandwidth, WebLogger-Remote doesn’t cache the pages users visit, as sending these pages back to the central server may be too costly. Instead the central server, upon receiving a session log, immediately retrieves the individual URLs viewed and saves its own cached copies. While there are a few cases where this approach may be inaccurate (e.g. if the user visited a site for which they already had some cookie-controlled personalization), we feel it is preferable to in-conveniencing test participants.
Figure 1a: Sample WebQuilt Log Segment
Although WebLogger-Remote has the drawback that users must download and run the application to participate in a study, it still has a large number of advantages. First, the client-side approach carries no risk of “runaway” sessions; the user can’t inadvertently leave the domain of the logging tool. Second, by employing the Internet Explorer browser, the logging software doesn’t have to focus on re-implementing or working around the messy world of web technologies. Finally, the rich set of data captured allows for analyses other server and proxy-based approaches don’t currently allow. Browsing sessions can be reproduced ex-actly, capturing the appearance of the browser as the user surfed. This can be useful for discovering important details such as what information on the page was “below-the-fold,” and thus required scrolling to view.
Web Capture Summary
As we’ve seen, there are a number of approaches to captur-ing user surfcaptur-ing activity, rangcaptur-ing from common server logs to proxy-based and client-side logging. Given the advan-tages and drawbacks associated with each, the method used should be dictated by the tasks and resources at hand. For example, a proxy-based approach may be faster and easier to deploy when the required information consists only of URLs, viewing times, and links traversed, or if the evalua-tion spans a number of platforms or devices. However, to validate complex mental models of user activity the rich set of data provided by client-side logging may be necessary. ANALYZING WEB USAGE
In this section we describe two systems we have developed for analyzing web usage data after it has been captured. The first system is the visualization component of the WebQuilt project, which visualizes user surfing activity recorded from a usability test. The second system is the LumberJack service, which given web usage logs will infer the major groupings of user activity on a site.
The WebQuilt Visualization System
After successfully collecting web user activity data for a usability evaluation, there still remains the daunting task of making sense of the user actions. This is especially true of remote usability evaluations, where much larger numbers of subjects can participate. Since manually sifting through text logs is neither feasible nor enjoyable, we sought to bring the power of information visualization to bear on the problem.
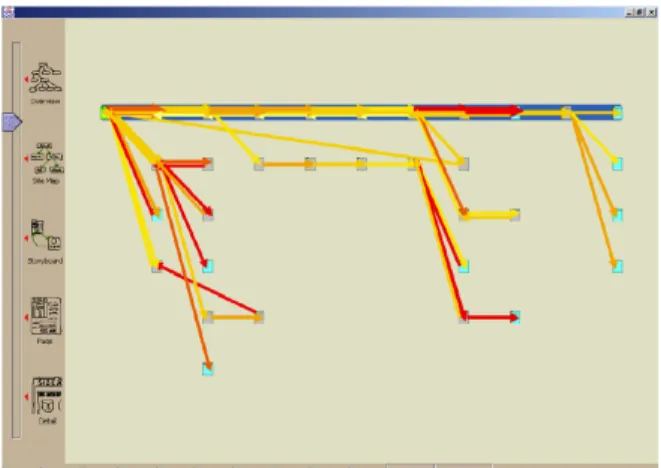
The result is the visualization component of the WebQuilt system, which aggregates the data from evaluation partici-pants and visualizes their activity as a graph [9]. A sample visualization is depicted in Figure 2. The nodes of the graph represent visited web pages and the arrows represent traversed hyperlinks. The nodes are color coded to indicate if a web page is a start page, exit page, or neither. The ar-rows are color coded to indicate the average time spent on the page before traversing the link. Furthermore, the arrow
thickness is used to convey the amount of traffic that went through the link. Designers can also optionally specify an “optimal path” for the current task, which is indicated by thick blue highlighting.
The visualization also supports semantic zooming, allow-ing analysts to look more closely at a specific area of user activity. When zoomed in, the graph nodes are replaced by actual page thumbnails, and the traversed link arrows will originate from the corresponding link in the thumbnail. Additionally, the interface supports filtering operations that allow an analyst to select which user sessions to display. This could theoretically be used to filter on any number of recorded criteria, including task completion status and user demographics.
Future work for the system might include more in-depth automated analyses of the user paths. Employing heuristics consistent with empirical observation, the system could suggest to the analyst possible “problem areas” where us-ers might have encountered difficulties. Some possible examples include hub-and-spoke surfing (“ping-ponging”), suggesting the user can’t find what she is looking for and/or doesn’t have a specific information goal, and surf-ing paths that dive into a site and then backtrack heavily, illustrating possible navigational problems. The end goal would be to add more automation to the system to facilitate the process of usability analysis.
The LumberJack Log Analyzer
At PARC we’ve developed an automated web usage analy-sis tool, which, given records of user interaction with a web site, groups the various extracted user sessions into com-mon activities such as “product browsing” and “job seek-ing” [4]. We’ve then used this tool to build a new, auto-mated web analysis service named LumberJack.
The system works by first extracting individual user ses-sions from web logs. Currently the system can use both standard web server logs and WebQuilt proxy logs. The system then crawls the site to be analyzed, and constructs a multi-featured vector space model of the website using the page content, URLs, and hyperlink topology of the site.
User profiles are then created by combining the web site model with the user sessions, using data such as a user’s page viewing time to weight the different documents in a user’s surfing path. Finally, these profiles are submitted to a clustering algorithm that groups the sessions into (hope-fully) meaningful aggregates.
We recently performed a systematic evaluation of different clustering schemes by conducting a user study where we asked users to surf a large corporate site with a priori specified tasks [5]. The WebQuilt proxy was used to re-cord user sessions remotely, allowing users to perform the tasks more naturally and on their own time. By knowing what the tasks were and how they should be grouped in advance, we were able to do post-hoc analysis of the effec-tiveness of different clustering schemes. We discovered that, by counting the number of correct categorizations, certain combinations of data features enabled us to obtain accuracies of up to 99%! Thus by using remote testing tools, we were able to validate our clustering data model of user activity.
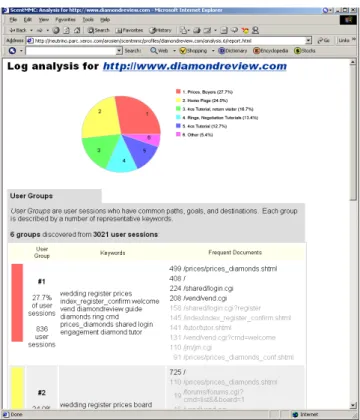
Encouraged by our successful evaluation, we have devel-oped a new service called LumberJack that, given a web server log, automatically crawls the content and hyperlinks of the site and uses this information in conjunction with the user traces obtained from the server logs to discover the user’s information needs. This system is a push-button operation, in that only the server logs are needed, and the rest of the system runs completely automatically. Figure 3 shows a screenshot of the report generated for a consumer information Web site on diamonds.
For DiamondReview.com, LumberJack discovered six user groups in 3021 user sessions for 4 days starting from Jan. 4, 2002. 27.7% of the users were buyers interested in prices, while 24.0% spent most of their time on the home page. 16.7% were return visitors going through a diamond tutorial, and we know this because they had obviously started the tutorial from a half-way point that they have bookmarked. 13.4% were ring buyers, and 12.7% were first time tutorial readers. The remaining 5.4% were users that looked at many different pieces of information.
CONCLUSION
In this article we described a collection of web usage log-ging approaches and subsequent analysis techniques de-signed to facilitate our understanding of web user behavior. By allowing the automatic capture and analysis of web usage data, such tools carry the promise of affordable, real-istic usability analysis and user understanding. The explo-sive growth of the web and the prohibitive time and re-source costs of traditional usability engineering mean such automated tools are not merely attractive, but urgently needed.
Still, there is much progress to be made before true auto-mated usability tests can be a reality. As autoauto-mated analy-sis techniques proliferate, analysts will likely want to use a
number of different tools and metrics. To this end, it will be quite useful that captured web usage, regardless of how it is gathered, be represented in an accessible format that supports much, if not all, of the information that research-ers and analysts will want to apply, and yet is interchange-able across a range of tools. A standard format (perhaps XML based?) for web usability logging could help alleviate such concerns.
Furthermore, to develop tools which can help human ana-lysts pinpoint real web usability problems, it may be neces-sary to research the existing body of usability engineering knowledge to look for empirically observed indicators of poor usability and/or user confusion (possibly including ping-ponging, backtracking, and excessive viewing times). Equipped with a taxonomy of such indicators, we can then set about the task of determining how such indicators might be algorithmically identified. Alternatively, web us-age data collection tools, which allow for meta-data such as task description, task success, and other criteria to be known in addition to raw usage data, can be used to vali-date independent theories and models of human activity, as we did in [5], and as we plan to do for the Information Scent-based methods for usability analysis described in [2]. While automated tools for understanding user activity and identifying usability problems may never capture all the nuances of standard usability analysis techniques, they offer an avenue for bringing human-centered design and greater usability to a larger segment of the web. It is im-perative that we develop these tools to make this possibility a reality.
BIO: Jeffrey Heer is a research scientist at Palo Alto Research Center’s User Interface Research Group, with interests spanning Human-Computer Interaction, Computer Systems, and Cognitive Science. His current and previous research projects have explored Remote Usability Testing, Automated Web Usability Analysis, Information Visualization, and Visual Attention. Jeff received his Bachelors of Science in Electrical Engineering and Computer Sci-ence (1997-2001) from the University of California, Berkeley. While not actively researching, Jeff enjoys playing the guitar, hik-ing, readhik-ing, and traveling.
ACKNOWLEDGEMENT
The work described in this paper could not have been done with-out the hard work and collaboration of Ed Chi, Peter Pirolli, Adam Rosien, Rob Reeder, and Christiaan Royer at PARC, and Jason Hong, Sarah Waterson, Tim Sohn, Tara Matthews, and James Landay at UC Berkeley. Work done at PARC was supported in part by Office of Naval Research grant No. N00014-96-C-0097 to Peter Pirolli and Stuart Card.
REFERENCES
[1] Card, S.K., Pirolli, P., Van Der Wege, M., Morrison, J., Reeder, R.W., Schraedley, P., and Boshart, J. (2001). Infor-mation Scent as a Driver of Web Behavior Graphs: Results of a Protocol Analysis Method for Web Usability. In Proc. of the ACM Conference on Human Factors in Computing Sys-tems, CHI 2001, Seattle, WA.
[2] Chi, E.H., Pirolli, P., Chen, K., and Pitkow, J. (2001). Using information scent to model user information needs and ac-tions on the Web. In Proc. of the ACM Conference on Hu-man Factors in Computing Systems, CHI 2001, Seattle, WA.
[3] Edmonds, A. (2001) The Lucidity Project. See http://sourceforge.net/projects/lucidity/
[4] Heer, J. and Chi, E.H. (2001). Identification of Web User Traffic Composition using Multi-Modal Clustering and In-formation Scent, in Proc. of the Workshop on Web Mining, SIAM Conference on Data Mining, Chicago, IL.
[5] Heer, J. and Chi, E.H. (2002) Separating the Swarm: Catego-rization Methods for User Sessions on the Web. To appear in Proceedings of the Conference on Human Factors in Com-puting Systems.
[6] Hong, J.I., Heer, J., Waterson, S., and Landay, J.A. (2001). WebQuilt: A Proxy-based Approach to Remote Web Usabil-ity Testing. To appear in ACM Transactions on Information Systems.
[7] Reeder, R.W., Pirolli, P. and Card, S.K. (2001). WebEye-Mapper and WebLogger: Tools for Analyzing Eye Tracking Data Collected in Web-use Studies. In Proc. of the ACM Conference on Human Factors in Computing Systems, CHI 2001, Seattle, WA.
[8] Royer, C. (2002). WebLogger-Remote. Personal Communi-cation.
[9] Waterson, S., Hong, J.I., Sohn, T., Heer, J., Matthews, T., and Landay, J.A. (2002). What Did They Do? Understanding Clickstreams with the WebQuilt Visualization System. Sub-mitted to AVI 2002, Conference on Advanced Visual Inter-faces, Trento, Italy.