PREFACE
This overview of the water resources availability and utilisation in the Berg water management area, is one of a series of similar reports covering all 19 water management areas in the country, and results directly from work performed in preparation of the First Edition National Water Resource Strategy, which is to be published in its final form during 2003. It is further complemented by a report giving a national perspective on the water resources of the country. The information contained in this series of reports, reflects the combined efforts and contributions by a wide spectrum of people. Most of the data follow from water resource situation assessments with respect to each of the water management areas as well as from demographic, economic, environmental and other related studies, which were performed under assignment of the Department of Water Affairs and Forestry. The reports also summarise the knowledge and insights gained through a series of workshops (several per water management area) conducted during the years 2000 and 2001, in which strategic perspectives were developed with respect to the reconciliation of requirements for and availability of water, then and into the future.
It is the objective of the report to, in a non-technical style, provide an overview of the current and expected future water resources situation in the Berg water management area, highlight the key issues of relevance and provide broad strategies with regards to the management of water resources in the water management area. Although an internal document by the Department of Water Affairs and Forestry, it should also serve as valuable background to officials from other government departments and institutions, members of catchment management agencies and water user associations, regional and local authorities, consultants and others.
It is important to note that the information, strategies and priorities given are not static. All relate to a certain point in time, and should be regularly reviewed in future as improved information becomes available and to adjust to changing circumstances. Greater technical detail can be obtained from the documentation referenced.
Invaluable contributions to the contents of the water management area reports were made by several individuals and through the combined knowledge and wisdom of many others. Only a few can be named here, and this note serves as a rather incomplete recognition to them and our other professional colleagues for what they have done and for what the authors have learned from them.
- Mr Johan van Rooyen, Manager : National Water Resource Planning, for his guidance, support and many original ideas and perspectives.
- Mr Frans Stoffberg, Project Manager for Department of Water Affairs and Forestry, for his commitment, co-operation and wisdom on many matters.
- The Chief Engineers : National Water Resource Planning: Beyers Havenga, Niel van Wyk, Seef Rademeyer and Frans Stoffberg, for sharing their intimate knowledge of the water management areas and editing of the reports.
- Officials from the Regional Offices and of the other Directorates of the Department of Water Affairs and Forestry for the priority which they afforded this work, their supportive co-operation and valuable contributions.
- Consultants to the Department of Water Affairs and Forestry on work related to this assignment, for sharing of information, participation in workshops and unconditional support to the BKS project team.
- Colleagues in BKS who directly contributed to the work, or who may have been inconvenienced through the priorities given to the National Water Resource Strategy; particularly the graphics, GIS, secretarial and word processing staff for their professional assistance.
BERG
WATER MANAGEMENT AREA
OVERVIEW OF WATER RESOURCES AVAILABILITY AND UTILISATION TABLE OF CONTENTS
1. GENERAL DESCRIPTION OF WATER MANAGEMENT AREA ... 1
1.1 Natural characteristics... 1
1.2 Development ... 4
1.3 International ... 4
1.4 Sub-areas... 4
2. NATIONAL PERSPECTIVE ... 7
3. ECONOMIC ACTIVITY AND POPULATION ... 9
3.1 Regional Economy ... 9
3.2 Demography... 11
4. WATER REQUIREMENTS... 13
4.1 Current requirements (year 2000)... 13
4.2 Future requirements... 15
5. WATER RESOURCES... 17
5.1 Surface Water ... 17
5.2 Groundwater ... 19
5.3 Summary... 19
6. RECONCILIATION OF REQUIREMENTS AND AVAILABILITY ... 22
6.1 Water Balance... 22
6.2 Key issues... 26
6.3 Strategic perspectives... 26
6.4 Transfers and reservation of water ... 28
APPENDICES
Appendix 1 : Urban water requirements (year 2000)
Appendix 2 : Rural water requirements (year 2000)
Appendix 3 : Irrigation water requirements (year 2000)
Appendix 4 : Factors influencing runoff and yield (year 2000)
Appendix 5 : Major dams data
Appendix 6 : Details of main transfers (year 2000)
ADDENDA
Addendum 1 : Background on demographic and economic studies
Addendum 2 : Economic sector description (for GGP and labour distribution)
Addendum 3 : Yield, reliability, available water and assurance of supply
Addendum 4 : Ecological component of Reserve
Addendum 5 : Reconciliation interventions
Addendum 6 : Priorities for allocating water
Berg WMA Final: 19 September, 2003
BERG WATER MANAGEMENT AREA
OVERVIEW OF WATER RESOURCES AVAILABILITY AND UTILISATION
1. GENERAL DESCRIPTION OF WATER MANAGEMENT AREA
1.1 Natural characteristics
The Berg water management area is located in the Western Cape Province where it commands the south western corner of South Africa. It borders on the Atlantic Ocean to the south and west, and adjoins the Breede water management area to the east and the Olifants/Doring water management area to the north-east. Although the smallest water management area in the country, it is characterised by diverse topographical, climatic and land-use features. Rugged mountains of the Table Mountain Group sandstone formations occur in the east and south-east of the water management area. Table Mountain and the Cape Peninsula mountain chain mark the south-west of the water management area, with Kasteelberg and Piketberg to the north as remote sandstone outcrops. Sand dune areas and sandy soils, mainly underlain by shale formations, extend across the Cape Flats and along the West Coast. Refer to Figure 1 for the location and general layout of the water management area.
The entire Berg water management area lies within the winter rainfall region with the mean annual rainfall ranging from more than 3 000 mm in the high lying areas of the Hottentots Holland Mountains in the south-east to less than 300 mm in the north west. Annual evaporation varies between 1 300 mm and 1 700 mm as shown in Figure 2. Temperatures are cool in winter with occasional snow on the mountains, to very hot in summer. Natural vegetation comprises large areas of Cape Fynbos, which represents one of the unique floral kingdoms of the world and is recognised with World Heritage status. Karoo scrub-land is found in the drier areas. Invasive alien vegetation is scattered throughout many of the mountain areas and on the banks of many water courses, with parts of the water management area heavily infested. The Berg River, which rises in the southern mountains to flow in a northerly direction and then westwards towards the coast, is the only major river in the water management area. Several smaller rivers, such as the Diep, Eerste and Steenbras Rivers, drain directly to the ocean.
About 50 conservation areas and heritage sites are found in the water management area, including the Cape Peninsula National Park and sites at the Langebaan Lagoon, which have been designated Ramsar status. Of specific relevance to water resource management is the Berg River Estuary, which is of major conservation importance from an avifaunal perspective.
1.2 Development
The earliest fossilised human footprints in the world have been found along the west coast of the water management area, while the first settlement by Europeans in sub-Saharan Africa occurred near Cape Town in 1652. The first recorded water scheme in South Africa was constructed by Zacharias Wagenaer on a stream at the foot of Table Mountain in 1663. It consisted of a stone and brick structure with a wooden sluice, for the purpose of providing fresh water to ships which sailed around the Cape. From its early beginnings as a re-bunkering station for ships, Cape Town developed to its current status of second most populous metropolitan area in South Africa.
Land use in the water management area is characterised by the sprawling urban and industrial development in the greater Cape Town area, extensive irrigation of vineyards and fruit orchards in the valleys and foothills of the mountains in the south and east, and rolling wheat-lands under rain-fed cultivation, covering most of the central parts, as reflected in Figure 3. There are several large towns in the water management area, with economies based on tourism, education, agriculture and industry. Small state and private forests occur in the foothills of the mountains.
A large nuclear power station is located at Koeberg on the West Coast, which draws cooling water from the Atlantic Ocean and is not dependent on inland freshwater resources. Peaking power is generated at the Athlone thermal station and the Steenbras pumped storage scheme. No large mining activity occurs in the Berg water management area.
1.3 International
The Berg water management area does not border on any neighbouring country and is not linked to any other country through the transfer of water.
1.4 Sub-areas
Large spatial variations in rainfall, water availability, level and nature of economic development, population density as well as the potential for development and growth are evident in the Berg water management area, some of which are manifested over relatively short distances.
The water management area was divided in to sub-areas in order to illustrate the water resources situation in the water management area, and to facilitate the applicability and better use of information for strategic management purposes. Delineation of the sub-areas was judgementally based on practical considerations such as size and location of sub-catchments, homogeneity of natural characteristics, location of pertinent water infrastructure (e.g. dams), and economic development. Smaller or alternative subdivisions may later be introduced by the future catchment management agency.
Consequently, three sub-areas were identified to facilitate the presentation and management of key issues in the water management area. These sub-areas as shown on Figure 1, are :
• The Upper Berg sub-area, which includes the Berg River catchment down to Misverstand Weir near Porterville.
• The Lower Berg sub-area, which comprises the downstream reaches of the Berg River together with the endorheic areas along the west coast, including the Diep River catchment in the southern part of the sub-area.
• The Greater Cape Town sub-area, comprising the remainder of the water management area, and includes the catchments of a number of smaller rivers in the southern part of the water management area.
Berg WMA Final: 19 September, 2003
2. NATIONAL PERSPECTIVE
South Africa is located in a predominantly semi-arid part of the world. The climate varies from desert and semi-desert in the west to sub-humid along the eastern coastal area, with an average rainfall for the country of about 450 mm per year, well below the world average of about 860 mm per year, while evaporation is comparatively high. As a result, South Africa’s water resources are, in global terms, scarce and extremely limited in extent. More than 90% of the water use in the country is supplied from surface resources, whereas groundwater plays a pivotal role in especially rural water supplies. Due to the predominantly hard rock nature of the South African geology, few major groundwater aquifers exist that could be utilised on a large scale.
Attributable to poor spatial distribution of rainfall over South Africa, the natural availability of water across the country is also highly uneven. This is compounded by the strong seasonality of rainfall over virtually the entire country as well as the high within-season variability of rainfall and consequently of runoff. As a result, streamflow in South African rivers is at relatively low levels for most of the time, with sporadic high flows occurring; characteristics which limit the proportion of streamflow that can be relied upon to be available for use. To aggravate the situation, most urban and industrial development, as well as some dense rural settlements, have been established in locations remote from large watercourses; dictated by the occurrence of mineral riches and influenced by the political dispensation of the past, rather than by the plentiful availability of water. As a consequence, the requirements for water already far exceed the natural availability of water in several river basins. Widely spread and often large-scale transfers of water across catchments have, therefore, been implemented in South Africa in the past.
Of the 19 water management areas in the country, only the Mzimvubu to Keiskamma water management area is currently not linked to another water management area through inter-catchment transfers, giving effect to one of the main principles of the National Water Act which designates water as a national resource. Eleven water management areas share international rivers.
A graphical comparison of the natural occurrence of water, the population and the economic activity per water management area is given in Figure 4, clearly demonstrating the exceedingly varied conditions among the water management areas.
Water, which is naturally of poor quality, also occurs in some areas, which limits its utilisation. This applies to both surface and groundwater. Where feasible, special management techniques may be applied to improve water quality to appropriate standards for particular uses.
Whereas attention in the past was mainly focussed on the development of new resources as the requirements for water increased, partly as large unused potential was still available, the efficiency of water use has not developed to the same level of sophistication as resource management. With the current high degree of water resource utilisation in the country, the efficiency of water use must be substantially improved. The Department of Water Affairs and Forestry is developing an extensive programme for water conservation and water demand management which forms an important element of the National Water Resource Strategy. In addition, measures are being introduced to ensure the most beneficial utilisation of water in the country, both from a social and economic perspective. This will include the re-allocation of some water from low benefit uses to higher benefit uses over time.
Berg WMA Final: 19 September, 2003
3. ECONOMIC ACTIVITY AND POPULATION
3.1 Regional Economy
The strong and diversified economy of in the Berg water management area is dominated by the industrial and other activities in the Cape Town metropolitan area. However, close interdependencies exist with activities in the surrounding area and further inland, particularly tourism and agriculture.
About 12% of the Gross Domestic Product (GDP) of South Africa originates from the Berg water management area, constituting the third largest single contribution to the national wealth from any of the water management areas. The composition of the Berg water management area’s economy in terms of contributions to the Gross Geographic Product (GGP) and in comparison to the national averages, is shown in Figure 5. Explanation of the sectors is given in Addendum 2. The largest economic sectors (in 1997) in the water management area, in terms of Gross Geographic Product were:
• Manufacturing 25,4%
• Transport 20,6%
• Financial Services 17,6%
• Government 15,0%
The manufacturing sector has been undergoing structural changes over the past decade, moving from more labour intensive industries towards capital intensive and high-technology enterprises. This can partly be ascribed to the opening of South Africa to global markets, and the need for industry to remain competitive. Manufacturing activities, however, still include many primary and agro industries. A new steel mill was recently brought into operation at Saldanha Bay.
The importance of the transport sector can be attributed to the harbour and the movement of import and export products between the harbour and inland areas. A specific contribution is also being made by the Cape Town International Airport.
Financial services, trade, construction, electricity and other sectors are to a large extent in support of, as well as attracted by, other strong economic activity in the region. Activity in these sectors also relates to the location of a number of corporate headquarters in the region, growth in the property market, the higher education institutions and a strong linkage between the agricultural and financial sectors with respect to financing of equipment and resources.
The Government services sector is strong due to the presence of a number of national, provincial, regional and local government institutions.
Agriculture, although one of the smallest sectors in terms of its contribution to the Gross Geographical Product (± 2,5%), has strong linkages to other sectors of the regional economy and provides livelihood to a large proportion of the rural population.
Of the total work force in 1994, 62% were active in the formal economy. Unemployment at 19% was well below the national average of 29%. Employment in the informal economy accounted for the remaining 19%, which is higher than in most other water management areas. Of those formally employed, 30% were in the government sector, followed by 26% in manufacturing and 14% in the trade sector.
Attributable to an existing strong, well-integrated and diversified economy, and certain comparative advantages over other parts of the country, potential for future economic development in the Berg water management area remains strong. In particular, the economy in the water management area is relatively more competitive than the remainder of South Africa in the transport, construction, finance and manufacturing sectors. Growth will therefore largely be attracted to the already strong economy in the Greater Cape Town area, with moderate to little change elsewhere in the water management area. The transport sector benefits from international trade through the airport and harbour, and has important forward and backward linkages to other sectors such as manufacturing and construction. The Cape Metropolitan Area’s comparative advantage as a national financial service centre also has positive effects on other sectors. In the manufacturing sector, rapid growth has been experienced in the activities of small, medium and micro enterprises.
Berg WMA Final: 19 September, 2003
Agricultural products from the region are in demand internationally and, subject to price fluctuations and trade agreements, the sector is likely to remain in a favourable position.
3.2 Demography
A detailed study of the population distribution in the country and of the expected future demographic and economic changes was conducted to serve as background to the estimation of future water requirements. Different scenarios were developed as described in Addendum 4. Demographic information pertinent to the Berg water management area is captured below.
Mirroring the dominance of the urbanised sectors of the economy as reflected in Figure 4, 95% of the population of the water management area reside in urban areas. Geographically, 87% of the total population are concentrated in the Greater Cape Town sub-area, where they are attracted by the economic activity and employment opportunities of the region. Population density in the winelands is moderate, but sparse to the north and west, reflecting the combined influence of climate and economic activity.
As applies to the current population distribution, the future demography of the water management area will also largely be influenced by economic opportunities and potential. Projections therefore are for continued relatively strong population growth in the urban component of the population, as shown in Figure 6. Most of the growth will be in the vicinity of Cape Town and its immediate coastal environs, with growth also foreseen with respect to the more industrialised towns in the water management area. The lack of stimulants and potential for expansion in the agricultural sector are likely to result in little change in the rural component of the population.
Berg WMA Final: 19 September, 2003
4. WATER REQUIREMENTS
4.1 Current requirements (year 2000)
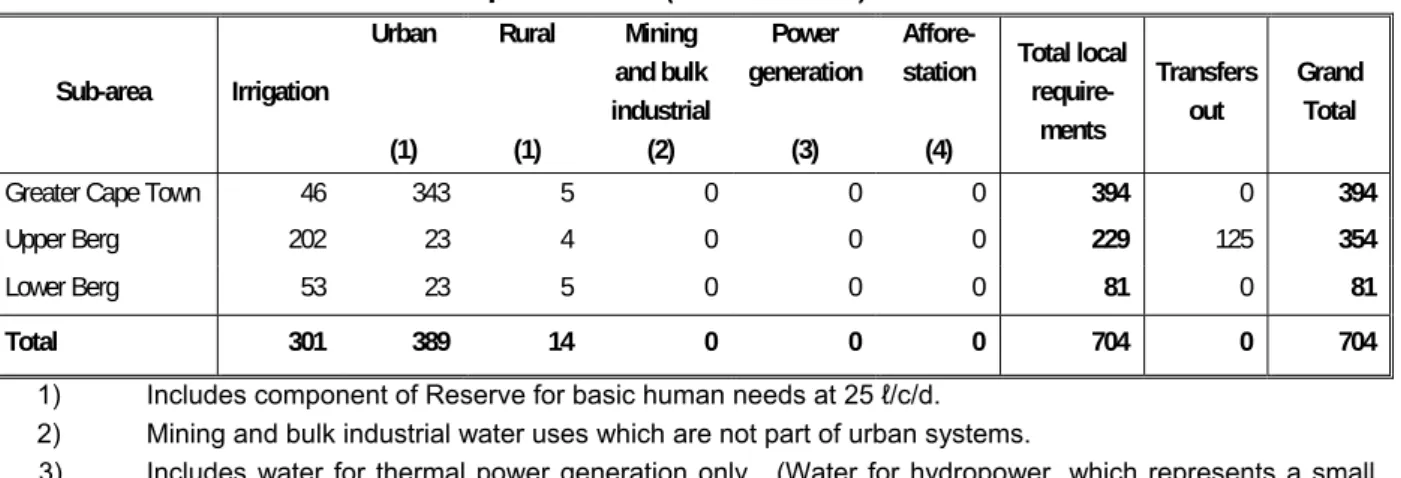
Close to 60% of the total water requirements in the water management area are for urban and industrial use, and about 40% for irrigation. Rural water requirements (other than for irrigation) constitute less than 2% of the total. (Water for power generation and for use by large industries, is included with water supplied by the urban distribution systems.) Geographically, 56% of the total requirements for water occurs within the Greater Cape Town sub-area and 31% in the Upper Berg sub-area, reflecting the dominance of urban/industrial development and irrigation in these two sub-areas, respectively. Requirements for water in the Lower Berg sub-area are relatively small, with irrigation again prominent, and with the industrial developments at Atlantis and Saldanha representing a significant portion of the urban water use. A summary of the sectoral water requirements in each of the sub-areas is given in Table 1, and is diagrammatically shown in Figure 7. All the requirements are given at the standard 98% assurance of supply, as explained in Addendum 3.
Table 1: Year 2000 Water Requirements (million m³/a)
Sub-area Irrigation Urban (1) Rural (1) Mining and bulk industrial (2) Power generation (3) Affore- station (4) Total local require- ments Transfers out Grand Total
Greater Cape Town 46 343 5 0 0 0 394 0 394
Upper Berg 202 23 4 0 0 0 229 125 354
Lower Berg 53 23 5 0 0 0 81 0 81
Total 301 389 14 0 0 0 704 0 704
1) Includes component of Reserve for basic human needs at 25 ℓ/c/d. 2) Mining and bulk industrial water uses which are not part of urban systems.
3) Includes water for thermal power generation only. (Water for hydropower, which represents a small portion of power generation in South Africa, is generally available for other uses as well.)
4) Quantities given refer to impact on yield only.
In general, irrigation practices in the Berg water management area are highly sophisticated and water use by the irrigation sector is relatively efficient compared to many other water management areas in the country. Irrigated agriculture mainly produces high value table grapes, fruit and wine for the export market and vegetables for local consumption. Some potential for improved efficiency remains.
Berg WMA Final: 19 September, 2003
A substantial portion of the water used in urban areas (more than 45%) becomes available as effluent, part of which could potentially be re-used, depending on local conditions and the economic feasibility thereof. In Cape Town, approximate 6% of the return flows are re-used (compared to about 15% in Durban, and close to 100% in Johannesburg where re-use is mostly by means of treated effluent being discharged to rivers for downstream abstraction.
Estimates of return flows for the urban sector are given in Appendix 1, which also shows the quantities of water estimated to be lost through urban distribution systems. Similar information with respect to irrigation is contained in Appendix 3. The efficiency of Water use by irrigation is relatively high compared to the rest of the country, particularly with respect to vineyards and orchards.
4.2 Future requirements
There are many factors which influence the requirements for water. These include climate, nature of the economy (i.e. irrigated agriculture, industrialisation) and standards of living. Of these, climate is relatively stable, while in most cases control can be exercised over the growth in irrigation water requirements. Population and economic activity, however, have their own inherent growth rates which are dependent on a wide spectrum of extraneous influences. Population growth and economic growth, which also relates to socio-economic standards, are therefore regarded as the primary determinants with respect to future water requirements.
Based on the scenarios for population and economic growth, initial estimates of possible future water requirements were made for the period until 2025. In addition, provision was made for known and probable future developments with respect to power generation, irrigation, mining and bulk users as described under the respective sub-areas where applicable. (Specific quantities, rather than a general annual growth rate, were allowed for in these sectors.)
Within the spectrum of population and economic growth scenarios, a base scenario was selected for estimating the most likely future water requirements. This is built on the high scenario of population growth and more equitable distribution of wealth leading in time to higher average levels of water services. The ratio of domestic to public and business (commercial, communal, industrial) water use for urban centres in the year 2000, for the respective centres, is maintained. A possible upper scenario of future water requirements, is also given, based on the assumption that there will be high population growth and a high standard of services (socio-economic development); together with a strong increase in the economic requirements for water, where the public and business use of water would increase in direct proportion to the gross domestic product. The purpose of the upper scenario is to provide a conservative indicator in order to prevent the occurrence of possible unexpected water shortages. No adjustments have been made for reflecting the impacts of increased water use efficiency.
Berg WMA Final: 19 September, 2003
General trends in the Berg water management area are the continued concentration of economic development in the Greater Cape Town and the ongoing dominant urban character of the population. A strong growth in water requirements can therefore be expected in the Greater Cape Town sub-area. Needs also exists for additional water to be made available for irrigation in the water management area, which is likely to be in conflict with the urban requirements and will require judicious prioritisation. Growth in requirements for water are also expected as a result of tourism and other developments along the west coast.
No meaningful change in water requirements is foreseen with respect to the rural parts of the water management area.
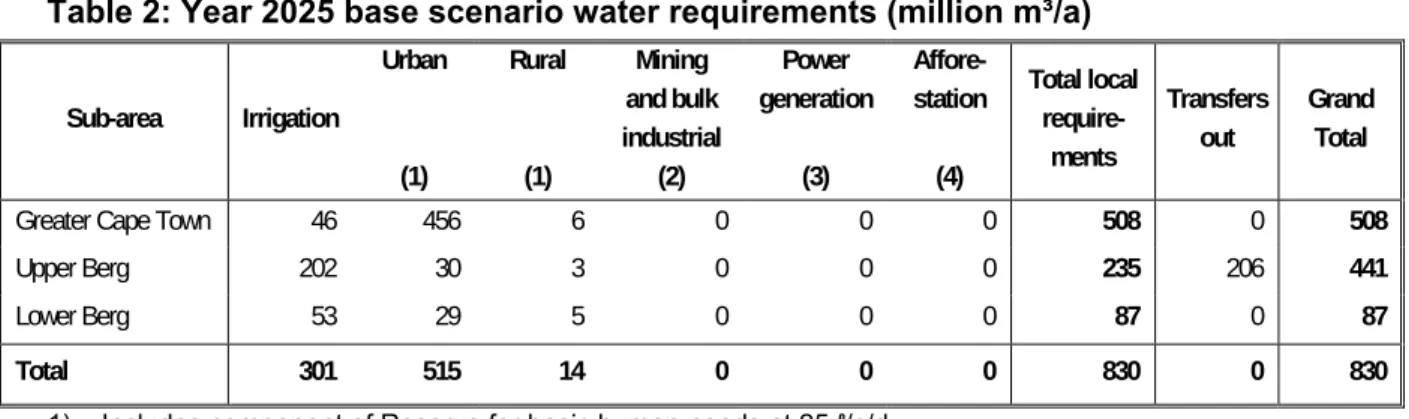
Quantification of the projected future requirements for water is presented in Tables 2 and 3 for the base and high scenarios respectively, and is further discussed in Section 6.
Table 2: Year 2025 base scenario water requirements (million m³/a)
Sub-area Irrigation Urban (1) Rural (1) Mining and bulk industrial (2) Power generation (3) Affore- station (4) Total local require- ments Transfers out Grand Total
Greater Cape Town 46 456 6 0 0 0 508 0 508
Upper Berg 202 30 3 0 0 0 235 206 441
Lower Berg 53 29 5 0 0 0 87 0 87
Total 301 515 14 0 0 0 830 0 830
1) Includes component of Reserve for basic human needs at 25 ℓ/c/d. 2) Mining and bulk industrial water uses which are not part of urban systems.
3) Includes water for thermal power generation only. (Water for hydropower, which represents a small portion of power generation in South Africa, is generally available for other uses as well.)
4) Quantities given refer to impact on yield only.
Table 3: Year 2025 high scenario water requirements (million m³/a)
Sub-area Irrigation Urban (1) Rural (1) Mining and bulk industrial (2) Power generation (3) Affore- station (4) Total local require- ments Transfers out Grand Total
Greater Cape Town 46 861 6 0 0 0 913 0 913
Upper Berg 202 65 3 0 0 0 270 206 476
Lower Berg 53 65 5 0 0 0 123 0 123
Total 301 991 14 0 0 0 1 306 0 1 306
1) Includes component of Reserve for basic human needs at 25 ℓ/c/d. 2) Mining and bulk industrial water uses which are not part of urban systems.
3) Includes water for thermal power generation only. (Water for hydropower, which represents a small portion of power generation in South Africa, is generally available for other uses as well.)
4) Quantities given refer to impact on yield only.
5. WATER RESOURCES
5.1 Surface Water
About 75% of the total surface runoff from the water management area is from the catchment of the Berg River, from which 85% of the local surface water yield is obtained. Negligible surface runoff occurs from the north-western part of the water management area. Several mountain streams, certain reaches of the Berg River, and also the estuary, are of high ecological significance. There are no natural lakes in the water management area (the renowned Langebaan Lagoon being a saltwater system connected to the ocean). Some wetlands occur, of which the Rietvlei Wetland is of particular ecological significance. The main land use impact is the reduction in runoff due to infestations of invasive alien vegetation (which is being removed under the Working for Water programme). Commercial afforestation is insignificant in the water management area. With most of the urban development concentrated along the coast, this has little impact on surface runoff.
A summary of the Mean Annual Runoff (MAR), together with the estimated requirements for the ecological component of the Reserve, are given in Table 4. More detail on the estimation of the Reserve is given in Addendum 4.
It is important to note that the data with respect to the mean annual runoff as well as the ecological component of the Reserve have been taken from national data sources, for the purpose of compatibility of the water management area information in the National Water Resource Strategy. In many instances more detailed studies have been conducted or are under way, from which improved information may be obtained (also on items other than the MAR and Reserve), and which should also be referred to with respect to detail planning and design work.
Table 4: Natural Mean Annual Runoff and Ecological Reserve (million m³/a)
Sub-area Natural MAR (1)
Ecological Reserve (1, 2)
Greater Cape Town 373 61
Upper Berg 849 124
Lower Berg 207 32
Total 1 429 217
1) Quantities given are incremental, and refer to the sub-area under consideration only.
2) Total volume given, based on preliminary estimates. Impact on yield being a portion of this. Refer to Appendix 4.
The natural quality of surface water is of a high standard in the upstream reaches and mountainous areas. Due to different geological formations, tributary inflows to the lower reaches of the Berg River are of high salinity which limits the usability thereof. Water quality in the estuary and lower tidal reaches of the river is characteristically of high salinity.
Berg WMA Final: 19 September, 2003
Water quality in the Diep River is also of natural high salinity. The water quality of several small rivers in the vicinity of Cape Town is impacted by effluent return flows and wash-off to streams from urban areas.
The surface water resource of the water management area have been well developed through the construction of several large dams and numerous farm dams, many of which are located off-channel and are filled by pumping from the rivers during periods of high flow. The main storage dams, for which more details are given in Appendix 5, are:
• Wemmershoek Dam, Voëlvlei Dam and Misverstand Dam in the Upper Berg sub-area. (Voëlvlei Dam is located off-channel and is fed by diversions from several streams. Misverstand Dam on the Berg River is mainly used for abstraction of releases from Voëlvlei.)
• The Steenbras Upper and Steenbras Lower Dams on the Steenbras River, in the Greater Cape Town Sub-area. (The Upper Steenbras Dam, which serves the Steenbras pumped storage scheme, also receives water transferred from the Breede water management area via the Palmiet pumped storage scheme.)
• Kleinplaas Dam in the Greater Cape Town sub-area, is mainly used for diversion and balancing purposes.
• Urban supplies include the five small dams in the Cape Peninsula and the two Idas Valley Dams near Stellenbosch, both in the Greater Cape Town sub-area, and two small dams on Paarl Mountain.
An unique feature of water resource management in the Berg water management area is that water is diverted from the upper tributaries of the Berg River via the Riviersonderend-Berg River scheme during the high flow season, for storage in the Theewaterskloof Dam in the Breede water management area, for transfer back to the Berg water management area during the low flow summer season.
In addition, large quantities of water are transferred into the water management area to augment the local resources, constituting close to 30% of the total water use in the water management area. All of the transfers are from the Breede water management area, whilst no water is transferred out of the Berg water management area. The most significant transfer of water is from the Theewaterskloof Dam via the Riviersonderend-Berg River scheme, amounting to 162 million m3 per year nett. (Thus additional to the transfer back of
Berg River water.) On average 23 million m3 per year is transferred from the Palmiet River,
via the pumped storage project, to Upper-Steenbras Dam. Smaller localised transfers into the water management area amount to about 8 million m3 per year. More details on the
existing transfers are given in Appendix 6.
Reasonable potential for further development of surface resources exists in the water management area, subject to formal quantification of the requirements with respect to the
ecological component of the Reserve. Approval has already been granted for construction of the Berg Water Project and Supplement Scheme on the upper Berg River, with the Voëlvlei Augmentation Scheme being an additional option. Potential also exists for diversions from the Eerste River and Lourens River (as well as other smaller options). Several options have been identified for increased and additional transfers from the Breede water management area to the Berg water management area.
5.2 Groundwater
About 6% of the total requirements for water in the Berg water management area is estimated to be supplied from groundwater.
Most of the water abstracted from groundwater aquifers is for irrigation, mainly in the Cape Flats area and in the upper parts of the Berg River catchment. The largest urban use of groundwater is at Atlantis, where artificial recharge of groundwater is practised. Several smaller towns are also reliant on groundwater, and groundwater is widely used for rural domestic and livestock requirements, although quantities for the latter uses are small.
The quality of groundwater follows the same pattern as surface water. Water of a high standard occurs in the southern and south-eastern parts of the water management area, while mineralisation may be problematic towards the north-west. There is concern about the potential pollution of sandy aquifers through infiltration of urban effluent.
Close inter-dependence exists between groundwater and surface water in certain areas, where further exploitation of groundwater may directly reflect in reduced surface water flow. It is also important that groundwater levels along the coast be carefully managed to prevent the intrusion of seawater into aquifers, a situation which is often irreversible. Significant quantities of water are believed to be abstractable from the deep fractured rock aquifers of the Table Mountain Group geological formations. Some of these aquifers drain directly to the ocean and have less connectivity to surface flows than the shallower aquifers. Further investigations of the feasibility of utilising this resource are required.
5.3 Summary
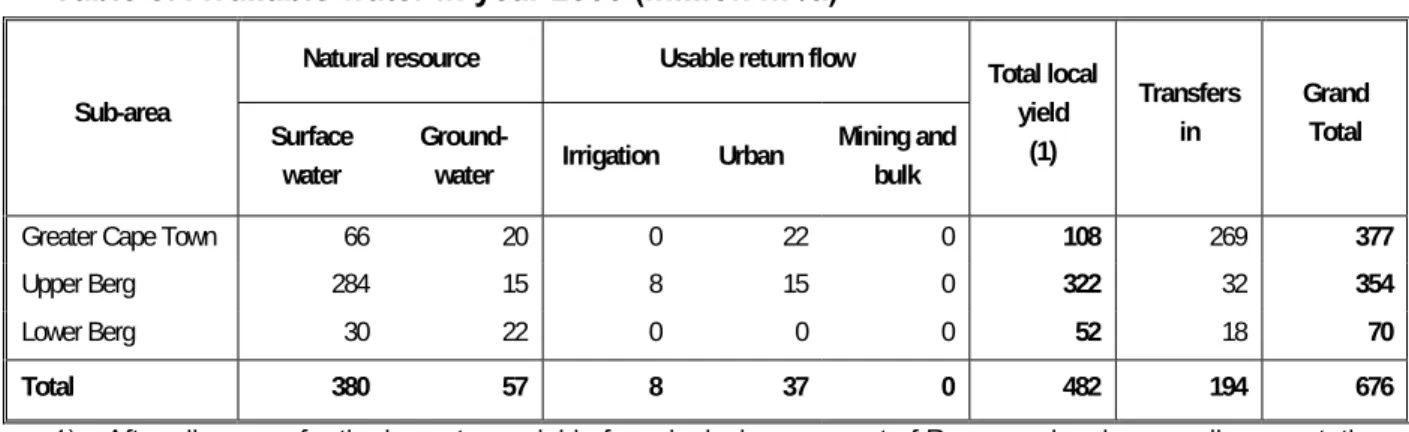
The total yield available in the Berg water management area at the year 2000 development levels, is schematically presented in Figure 8 and summarised in Table 5. Details on factors, which influence the yield such as the impacts of the Reserve, alien vegetation, river losses and urban runoff, are contained in Appendix 4.
Particularly evident from Figure 7 is the importance of water transfers into the water management area. In total, just under 30% of the current water available in the water management area is supplied by transfers from the Breede water management area. (Refer to Chapter 5 for more detail). The re-use of return flows is relatively small compared
Berg WMA Final: 19 September, 2003
to other parts of the country, including other coastal cities, and warrants closer consideration.
Table 5: Available water in year 2000 (million m³/a)
Natural resource Usable return flow Sub-area
Surface water
Ground-
water Irrigation Urban
Mining and bulk Total local yield (1) Transfers in Grand Total
Greater Cape Town 66 20 0 22 0 108 269 377
Upper Berg 284 15 8 15 0 322 32 354
Lower Berg 30 22 0 0 0 52 18 70
Total 380 57 8 37 0 482 194 676
1) After allowance for the impacts on yield of: ecological component of Reserve, river losses, alien vegetation, rain-fed agriculture and urban runoff.
There is evidence that global temperatures may be rising, with some climatic models suggesting that this could cause increased variability of climate over the eastern parts of South Africa, and a decrease in rainfall from the west and over the Western Cape region. Streamflow could decrease as much as 10% by the year 2015 in parts of the Western Cape most affected, with greater impacts on the recharge of groundwater. Because of the influence of increased variability of streamflow, it is likely that the yields obtainable from water resources affected by climate change would decrease proportionately more than the reduction in runoff. Plant and irrigation water requirements would also increase should such warmer climatic conditions manifest.
While there is no conclusive evidence yet of any accelerated large scale and persistent long term climatic changes in South Africa, other than what can normally be expected to occur, it would be prudent to consciously consider the possibility of climate change in the development of catchment management strategies.
6. RECONCILIATION OF REQUIREMENTS AND AVAILABILITY
6.1 Water Balance
A reconciliation of the available water and total requirements for the year 2000 (and 2025), including transfers between the Breede and Berg water management areas, is graphically presented in Figure 9 with quantifications given in Table 6. The main transfers with associated quantities are also shown on Figure 1 and are summarised in Appendix 6.
Table 6: Reconciliation of requirements and available water for year 2000 (million m³/a)
Available water Water requirements Sub-area Local yield Transfers in (2) Total Local require-ments Transfers out (2) Total Balance (1)
Greater Cape Town 108 269 377 394 0 394 ( 17)
Upper Berg 322 32 354 229 125 354 0
Lower Berg 52 18 70 81 0 81 ( 11)
Total 482 194 676 704 0 704 ( 28)
1) Brackets around numbers indicate negative balance. Surpluses are shown in the most upstream sub-area where they first become available
2) Transfers into and out of sub-areas may include transfers between sub-areas as well as transfers between water management areas. Addition of the transfers per sub-area therefore does not necessarily correspond to the total transfers into and out of the water management area. The same applies to Tables 7 and 8.
The deficit with respect to the Greater Cape Town sub-area is attributable to insufficient resource capacity to supply the urban and industrial requirements for water in the Cape Town region. Despite the implementation of a comprehensive water demand management programme, assessment of the situation indicates that curtailments will have to be applied every three to four years. A serious need for augmentation of the resources therefore exists.
The deficit in the Lower Berg sub-area is small in comparison to the requirements, reflecting that the whole Berg River system is approximately in balance. This, however, is based on the provisional allowance made for the Reserve, which still needs to be implemented. This is likely to change once the requirements for the Reserve are formally determined.
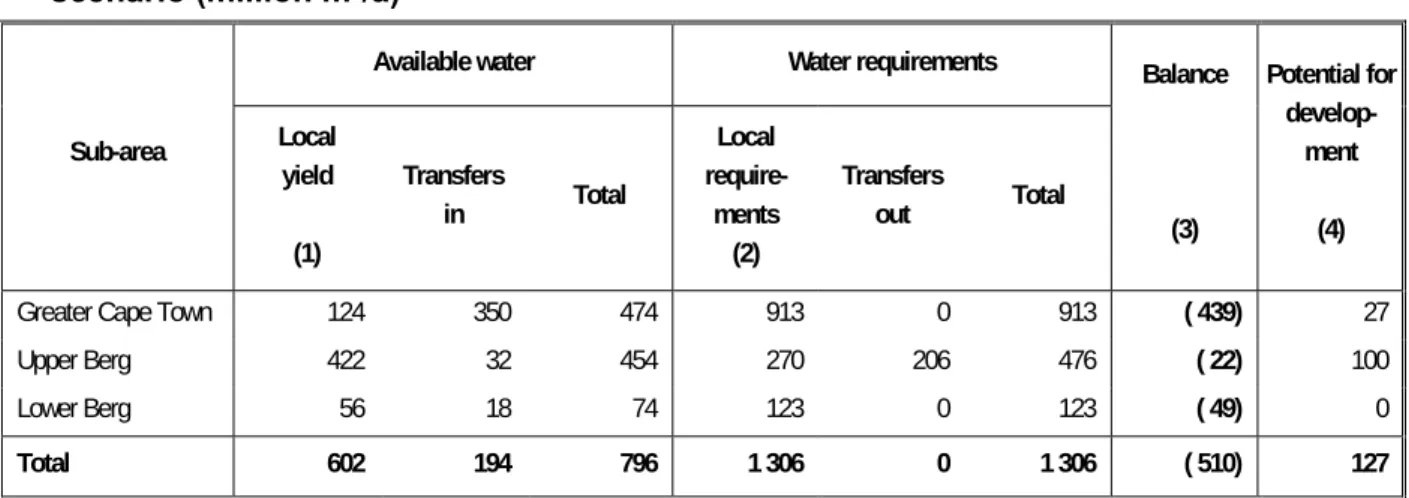
A perspective on the possible future situation (year 2025) is given by Table 7 for the base scenario, and Table 8 as representative of a possible high water use scenario. (Refer to Addendum 1.) These are also graphically presented in Figure 9. No adjustments have been made to reflect the impacts of increased water use efficiency or other interventions. It
Berg WMA Final: 19 September, 2003
is evident that for both the base and high future projections, the deficits with respect to the Cape Town area can be expected to increase, and dramatically so in the case of the high growth scenario. Under the high growth scenario, deficits are also expected to occur in the Upper and Lower Berg River sub-areas, as a result of urban and industrial development around the towns in the region as well as along the West Coast. No meaningful change in the rural requirements for water is foreseen.
Compared to the natural mean annual runoff of 1 429 million m3 per year which originates
from the water management area, an estimated 872 million m3 per year or 61% still flows
out of the area to the ocean.
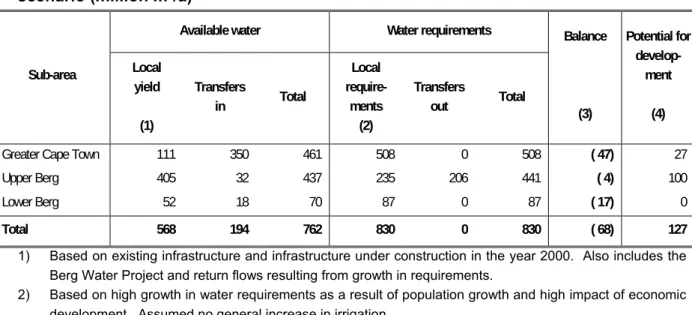
Table 7: Reconciliation of water requirements and availability for the year 2025 base scenario (million m³/a)
Available water Water requirements Sub-area Local yield (1) Transfers in Total Local require- ments (2) Transfers out Total Balance (3) Potential for develop- ment (4)
Greater Cape Town 111 350 461 508 0 508 ( 47) 27
Upper Berg 405 32 437 235 206 441 ( 4) 100
Lower Berg 52 18 70 87 0 87 ( 17) 0
Total 568 194 762 830 0 830 ( 68) 127
1) Based on existing infrastructure and infrastructure under construction in the year 2000. Also includes the Berg Water Project and return flows resulting from growth in requirements.
2) Based on high growth in water requirements as a result of population growth and high impact of economic development. Assumed no general increase in irrigation.
3) Brackets around numbers indicate negative balance.
4) Based on expansion of the Voëlvlei Scheme, and potential diversions from the Lourens River and Eerste River.
Table 8: Reconciliation of water requirements and availability for the year 2025 high scenario (million m³/a)
Available water Water requirements Sub-area Local yield (1) Transfers in Total Local require- ments (2) Transfers out Total Balance (3) Potential for develop- ment (4)
Greater Cape Town 124 350 474 913 0 913 ( 439) 27
Upper Berg 422 32 454 270 206 476 ( 22) 100
Lower Berg 56 18 74 123 0 123 ( 49) 0
Total 602 194 796 1 306 0 1 306 ( 510) 127
1) Based on existing infrastructure and infrastructure under construction in the year 2000. Also includes the Berg Water Project and return flows resulting from growth in requirements.
2) Based on high growth in water requirements as a result of population growth and high impact of economic development. Assumed no general increase in irrigation.
3) Brackets around numbers indicate negative balance.
4) Based on expansion of the Voëlvlei Scheme, and potential diversions from the Lourens River and Eerste River.
6.2 Key issues
Key considerations with respect to the Berg water management area are:
• Deficits already experienced which are in excess of what can reasonably be mitigated through water demand management, together with recognitions of Cape Town as one of the main growth points in the country, necessitating the need for augmentation of the existing water supply capabilities.
• Projections of future growth in water requirements in the Greater Cape Town area, exceeding the remaining undeveloped water resource potential in the water management area, will require additional transfers of water into the water management area, as well as other options to be resorted to.
• The impacts of implementation of the Reserve on the current water balances as well as on the potential for future development in the water management area.
• Special attention also needs to be given to the management of water quality in the lower Berg River.
• Possible exploitation of the Table Mountain Group aquifers.
6.3 Strategic perspectives
Given the large contribution to the national economy which arises from the geographic area covered by the Berg water management area, together with the strong potential for confined growth in key economic sectors, particularly in the Greater Cape Town area and vicinity, it is of national importance to ensure that sufficient water is available to meet the reasonable requirements for growth in the water management area. Ensuring that the future supply of water to the Greater Cape Town area is sufficient, should be the highest priority with respect to water resource management in the Berg water management area. In doing so, due consideration is to be given to also safeguarding the rich natural heritage and unique ecosystems which occur in the water management area.
Strategic perspectives on the main interventions and options with respect to the future availability and optimal utilisation of water in the Berg water management area are concisely described below. A general description of the options for the reconciliation of the requirements for and availability of water, is given in Addendum 5.
Greater Cape Town sub-area
The effective implementation of water demand management is a prerequisite, before resorting to further resource development and transfers. Substantial progress has already
Berg WMA Final: 19 September, 2003
been made in this regard in the Cape Town metropolitan area. Given the high growth rates projected for the area and the already insufficient resource capability, however, water demand management alone will not be sufficient to meet the future requirements for water, and other interventions will have to be resorted to. The main options for the augmentation of the water supplies to the Cape Town area are:
• Construction of the Berg Water Project and Supplement Scheme (already approved).
• Expansion of the Voëlvlei Scheme, comprising diversion of water from the Berg River into the Voëlvlei water treatment works..
• Increased re-use of effluent, which is currently discharged to the ocean.
• Exploration of the deep Table Mountain Group aquifers, which should only be embarked upon following carefully directed further investigations.
Other options located within the Greater Cape Town sub-area include the use of water from smaller rivers such as the Eerste River and Lourens River, increased transfers from the Breede water management area, and the possible desalination of seawater. Ongoing monitoring of the situation and regular reviewing of options and priorities should be undertaken. Of concern is the large dependence of Cape Town on water supplied via the Theewaterskloof Tunnel, and appropriate risk assessments of the situation are required.
A localised problem within the Greater Cape Town sub-area exists with respect to the water supply to Robben Island. Water demand management and improved management of the groundwater resource together with the recent provision of a reverse osmosis desalination plant, should appropriately remedy the situation.
Upper Berg sub-area
Implementation of the Reserve may have a substantial influence on water availability and utilisation from the Berg River. Priority should therefore be given to determination of the Reserve (particularly the ecological component). It is advisable that a temporary embargo on new farm dams in the Berg River catchment and on increased pumping from the river be imposed, until the requirements for the Reserve are known and clarity has been gained on the most beneficial use of the resource potential still remaining, if any.
The eradication of invasive alien vegetation, and water conservation and demand management continues to enjoy high priority. No further afforestation should be allowed. Consideration should be given to irrigation development in the Breede water management area as a means of limiting the needs for expansion of irrigation, or for reducing irrigation, in the Berg River catchment.
Lower Berg sub-area
The same considerations with respect to the Reserve and irrigation apply to the Lower Berg sub-area as for the Upper Berg sub-area.
Management of water quality in the lower reaches of the Berg River as well as maintenance of the estuary are of particular importance. Developments along the west coast may be supplied from groundwater, or alternative be linked into the urban bulk water distribution systems.
Climate Change
Considering the possible implications of climate change and indications that its impacts may manifest first in the south-western parts of the country, it is important that the situation should be monitored as a pre-cautionary measure. Special attention is to be given to long term monitoring of hydro meteorological parameters in selected, preferably pristine, benchmark sub-catchments. No development or investment decisions should be made that neglect to take into account the actual or potential effects of climate change on water resources.
6.4 Transfers and reservation of water
The transfer of water between water management areas as well as provisions for future growth and strategic use resort under national control. The following reservations with respect to the transfer of water from the Breede water management area to the Berg water management area are made in the National Water Resource Strategy:
• 162 million m³ per year from the Riviersonderend catchment
• 22,5 million m³ per year, on average, from the Palmiet River, with a maximum capacity of 50 million m³ per year.
• smaller transfers from the Breede water management area, amounting to 9 million m3
per year.
In addition, the construction of any large new water infrastructure in the Breede water management area, which would materially impact on future transfers to the Berg water management area, will be subject to national approval, to ensure that options for future transfer of water from the Breede water management area to the Berg water management area are not inadvertently jeopardized.
Berg WMA Final: 19 September, 2003
REFERENCES
1. First Edition National Water Resource Strategy, DWAF, for publication in 2003. 2. Reports on Water Resources Situation Assessment Studies:
Water Resources Situation Assessment - Limpopo WMA: DWAF Main Report No 01000/00/0301. August 2001.
3. The Distribution of South Africa’s Population, Economy and Water Usage into the Long Term Future: Schlemmer,L; and Markdata (Pty) Ltd for DWAF, 2001.
4. Water Situation Assessment Model: Data Preparation and Processing: Craig, AR and Taviv, I. DWAF Report P.RSA/00/2401, March 2001.
5. Economic Information System 2000. Urban Econ for DWAF, 2000.
6. Alien Invading Plants and Water Resources in South Africa: A Preliminary
Assessment. Versveld, DB; Le Maitre, DC; and Chapman, RC. Water Research Commission, September 1998.
7. The Impacts of Timber Plantations on Runoff in South Africa: A Handy Reference Manual, Le Maitre, DC; Scott, DF; and Fairbanks, DHK. CSIR Stellenbosch, July 1, 1997.
8. Preparation of Climate Data and Information for Application in Impact Studies of Climate Change over South Africa: (Report to South African Country Studies for Climate Change Programme), School of Bioresources Engineering and Environmental Hydrology, University of Natal, Pietermartizburg, ACRUcons. Report 32 January 2000. Perks, LA; Schulze, RE; Kiker, GA; Horan, MJC; Maharaj, M.
9. Assessment of the Impact of Climate Change on Hydrology and Water Resources in South Africa: (Report to South African Country Studies for Climate Change Programme), School of Bioresources Engineering and Environmental Hydrology, University of Natal,
Pietermartizburg, ACRUcons Report 33 January 2000. Schulze, RE; and Perks, LA.
10. National Water Resource Quality Status Report: Inorganic Chemical Water Quality of Surface Water Resources in South Africa – The Big Picture; Hohls, Silberbauer, Kϋhn, Kempster, van Ginkel; DWAF Report N/0000/REQ0801, April 2002.
11. Assessment of the conservation priority status of South African estuaries for use in management and water allocation. J K Turpie et al, Water SA Vol 28 No 2, April 2002.
12. Reports on Overview of Water Resources Availability and Utilisation: 12.1 Limpopo Water Management Area
Report No. P WMA01000/00/0203
12.2 Luvuvhu and Letaba Water Management Area Report No. P WMA02000/00/0203
12.3 Crocodile (West) and Marico Water Management Area Report No. P WMA03000/00/0203
12.4 Olifants Water Management Area Report No. P WMA04000/00/0203 12.5 Inkomati Water Management Area Report No. P WMA05000/00/0203
12.6 Usutu to Mhlatuze Water Management Area Report No. P WMA06000/00/0203
12.7 Thukela Water Management Area Report No. P WMA07000/00/0203 12.8 Upper Vaal Water Management Area
Report No. P WMA08000/00/0203 12.9 Middle Vaal Water Management Area
Report No. P WMA09000/00/0203 12.10 Lower Vaal Water Management Area
Report No. P WMA10000/00/0203
12.11 Mvoti and Umzimkulu Water Management Area Report No. P WMA11000/00/0203
12.12 Mzimvubu to Keiskamma Water Management Area Report No. P WMA12000/00/0203
12.13 Upper Orange Water Management Area Report No. P WMA13000/00/0203 12.14 Lower Orange Water Management Area
Report No. P WMA14000/00/0203
12.15 Fish to Tsitsikamma Water Management Area Report No. P WMA15000/00/0203
12.16 Gouritz Water Management Area Report No. P WMA16000/00/0203 12.17 Olifants/Doorn Water Management Area
Report No. P WMA17000/00/0203 12.18 Breede Water Management Area
Report No. P WMA18000/00/0203 12.19 Berg Water Management Area
Berg WMA Final: 19 September, 2003
APPENDICES
APPENDIX 1 : URBAN WATER REQUIREMENTS (year 2000)
APPENDIX 2 : RURAL WATER REQUIREMENTS (year 2000)
APPENDIX 3 : IRRIGATION WATER REQUIREMENTS (year 2000)
APPENDIX 4 : FACTORS INFLUENCING RUNOFF AND YIELD (year 2000)
APPENDIX 5 : MAJOR DAMS DATA
APPENDIX 6 : DETAILS OF MAIN TRANSFERS (year 2000)
ADDENDA
ADDENDUM 1 : BACKGROUND ON DEMOGRAPHIC AND ECONOMIC STUDIES
ADDENDUM 2 : ECONOMIC SECTOR DESCRIPTION (for GGP and Labour Distribution) ADDENDUM 3 : YIELD, RELIABILITY, AVAILABLE WATER AND ASSURANCE OF
SUPPLY
ADDENDUM 4 : ECOLOGICAL COMPONENT OF RESERVE ADDENDUM 5 : RECONCILIATION INTERVENTIONS
ADDENDUM 6 : PRIORITIES FOR ALLOCATING WATER ADDENDUM 7 : INTER CATCHMENT TRANSFER OF WATER