2014-2019
E
DUCATIONAL
Vision, Mission, Values
Vision Statement
Rio Hondo College strives to be an exemplary California community college, meeting the learning needs of its changing and growing population, and developing a state of the art campus to serve future generations.
Mission Statement
Rio Hondo College is committed to the success of its diverse students and communities by providing dynamic educational opportunities and resources that lead to associate degrees, certificates, transfer, career and technical pathways, basic skills proficiency, and lifelong learning.
Values Statement
As a teaching/learning community, we come together and strive to meet the needs, aspirations, and goals of our changing student population and communities. Since what we value forms the core of who and what we are, the college community – trustees, faculty, and staff – recognizes the importance of openly and candidly expressing the college’s values. Rio Hondo College values the following:
1. Quality Teaching and Learning
The college is dedicated to excellence in instruction and student services to develop the intellectual and personal competence of each student. Rio Hondo College is committed to preparing students to adapt to the demands of a multicultural society.
2. Student Access and Success
Rio Hondo College recognizes the individual worth and potential of every human being. Accordingly, the college offers an open access, comprehensive educational program to its students including basic skills, vocational education certificates and degrees, general education and transfer courses, and, for its community, economic development opportunities.
At Rio Hondo College, students will have an opportunity to develop ethical values, learn the rights and responsibilities of citizenship, develop career skills, and understand the scientific, artistic and social achievements of various cultures including their own.
3. Diversity and Equity
Rio Hondo College remains committed to the diversity of students, faculty, staff, and management. Diversity can be defined in many ways including ethnicity, gender, sexual orientation, socio-economic status, age, physical abilities, religious beliefs, learning styles, political beliefs, or other ideologies. Appreciation of diversity means the following:
Recognizing that each individual is unique and understanding individual differences. Recognizing the things that people have in common despite being members of diverse groups.
Creating a safe, positive, and nurturing environment that cultivates respect for what these differences are.
Moving beyond simple tolerance to embracing and celebrating the rich dimensions of diversity as a way of coming together as a community with a common purpose. The concepts of educational equity and student learning outcomes are central to the values of the College. Access to education and the opportunity for educational success for all students shall be provided, with particular efforts in regard to those who have been historically and currently underrepresented. Education should prepare students to adapt to the demands of a multicultural society.
4. Fiscal Responsibility
Rio Hondo College recognizes the importance of maintaining a fiscally sound, efficient, and effective college operation. It uses its resources – human, facilities, and financial – to the optimum benefit of its students, community, and staff.
5. Integrity and Civility
TABLE OF CONTENTS
INTRODUCTIONI. Introduction ... 5
II. History of Rio Hondo College ... 6
EXTERNAL & INTERNAL SCANS III. Rio Hondo College Cities/Community ... 9
IV. Community Information ... 13
V. Community Economic & Employment Information ... 20
VI. Student Demographics... 28
VII. Student Enrollment Trends ... 33
VIII. Student Achievement Information ... 35
MASTER PLAN IX. Introduction to Master Plan ... 42
X. Vision, Mission, and Values ... 43
XI. Strategic Directions ... 44
XII. Institution Set Standards ... 45
XIII. Institutional Goals & Objectives ... 47
XIV. Student Success & Support Programs ... 54
XV. Academic and Vocational Programs ... 68
XVI. College Projections ... 105
A. Budget Outlook ... 105
B. FTES & Enrollment ... 105
IMPLICATIONS & CONCLUSIONS XVII. Link to Technology Plan ... 108
XVIII. Link to Facilities Plan ... 110
2014-2019 RIO HONDO COLLEGE EDUCATIONAL MASTER PLAN PAGE 5
I. Introduction
The Educational Master Plan is an essential document for a college’s strategic planning process. Along with the Vision, Mission, and Values, as well as the Strategic Directions, the Educational Master Plan (EMP) forms the foundation of a college’s five-year plan. The Vision, Mission, and Values distinguish the college by stating its purpose, intended population, and desired characteristics. The Strategic Directions, in response to the college’s current state of operations, identify priorities for fulfilling the college’s Mission within the guidelines of its Values.
An EMP provides a framework for implementing the Mission and Strategic Directions. Based on external and internal scans and the current plans of the college’s programs and areas, the EMP is a road map for academic and student-support programs for the upcoming five years. It sets specific objectives and measures for what the college is to be five years from now.
Of a college’s three master plans, the Educational Master Plan is central. Plans for the college’s academic and student support programs form the basis of the Facilities Master Plan (FMP) and Technology Master Plan (TMP). The FMP and TMP identify and plan for resources necessary to implement and fulfill the EMP.
Sections
The 2014-2019 Rio Hondo College EMP document consists of four sections: (1) Introduction, (2) External and Internal Scans, (3) Master Plan, and (4) Implications and Conclusions. The Introduction, the current section, provides an overview to the document and a brief history of the college.
The External and Internal Scans provide the evidence base for the Master Plan itself. This section addresses six topics: three looking outward and three looking inward. The three outward-looking chapters document the conditions under which the college provides academic and student services. These conditions are the characteristics of the college’s service area and its communities, community demographics and perceptions of the college, and employment-related information. The three inward-looking chapters capture the historic and current characteristics of the college. These chapters provide information on Rio Hondo’s student demographics, enrollment trends, and achievement.
The Master Plan, building on the scans, set the college’s educational directions and objectives for the next five years. The section begins with products of the college’s collaborative planning activities during 2013-2014 and recent years. These are the Values, Mission, and Vision; Institution-Set Standards; Strategic Directions; student-support and academic programs; and Institutional Goals and Objectives. The Strategic Directions provide the current status and five-year outlook specific to several programs and initiatives. The Master Plan section concludes with College Projections. These are projections for the college’s status in one, three, and five areas in terms of enrollment, student achievement, and budget. The fourth section, Implications and Conclusions, identifies links to the TMP and FMP. These links provide implications for developing technology and facilities in order to support the implementation and achievement of the EMP. This section also includes directions for refining the EMP in coming years.
2014-2019 EDUCATIONAL MASTER PLAN PAGE6
II. History of Rio Hondo College
Rio Hondo Community College District is a single-college district encompassing 65.5 square miles in southeastern Los Angeles County. The District contains nine cities, in whole or part, four distinct unincorporated communities, and a portion of another unincorporated community of Los Angeles County within our district boundaries. The cities include El Monte, South El Monte, Pico Rivera, Santa Fe Springs, and Whittier, as well as portions of Norwalk, Downey, La Mirada, and the City of Industry. The unincorporated communities include Los Nietos, East Whittier, South Whittier, West Whittier, and a portion of Avocado Heights.
The establishment of a Whittier-area junior college district was approved by voters through an election in October 1960. Because the initial geographical boundaries of the then “Whittier Junior College” were identical to those of the Whittier Union High School District, oversight of the college district was
managed by the high school Board of Trustees. Creation of the El Rancho Unified School District in 1962 required the college district to establish its own Board of Trustees, and an election for that purpose was held in April 1962. The newly elected Board of Trustees named Dr. Phil Putnam as the first
superintendent/president of the College in December 1962.
The Board of Trustees voted for the name “Rio Hondo” in May 1963. This name, long associated with the area near the Rio Hondo River, means “deep river.” A founding trustee noted that the image of a deep river or deep waters reflects the purpose of higher education—“a depth of educational
understanding.”
The college began offering classes at local public schools in September 1963. The hillside campus opened in September 1966 with an enrollment of 3,363 day and 2,682 evening students. Today, Rio Hondo College enrolls nearly 20,000 students per semester at the main campus and its three off-site locations. In May 1975, constituents of the El Monte Union High School District in South El Monte and the portion of El Monte south and east of the Rio Hondo River voted to join the Rio Hondo Community College District. With this addition, RHCCD established its permanent boundaries (see Exhibit II-1). The college expanded with three off-site centers. The college acquired the Santa Fe Springs Training Center (SFSTC) in 1997. This center is the primary instructional site for the Fire Academy, Fire
Technology, and Emergency Medical Technician programs. A 2004 bond issue funded the construction of the South Whittier Educational Center (SWEC) and the El Monte Educational Center (EMEC), which opened respectively in 2010 and 2013. These centers offer general and continuing education courses. Between its campus and the three centers, Rio Hondo currently enrolls approximately 20,000 students each semester.
2014-2019 EDUCATIONAL MASTER PLAN PAGE7
E
XTERNAL
&
2014-2019 RIO HONDO COLLEGE EDUCATIONAL MASTER PLAN PAGE9
III. Rio Hondo College Cities/Community
The Rio Hondo Community College District straddles two regions of Los Angeles County. To the north is the San Gabriel Valley, which includes the RHCCD cities of El Monte and South El Monte. To the south are communities associated with the Gateway Cities of southeastern Los Angeles County, which include the RHCCD cities of Pico Rivera, Santa Fe Springs, and Whittier. This chapter of the Educational Master Plan provides brief profiles of each city and two unincorporated communities south of the campus: South Whittier and West Whittier-Los Nietos.
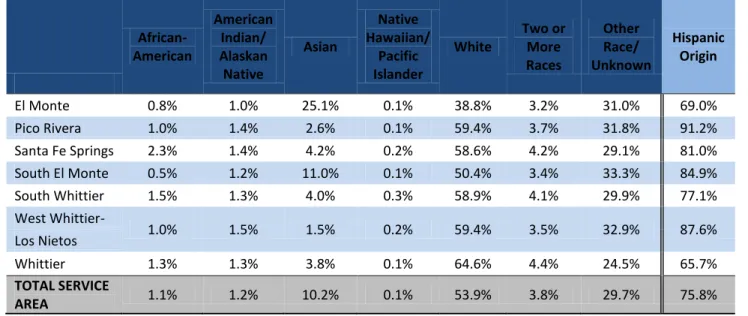
The following community profiles use race and origin data from the United States Census Bureau. The Census Bureau categorizes race in terms of five groups: Black or African American, American Indian or Alaska Native, Native Hawaiian or Other Pacific Islander, and White.1 Census results also include figures for “Two or More Races” and “Some Other Race.” The Census Bureau considers Hispanic to be an
“origin,” rather than a race. Thus, persons who identify as Hispanic or Latino/Latina may be of any race.2 Table III-1 and the community profiles report Hispanic origin as a distinct category, separate from race. The seven race categories total to 100% for each community; the Hispanic Origin column reflects the percentage of persons—irrespective of race—who identify as Hispanic.
Table III-1. Race and Hispanic Origin in RHCCD Communities
African-American American Indian/ Alaskan Native Asian Native Hawaiian/ Pacific Islander White Two or More Races Other Race/ Unknown Hispanic Origin El Monte 0.8% 1.0% 25.1% 0.1% 38.8% 3.2% 31.0% 69.0% Pico Rivera 1.0% 1.4% 2.6% 0.1% 59.4% 3.7% 31.8% 91.2% Santa Fe Springs 2.3% 1.4% 4.2% 0.2% 58.6% 4.2% 29.1% 81.0% South El Monte 0.5% 1.2% 11.0% 0.1% 50.4% 3.4% 33.3% 84.9% South Whittier 1.5% 1.3% 4.0% 0.3% 58.9% 4.1% 29.9% 77.1% West Whittier- 1.0% 1.5% 1.5% 0.2% 59.4% 3.5% 32.9% 87.6% Los Nietos Whittier 1.3% 1.3% 3.8% 0.1% 64.6% 4.4% 24.5% 65.7% TOTAL SERVICE AREA 1.1% 1.2% 10.2% 0.1% 53.9% 3.8% 29.7% 75.8%
Source: United States Census Bureau 2010
Cities
El Monte. The city’s 2010 population was 113,475. Its two largest racial groups were White (38.8%) and Asian (25.1%), with 69.0% of the population being of Hispanic/Latino ethnicity. The median age was 32.8 and the average family size was 4.2. Housing density was 3,013 dwellings per square mile, with 42.2% owner-occupied. The median household income was $41,861 and 22.8% lived below the federal poverty line. The percentage of residents 25 or older with a bachelor’s degree or higher was 11.7% and 47.9% of those 5 or older reported speaking English less than “very well.”
1
“About Race,” US Census Bureau, retrieved from http://www.census.gov/population/race/about/ on 5/29/2014.
2
2014-2019 RIO HONDO COLLEGE EDUCATIONAL MASTER PLAN PAGE10 El Monte was established in the 1850s and incorporated in 1912. The city has a branch of the Los
Angeles County Public Library. Its high school students primarily attend schools in the El Monte Union High School District. The Rio Hondo feeder high schools in El Monte are Arroyo, El Monte, and Mountain View. El Monte’s largest employer in 2012 was the El Monte City School District with 838 employees. Four of its top five employers were in the public sector (three school districts and City of El Monte). Led by Longo Toyota with 475 employees and San Gabriel Transit with 361 employees, six of the top ten employers were businesses.
Pico Rivera. The city’s 2010 population was 62,942. Its two largest racial groups were White (59.4%) and Asian (2.6%), with 91.2% of the population being of Hispanic/Latino ethnicity. The median age was 34.0 and the average family size was 4.1. Housing density was 1,926 dwellings per square mile, with 69.1% being owner-occupied. The median household income was $57,044 and 13.4% of the residents lived below the poverty level. The percentage of residents 25 or older with a bachelor’s degree or higher was 6.1% and 28.1% of those 5 and older reported speaking English less than “very well.”
Pico Rivera incorporated in 1958 with the merger of two unincorporated communities: Pico and Rivera. Two branches of the Los Angeles County Public Library are located in this city. Its students primarily attend schools of the El Rancho Unified School District and El Rancho High School is a Rio Hondo feeder high school. Pico Rivera’s largest employer in 2012 was the El Rancho Unified School District with 859 employees (which included some located outside the city). Two other public entities were among the top five employers (Los Angeles County Sheriff and City of Pico Rivera). Seven of the top ten were businesses, with four being major retailers (Wal-Mart, Target, Home Depot, Lowes).
Santa Fe Springs. The city’s 2010 population was 16,223. The two largest racial groups were White (58.6%) and Asian (4.2%) with 81.0% being of Hispanic/Latino ethnicity. The median age was 35.3 and the average family size was 3.8. Housing density was 58.2 per square mile with 61% being owner-occupied. The median household income was $54,551 and 8.4% of the residents lived below the federal poverty line. The percentage of residents 25 or older with a bachelor’s degree or higher was 10.1% and 22.6% reported speaking English less than “very well.”
Settled in the 1870s and established with an oil boom in the 1920, Santa Fe Springs was incorporated in 1957. The city has its own library. Its high school students primarily attend schools in the Whittier Unified School District and Santa Fe is a Rio Hondo feeder high school. Its two largest employers in 2012 were Vons Companies and McMaster-Carr Supply Company, with 762 and 736 employees respectively. Each of its top ten employers is a for-profit company.
South El Monte. The city’s 2010 population was 20,116. Its two largest racial groups were White (50.4%) and Asian (11.0%), with 84.9% of the population being of Hispanic/Latino ethnicity. The median age was 30.4 and the average family size was 4.5. Housing density was 1,653 units per square mile, with 48.3% being owner-occupied. The median household income was $48,056 and 20.6% of residents lived below the federal poverty line. The percentage of residents 25 or older with a bachelor’s degree or higher was 8.5% and 41.8% of those 5 and older reported speaking English less than “very well.”
South El Monte was settled in the 1860s and incorporated in 1958. A branch of the Los Angeles County Public Library is located in this city. Its high school students attend South El Monte High, which is part of the El Monte Union High School District and a Rio Hondo feeder. The city website states that South El Monte has become “a viable commercial and industrial base, with over 2,400 businesses.” South El
2014-2019 RIO HONDO COLLEGE EDUCATIONAL MASTER PLAN PAGE11 Monte does not publish a list of its major employers, but an independent website lists International Medication Systems (Amphastar Pharmaceuticals), Plastic Dress-Up Company, Lawrence Equipment, and Vacco Industries as among its major employers. A city report listed the three industry groups producing the most sales tax revenue in the third quarter of 2013 as Business and Industry, Fuel and Service Stations, and Building and Construction.
Whittier. The city’s 2010 population was 85,331. Its two largest racial groups are White (64.6%) and Asian (3.8%), with 65.7% of the population being of Hispanic/Latino ethnicity. The median age is 35.4 years and the average family size is 3.5. Housing density is 2,018 units per square mile, with 57.3% being owner-occupied. The median household income $67,417 and 11.2% of the residents live below the federal poverty line. The percentage of residents 25 or older with a bachelor’s degree or higher was 24.5% and 14.3% of those 5 and older reported speaking English less than “very well.”
Whittier was founded in 1887 and incorporated in 1898. The city has its own library system, including a branch in East Whittier. Most of Whittier’s high school students attend schools in the Whittier Union High School District. Two RHC feeder high schools are located within incorporated Whittier: La Serna and Whittier. Whittier’s largest employer in 2012 was the Interhealth Corporation (PIH Health) with 2,600 employees. Eight of the top 10 employers were either in health care (e.g., Whittier Medical Center) or the public sector (e.g., Whittier Union High School District, U.S. Postal Service). Two of the top ten were businesses: Ralphs Grocery and Johnson Controls, each with fewer than 300 employees.
Census Designated Places
Census-Designated Places (CDPs), as defined by the United States Census Bureau, are “settled
concentrations of population that are identifiable by name but are not legally incorporated.” They serve as “statistical counterparts of incorporated places” (e.g., a city). Two CDPs are located within the RHCCD boundaries: South Whittier and West Whittier-Los Nietos. Although each has “Whittier” in its name, these CDPs are distinct places outside the city limits.
South Whittier. South Whittier is bounded by Whittier on the northeast, La Mirada on the southeast, and Santa Fe Springs on the west. Its 2010 population was 57,156. This CDP’s two largest racial groups were White (58.9%) and Asian (4.0%), with 77.1% of the population being of Hispanic/Latino ethnicity. The median age was 32.0 and the average family size was 4.1. Housing density was 2,918 units per square mile, with 63.5% being owner-occupied. The median household income was $65,815 and 11.4% of the population lived below the federal poverty line. The percentage of residents 25 or older with a bachelor’s degree or higher was 13.0% and 23.2% of those 5 and older reported speaking English less than “very well.”
South Whittier is the location of a Los Angeles County Public Library branch and the Los Angeles County Sheriff’s STARS Center. The South Whittier School District has six elementary schools and one middle school. California High, which is part of the Whittier Union High School District and a Rio Hondo feeder, is located in South Whittier.
West Whittier-Los Nietos. West Whittier-Los Nietos is bounded by Whittier on the northeast, Santa Fe Springs on the south, and Pico Rivera on the northwest. Its 2010 population was 25,540. The CDP’s three largest racial groups were White (59.4%), Asian (1.5%) and Native American (1.5%), with 87.6% of the population being of Hispanic/Latino ethnicity. The median age was 33.7 years and the average family
2014-2019 RIO HONDO COLLEGE EDUCATIONAL MASTER PLAN PAGE12 size was 4.1. Housing density was 2,748.2 units per square mile, with 73.1% being owner-occupied. The median household income was $60,525 and 9.4% of the residents lived below the poverty line. The percentage of residents 25 or older with a bachelor’s degree or higher was 10.3% and 24.5% of those 5 and older reported speaking English less than “very well.”
West Whittier-Los Nietos is the location of two Los Angeles County Public Library branches. It is served by the Los Nietos School District (California’s oldest school district) and the Whittier City School District. Pioneer High, which is part of the Whittier Union High School District and a Rio Hondo feeder, is located in West Whittier-Los Nietos.
2014-2019 RIO HONDO COLLEGE EDUCATIONAL MASTER PLAN PAGE13
IV. Community Information
Community Demographics
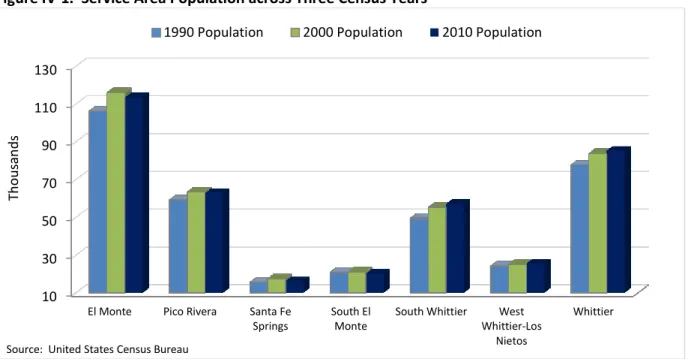
The service area of the college is comprised of seven communities. Five of these areas are cities (El Monte, Pico Rivera, Santa Fe Springs, South El Monte, and Whittier) and two are designated by the Census Bureau as Census Designated Places (CDP), or unincorporated areas overseen by the county. The two CDPs are South Whittier and West Whittier-Los Nietos. Figure IV-1 presents the population of these service area communities across three census years spanning 20 years. Of note, South Whittier has seen the largest positive population shift, growing about 15% across the 20-year span. The city of Whittier has also seen a 10% rise in population.
Figure IV-1. Service Area Population across Three Census Years
The combined population of the seven communities increased by 8.2% (from 353,105 to 381,977) between 1990 and 2000. The combined population decreased by 0.3% (from 381,977 to 380,783) between 2000 and 2010. Overall, the seven communities had 27,678 more residents in 2010 than in 1990.
Demographics
Ethnicity. For the college to develop and maintain programs that are responsive to community needs, it is necessary to see the ethnic distributions of the communities it serves. Table IV-2 displays these distributions as determined by the 2010 Census. The categories are aligned to those reported by the state Chancellor’s Office.
10 30 50 70 90 110 130
El Monte Pico Rivera Santa Fe Springs
South El Monte
South Whittier West Whittier-Los Nietos Whittier Th o u san d s
1990 Population 2000 Population 2010 Population
2014-2019 RIO HONDO COLLEGE EDUCATIONAL MASTER PLAN PAGE14
Table IV-2. Ethnic Distribution of RHCCD Communities
African-American American Indian/ Alaskan Native
Asian Filipino
Multi-Ethnicity White Unknown
El Monte 0.8% 1.0% 23.9% 1.2% 3.7% 38.8% 31.0% Pico Rivera 1.0% 1.4% 1.3% 1.2% 4.2% 59.4% 31.8% Santa Fe Springs 2.3% 1.4% 2.6% 1.6% 3.4% 58.6% 29.1% South El Monte 0.5% 1.2% 10.5% 0.4% 4.1% 50.4% 33.3% South Whittier 1.5% 1.3% 2.0% 2.0% 3.5% 58.9% 29.9% West Whittier- 1.0% 1.5% 0.8% 0.7% 4.4% 59.4% 32.9% Los Nietos Whittier 1.3% 1.3% 2.8% 1.0% 3.8% 64.6% 24.5% TOTAL SERVICE AREA 1.1% 1.2% 9.0% 1.2% 3.2% 53.9% 29.7%
Source: United States Census Bureau 2010
The Chancellor’s Office includes Hispanic as an ethnic group in its total distribution of ethnicity demographics. The Census Bureau, however, reports the above groups as races while distinguishing Hispanic as an origin. Figure IV-3 displays the percentage distribution of Hispanic residents in the seven communities served by the college.
Figure IV-3. Percentage of Hispanic Residents in RHCCD Communities
The table and chart display several characteristics in the ethnicity data. El Monte (24%) and South El Monte (11%) have the largest Asian populations. Whittier has the largest White population (65%) and lowest Hispanic population (66%). While all of the RHC communities are largely Hispanic, the three communities above the median for Hispanic population are Pico Rivera (91%), West Whittier-Los Nietos
0% 20% 40% 60% 80% 100%
El Monte Pico Rivera Santa Fe Springs South El Monte South Whittier West Whittier-Los Nietos Whittier 69% 91% 81% 85% 77% 88% 66%
2014-2019 RIO HONDO COLLEGE EDUCATIONAL MASTER PLAN PAGE15 (885), and South El Monte (85%). The percentages of persons in the African-American, American
Indian/Alaskan Native, Filipino, Multi-Ethnicity, and Unknown groups are generally similar across the seven communities.
Age and Gender. The age and gender demographics are also important measures for the college to consider in planning that is responsive to the communities it serves. Table IV-4 and Figure IV-5 present this information.
Table IV-4. Age Distribution for Residents in RHCCD Service Area Communities
19 yrs or less 20 to 24 yrs 25 to 29 yrs 30 to 34 yrs 35 to 39 yrs 40 to 49 yrs 50 + yrs El Monte 32% 8% 8% 7% 7% 14% 25% Pico Rivera 30% 8% 7% 7% 7% 14% 28% Santa Fe Springs 30% 8% 6% 6% 7% 14% 30% South El Monte 33% 8% 8% 8% 7% 13% 23% South Whittier 32% 8% 7% 7% 7% 14% 24% West Whittier - Los Nietos 30% 7% 7% 7% 7% 13% 28% Whittier 29% 7% 7% 7% 7% 14% 29%
Source: United States Census Bureau, 2010
Figure IV-5. Gender Distribution for Residents in RHCCD Service Area Communities
Age distributions are generally consistent across the seven communities. Where there are differences between communities, they are typically at the opposite ends of the figure (19 years or less, 50+ years). South El Monte (33%), El Monte (32%), and South Whittier (32%) are higher in the 19 or less category,
50% 49% 48% 50% 50% 49% 48% 50% 51% 52% 50% 50% 51% 52% 0% 10% 20% 30% 40% 50% 60% 70% 80% 90% 100% El Monte Pico Rivera Santa Fe Springs South El Monte South Whittier West Whittier -Los Nietos Whittier city Male Female
2014-2019 RIO HONDO COLLEGE EDUCATIONAL MASTER PLAN PAGE16 while Santa Fe Springs (30%) and Whittier (29%) are higher in the 50+ category. As seen in Section III, the median age in South El Monte (30.4 years) is about 5 years below those in Whittier (35.4 years) and Santa Fe Springs (35.3 years).
Gender distributions are generally even in each community. In Santa Fe Springs and Whittier, though, the percentages of female residents approach 52%.
School Districts
A total of 11 school districts serve K-12 students within RHCCD’s boundaries. There are eight elementary districts: East Whittier City, El Monte City, Little Lake City (in Santa Fe Springs), Los Nietos, Mountain View (in El Monte), South Whittier, Valle Lindo (in South El Monte), and Whittier City. There is one unified district (El Rancho—ERUSD) and two high school districts (El Monte Union—EMUHSD and Whittier Union—WUHSD).
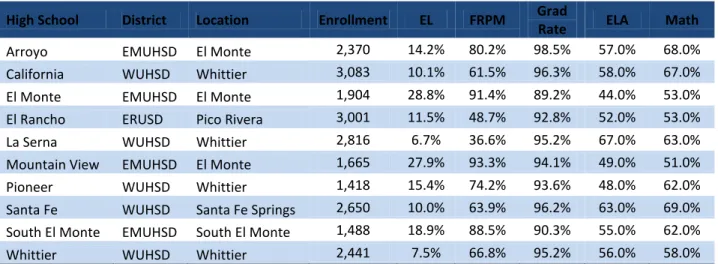
Ten (10) comprehensive high schools serve the RHCCD community. These range in size from Pioneer (WUHSD) at 1,418 students to California (WUHSD) at 3,083 students. Table IV-6 displays profile information on each of these high schools. Among these schools, El Monte (EMUHSD) and Mountain View (EMUHSD) stand out due to high percentages of students classified as English Learners (EL) and qualifying for free/reduced-price meals (FRPM). Note: A fifth comprehensive high school in EMUHSD, Rosemead High School, is not within the RHCCD boundaries.
Table IV-6. Profile Information for High Schools within RHCCD Boundaries (2012-13)
High School District Location Enrollment EL FRPM Grad
Rate ELA Math Arroyo EMUHSD El Monte 2,370 14.2% 80.2% 98.5% 57.0% 68.0% California WUHSD Whittier 3,083 10.1% 61.5% 96.3% 58.0% 67.0% El Monte EMUHSD El Monte 1,904 28.8% 91.4% 89.2% 44.0% 53.0% El Rancho ERUSD Pico Rivera 3,001 11.5% 48.7% 92.8% 52.0% 53.0% La Serna WUHSD Whittier 2,816 6.7% 36.6% 95.2% 67.0% 63.0% Mountain View EMUHSD El Monte 1,665 27.9% 93.3% 94.1% 49.0% 51.0% Pioneer WUHSD Whittier 1,418 15.4% 74.2% 93.6% 48.0% 62.0% Santa Fe WUHSD Santa Fe Springs 2,650 10.0% 63.9% 96.2% 63.0% 69.0% South El Monte EMUHSD South El Monte 1,488 18.9% 88.5% 90.3% 55.0% 62.0% Whittier WUHSD Whittier 2,441 7.5% 66.8% 95.2% 56.0% 58.0%
Source: Ed-Data (Education Data Partnership), 4/29/2014
Note: EL=English Learners, FRPM=Free/Reduced-Price Meals, Grad Rate=4 Year Adjusted Cohort Graduation Rate, ELA=10th Graders Proficient & Above on CAHSEE English-Language Arts, Math=10th Graders Proficient & Above on CAHSEE Mathematics. Figures for FRPM and Grade Rate in 2012-13 are not yet available.
Community Perceptions
Between March and May 2012, the college held a Community Educational Forum in each of its five trustee areas. The events provided community members, especially parents of high school students, with an opportunity to learn more about Rio Hondo College and new state recommendations promoting student success. The college also gathered feedback from participants through a survey, roundtable discussions, and an institutional implications activity. All activities were conducted in both English and Spanish.
2014-2019 RIO HONDO COLLEGE EDUCATIONAL MASTER PLAN PAGE17 Across the five forums, a total of 237 persons completed surveys forms. Almost two-thirds (66.1%) identified themselves as parents. Other substantial groups within the population were high school students (21.0%) and community members (10.7%). The balance of survey respondents identified as current RHC students (2.2%) or “other” (3.4%). (Because some respondents chose more than one category, the sum is greater than 100%.)
Figure IV-7. Types of Survey Respondents
The survey included items on priorities for the college, importance of factors in a family’s decision to attend Rio Hondo, level of interest in specific fields of study, and time preferences for course offerings. Respondents could choose four of eight potential priorities for the college. Four options were chosen by more than 50% of the respondents: “career and transfer classes for students who are college ready” (77.6%), “basic skills and remediation to help students become college ready” (63.7%), “provide services to help students focus on completion and graduation” (62.2%), and “increase collaboration between local school districts (K-12) and Rio Hondo College” (55.7%). The four options chosen by fewer than 50% of the respondents were “provide counseling services for high school students” (49.8%), “increase college courses held at off-site locations” (46.3%), “give priority registration to new high school graduates” (35.8%), and “lifelong learning opportunities” (24.9%). (These percentages reflect the fact that some respondents chose more than four options.)
Figure IV-8. Rankings of Institutional Priorities
Parent Current RHC Student High School Student Community Member Other 66.1% 2.2% 21.0% 10.7% 3.4% Career and transfer classes for students who are college ready. Basic skills and remediation to help students become college ready. Provide counseling services for high school students. Provide services to help students focus on completion and graduation. Give priority registration to new high school graduates. Increase collaboration between local school districts (K-12) and Rio Hondo College. Increase college courses held at off-site locations. Lifelong learning opportunities. 77.6% 63.7% 49.8% 62.2% 35.8% 55.7% 46.3% 24.9%
2014-2019 RIO HONDO COLLEGE EDUCATIONAL MASTER PLAN PAGE18 Respondents rated nine items on “how important the following would be in your family’s decision to attend Rio Hondo College.” They used a 1-to-5 scale with 1 meaning “Not at all Important,” 3 meaning “Somewhat Important, and 5 meaning “Very Important.” The two top-rated items were “counseling support to help achieve educational goals” (4.7) and “the availability of financial aid” (4.7). The two items with rating below 4.0 were “the number of free events offered to the community (for example family events and performances)” (3.8) and “availability of ESL courses offered” (3.7). Ratings for each of the nine items are in Figure IV-9.
Figure IV-9. Importance of Item for Family’s Decision to Attend Rio Hondo College
Respondents also rated their level of interest in three specific fields of study. They used a 1-to-5 scale with 1 meaning “Not at all Interested,” 3 meaning “Somewhat Interested, and 5 meaning “Very Interested.” Each of the three fields received an average rating above 4.0: 4.06 for “Health Professions (for example Dental Hygiene, Cardiovascular, Physical Therapy, X-Ray Tech, etc.),” 4.23 for “Sciences (for example Biotechnology, Technical Math, etc.),” and 4.19 for “Technology (for example Software
Developer, Database Administrator, etc.).” For each of these fields, more than half of the respondents marked “Very Important.”
Roundtable discussion results. Forum participants gathered in groups to discuss six questions related to the college’s institutional priorities. Although the opinions expressed in these roundtable discussions are not amenable to being quantified, it was evident that participants generally supported four of the six priorities (“Should we maintain our commitment to offer courses in the community?” “Should we continue to offer college courses for High School students at school sites?” “Should we continue to offer online courses?” “Should we partner with K-12 to reduce the need for remediation?”). Responses to two questions displayed mixed opinions (“Should we give funding priority to remediation/basic skills, or to career transfer courses?” “Should we continue to offer lifelong courses in the community?).
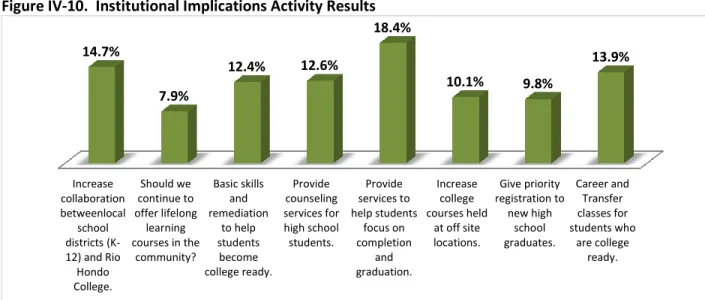
Institutional implications activity results. For this activity, participants voted on eight institutional priorities. RHC staff posted the eight priorities around the meeting room and participants used paper dots to cast their votes for the most important ones. Participants cast a total of 868 votes. The three highest rated priorities were “Provide services to help students focus on completion and graduation” (160 votes), “Increase collaboration between local school districts (K-12) and Rio Hondo College (128
Ability to take classes offered in my community. Ability to take classes on the Rio Hondo main campus. Availability of ESL courses offered. The number of free events offered to the community (e.g., family
events and performances).
The availability of financial aid. Counseling support to help achieve educational goals. One time priority course registration for new students. The availability of transportation. The availability of Career Technical Education programs.
4.38 4.24 3.65 3.76 4.69 4.74 4.34 4.07 4.25
2014-2019 RIO HONDO COLLEGE EDUCATIONAL MASTER PLAN PAGE19 votes), and “Career and Transfer classes for students who are college ready” (121 votes). The priority with the least votes was “Should we continue to offer lifelong learning courses in the community?” (69 votes). The numbers of votes for each priority are displayed in Figure IV-10. (Note: The “Career and Transfer classes for students who are college ready” priority was not available at the first forum
meeting. Had those participants at the first forum been able to vote for this priority, it likely would have been the second highest in total votes.)
Figure IV-10. Institutional Implications Activity Results
Different priorities were popular in different trustee areas. In Area 1 (El Monte), the clear favorite was “Provide services to help students focus on completion and graduation.” In Trustee Area 2 (Pico Rivera), there were four priorities tightly clustered with the most votes: “Increase collaboration between local school districts (K-12) and Rio Hondo College,” “Basic skills and remediation to help students become college ready,” “Increase college courses held at offsite locations,” and “Career and Transfer classes for students who are college ready.” Results for Area 3 (South El Monte and northwestern Whittier) showed two priorities at the top of the voting: “Basic skills and remediation to help students become college ready” and “Provide services to help students focus on completion and graduation.” The priority receiving the most votes in Area 4 (Los Nietos, Santa Fe Springs, South Whittier, West Whittier and North Norwalk) was “Career and Transfer classes for students who are college ready.” In Area 5 (East Whittier, South Whittier), two priorities were at the top: “Increase collaboration between local school districts (K-12) and Rio Hondo College” and “Provide services to help students focus on completion and graduation.”
Summary. The purposes of these Community Educational Forums were to inform the community members about Rio Hondo College and solicit feedback from the community. The methods for gathering data were not designed to produce conclusive results that are generalizable to RHCCD community. Still, themes in participants’ responses do address priorities for the college to consider.
Six priority topics received positive responses across different data-collection activities. In no particular order, these were career and transfer classes for students who are college ready, services to help students focus on completion and graduation, counseling support to help achieve educational goals, collaboration between local K-12 districts and the college, offering courses in the community, and basic skills and remediation to help students become college ready.
Increase collaboration betweenlocal school districts (K-12) and Rio Hondo College. Should we continue to offer lifelong learning courses in the community? Basic skills and remediation to help students become college ready. Provide counseling services for high school students. Provide services to help students focus on completion and graduation. Increase college courses held at off site locations. Give priority registration to new high school graduates. Career and Transfer classes for students who are college ready. 14.7% 7.9% 12.4% 12.6% 18.4% 10.1% 9.8% 13.9%
2014-2019 RIO HONDO COLLEGE EDUCATIONAL MASTER PLAN PAGE20
V. Community Economic & Employment Information
A primary purpose of a community college is to serve as an economic engine for its service area and state. A community college provides programs and services to support community members in
developing their employment potential. This includes young persons preparing to enter the workforce, currently employed persons attempting to advance, and currently unemployed persons working to reenter the workforce. As these community members achieve more of their employment potential and increase their income, they strengthen the local economy through making purchases and increasing the tax base.
Among the many expectations students bring to a community college, one is to improve their
employability. They expect to leave the college with new knowledge and skills that will allow them to improve their place in the workforce and increase their financial stability. This applies to both career-technical and transfer-oriented students.
This chapter of the External and Internal Scans addresses Rio Hondo’s economic and employment context. It begins with a summary of the state and local economic outlook. This is followed by a review of labor market information for the college’s service area. Finally, there is a competitive scan of career-technical education programs offered by neighboring community colleges.
State and Local Economic Outlook
This Educational Master Plan comes at a transitional time for the funding of California’s community colleges. The 2008 recession took a toll on the state and its community colleges. The state budget had a $41.6B structural shortfall in 2009-10 and the community colleges endured five fiscal years without a cost-of-living adjustment. In a joint statement, the California Community Colleges Chancellor’s Office and Community College League of California described these years as a time of “access lost;
programmatic disinvestment; [and] increasing costs.” Despite suffering budget cuts that led to course cuts, Rio Hondo College maintained fiscal stability and appropriate reserves through a conservative approach to budgeting.
The California economy is now growing at a slow but steady pace, the state has a balanced budget, and the 2013-2014 academic year was the first in five years without the threat of cuts from the state. The State of California Legislative Analyst’s Office (LAO) projects similar progress through the years of the Educational Master Plan (2014-2019). In The 2014-15 Budget: California’s Fiscal Outlook, published in November 2013, the LAO projected the state’s annual budget surplus to increase until 2018 (with the sunset of Proposition 30) and then remain relatively stable at almost $10M through 2020. The LAO projects annual increases in spending for education and health and social services during the coming years, ranging from a high of 4.8% in 2014-2015 to a low of 1.5% in 2018-2019. Funding for Proposition 98 (the major source of funds for California’s elementary schools, secondary schools, and community colleges) is expected to increase by 4.1% in 2014-2015 and continuing growth beyond 2018- 2019. Based on projections from the Governor’s office, the LAO, and other sources, analysts close to the state’s community colleges have offered cautiously optimistic outlooks for funding through at least 2019. Quoting official documents from the state government, the California Community Colleges Chancellor’s Office and Community College League of California Budget Webinar of January 2013 predicted “modest to steady growth over the next 5 years” (p. 10) and “community college funding will grow significantly over the next several years” (p. 16). The School Services of California “Financial
2014-2019 RIO HONDO COLLEGE EDUCATIONAL MASTER PLAN PAGE21 Projection Dartboard” also indicates that apportionments should continue to increase during the course of this EMP. Although different forecasts may vary, relatively conservative estimates indicate increases of between 2% and 3% in each of the coming years. This rate of increase will be assumed as part of this EMP.
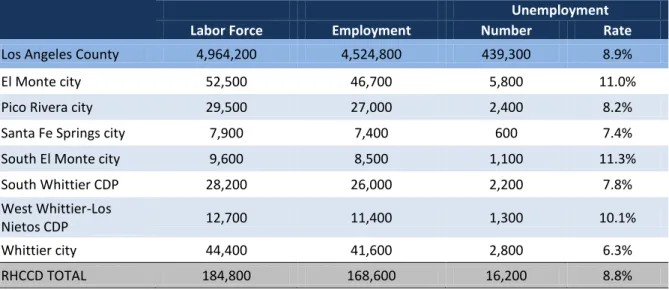
Unemployment figures in the RHCCD are very similar to that of Los Angeles County as a whole. According to the State of California Employment Development Department (EDD), the February 2014 unemployment rate was 8.9% for Los Angeles County and 8.8% for the seven RHCCD communities. As Table V-1 indicates there are differences in unemployment across the district, with incorporated Whittier having the lowest unemployment rate (6.3%) and El Monte and South El Monte having
unemployment rates of 11.0% or above. The West Whittier—Los Nietos community joins the latter two cities as being the three places within the RHCCD service area that have unemployment rates above that of the county.
Table V-1. Labor Force Data for Cities and Census Designated Places (CDP) – February 2014 Preliminary
Unemployment Labor Force Employment Number Rate
Los Angeles County 4,964,200 4,524,800 439,300 8.9%
El Monte city 52,500 46,700 5,800 11.0%
Pico Rivera city 29,500 27,000 2,400 8.2%
Santa Fe Springs city 7,900 7,400 600 7.4%
South El Monte city 9,600 8,500 1,100 11.3%
South Whittier CDP 28,200 26,000 2,200 7.8%
West Whittier-Los
Nietos CDP 12,700 11,400 1,300 10.1%
Whittier city 44,400 41,600 2,800 6.3%
RHCCD TOTAL 184,800 168,600 16,200 8.8%
Source: State of California, Employment Development Department Note: These data are not seasonally adjusted.
Employment & Industry Projections
The development of an Educational Master Plan in times of economic and budgetary growth provides the college with an opportunity to consider the expansion and addition of academic programs. This portion of Chapter V is a review of industry and employment projections for the RHCCD area. Although projections may differ by source and geographic area, they combine to identify some clear prospects for growth.
In its 2010-2020 Los Angeles County Projection Highlights, the State of California Economic Development Department predicted growth of more than 590,000 non-farm jobs in the county. Almost three-quarters of that growth will be in four industry sectors: (1) educational services, health care, and social assistance (138,000 jobs); (2) professional and business services (113,100); (3) leisure and hospitality (95,200); and (4) retail trade (75,500). The three occupations predicted to have the most job openings over this time period are retail salespersons, cashiers, and personal care aides.
2014-2019 RIO HONDO COLLEGE EDUCATIONAL MASTER PLAN PAGE22 Although there are prospects for substantial job growth in Los Angeles County over the years of this Educational Master Plan, the EDD predicts that the large majority of these openings will be in lower-skilled occupations, which do not require a college education. Of an annual amount of 162,120 job openings, 114,590 (71%) will require a high school diploma or less. Positions requiring an AA/AS, certificate, or some college will comprise 14,080 (9%) of projected job openings. Positions requiring a bachelor’s degree or higher will account for 33,450 (21%) of projected job openings.
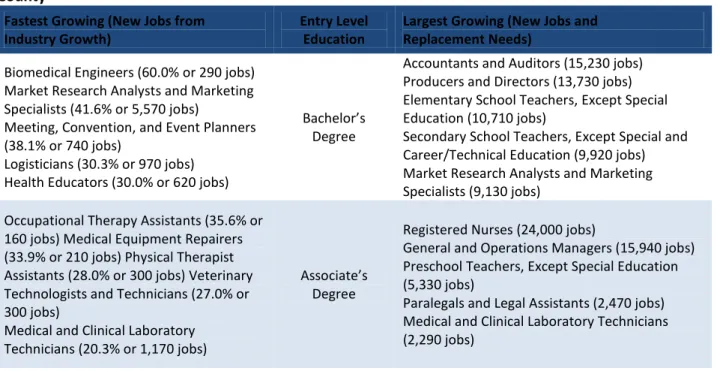
Despite the trend toward job growth in occupations not requiring a college education, there are fast-growing occupations requiring various level of post-secondary education (see Table V-2). Considering new and replacement jobs in Los Angeles County between 2010 and 2020, the EDD predicts six occupations will each produce more than 10,000 job openings: (1) registered nurses (24,000 jobs); (2) general and operations managers (15,940 jobs); (3) accountants and auditors (15,230 jobs); (4) producers and directors (13,730 jobs); (5) nursing aides, orderlies, and attendants (13,050 jobs); (5) elementary school teachers, except special education (10,710 jobs); and (6) licensed practical and licensed vocational nurses (10,340 jobs). Each of these occupations is in a field in which RHC offers an associate’s degree and/or certificate. Other high-growth occupations in which RHC can currently contribute to a student’s occupational development include secondary school teachers, except special and career/technical education (9,920 jobs); market research analysts and marketing specialists (9,130 jobs); computer support specialists (6,810 jobs); and preschool teachers, except special education (5,330 jobs).
Table V-2. 2010-2020 Comparison of Growing Occupations by Entry Level Education, Los Angeles County
Fastest Growing (New Jobs from Industry Growth)
Entry Level Education
Largest Growing (New Jobs and Replacement Needs)
Biomedical Engineers (60.0% or 290 jobs) Market Research Analysts and Marketing Specialists (41.6% or 5,570 jobs) Meeting, Convention, and Event Planners (38.1% or 740 jobs)
Logisticians (30.3% or 970 jobs) Health Educators (30.0% or 620 jobs)
Bachelor’s Degree
Accountants and Auditors (15,230 jobs) Producers and Directors (13,730 jobs) Elementary School Teachers, Except Special Education (10,710 jobs)
Secondary School Teachers, Except Special and Career/Technical Education (9,920 jobs) Market Research Analysts and Marketing Specialists (9,130 jobs)
Occupational Therapy Assistants (35.6% or 160 jobs) Medical Equipment Repairers (33.9% or 210 jobs) Physical Therapist Assistants (28.0% or 300 jobs) Veterinary Technologists and Technicians (27.0% or 300 jobs)
Medical and Clinical Laboratory Technicians (20.3% or 1,170 jobs)
Associate’s Degree
Registered Nurses (24,000 jobs)
General and Operations Managers (15,940 jobs) Preschool Teachers, Except Special Education (5,330 jobs)
Paralegals and Legal Assistants (2,470 jobs) Medical and Clinical Laboratory Technicians (2,290 jobs)
2014-2019 RIO HONDO COLLEGE EDUCATIONAL MASTER PLAN PAGE23
Continued Table V-2.
Fastest Growing (New Jobs from Industry Growth)
Entry Level Education
Largest Growing (New Jobs and Replacement Needs)
Emergency Medical Technicians and Paramedics (43.5% or 1,540 jobs)
Licensed Practical and Licensed Vocational Nurses (27.8% or 5,270 jobs)
Nursing Aides, Orderlies, and Attendants (25.9% or 8,710 jobs)
Medical Records and Health Information Technicians (22.3% or 1,100 jobs) Skincare Specialists (21.9% or 600 jobs)
Postsecondary Non-degree
Award
Nursing Aides, Orderlies, and Attendants (13,050 jobs)
Licensed Practical and Licensed Vocational Nurses (10,340 jobs) Dental Assistants (3,630 jobs)
Hairdressers, Hairstylists, and Cosmetologists (3,380 jobs) Firefighters (2,710 jobs)
Source: State of California, Employment Development Department
The EDD also provided projections for the fastest growing occupations in the “Los Angeles-Long Beach-Glendale Metropolitan Division.” As evidenced in Figure V-3, the fastest growth will be in the allied health field. Each of the six fastest-growing positions requiring a certificate or associate’s degree is in allied health. RHC currently offers certificates in two occupations requiring certificates (emergency medical technicians and paramedics, licensed practical and licensed vocational nurses). RHC does not currently offer programs for the occupations requiring associate’s degrees (occupational therapy assistants, medical equipment repairers, physical therapist assistants, veterinary technologists and technicians).
Figure V-3. Fastest Growing Occupations in Los Angeles County - Percent Change from 2010 to 2020 (Associate Degrees and Post-Secondary Certificates)
Source: State of California, Employment Development Department
This analysis also identified 12 fastest growing occupations requiring a bachelor’s degree (Table V-4). Some of these occupations (e.g., market research analysts and marketing specialists, logisticians,
Emergency Medical Technicians & Paramedics (Certificate)
Licensed Practical & Licensed Vocational Nurses (Certificate)
Occupational Therapy Assistants Medical Equipment Repairers Physical Therapist Assistants Veterinary Technologists & Technicians
44% 28% 36% 34% 28% 27%
2014-2019 RIO HONDO COLLEGE EDUCATIONAL MASTER PLAN PAGE24 environmental engineers) are closely aligned with current RHC programs. Other occupations provide potential opportunities for adding new programs or adapting current programs.
Table V-4. Fastest Growing Occupations in Los Angeles County (Bachelor’s Degrees)
Occupational Title Employment % Change
2010 to 2020
Biomedical Engineers 60%
Market Research Analysts/Marketing Specialists 42% Meeting, Convention, & Event Planners 38%
Logisticians 30%
Health Educators 30%
Training & Development Specialists 30% Vocational Education Teachers, Postsecondary 29%
Cost Estimators 29%
Credit Analysts 28%
Museum Technicians & Conservators 28% Agents/Business Managers of Artists, Performers & Athletes 28%
Environmental Engineers 27%
Source: State of California, Employment Development Department
The Rio Hondo campus is located at the junction of two distinct areas within Los Angeles County. To the north is the San Gabriel Valley; to the south are communities associated with the Gateway cities of Southeast Los Angeles County. Within recent years, the Los Angeles County Economic Development Corporation (LAEDC) conducted economic analysis for each of these areas.
Published in 2012, the San Gabriel Valley Economic Forecast & Regional Overview presented on a 30-city area, including the RHCCD cities of El Monte and South El Monte. Between 2001 and 2011, the health services industry emerged as the San Gabriel Valley’s (SGV) foremost source of jobs. In 2011 alone, this industry added 2,263 new jobs to the SGV. Overall, 9 or 14 industries saw job growth in 2011. Other industries showing large job growth in the SGV during 2011 were wholesale trade (1,252 jobs), leisure and hospitality (776 jobs), public administration (773 jobs), and transportation and utilities (627 jobs). The report also noted other industries showing potential for job growth in the coming years. These included medical device and biomed firms, professional and business services, food processing, aerospace contractors, metal product fabricators, and travel and tourism.
The SGV is home to many colleges and universities. Cal Tech and Cal Poly Pomona, the report states, are of particular note in contributing to the development of green technologies. Still, the LAEDC reports a skills gap in the area.
Many in the local business community report they cannot find workers with the necessary skill sets to fill the kinds of jobs being created in the Valley. Business leaders, universities and community colleges need to work together to close this “skills gap.” Boosting educational attainment is a clear imperative for the medium- and long-run health of the economy (p. 15).
2014-2019 RIO HONDO COLLEGE EDUCATIONAL MASTER PLAN PAGE25 In 2010, the LAEDC produced Industry Clusters, Employment Forecast, Target Industries and Occupation Analysis for SASSFA (Southeast Area Social Services Funding Authority). This report captured economic and employment conditions in the five RHCCD communities south of the campus (Pico Rivera, Santa Fe Springs, South Whittier, West Whittier – Los Nietos, and Whittier), as well as three neighboring
communities.
Over half (52.1%) of the jobs in this area were in five occupations groups. These were office and administrative support occupations (810,200), sales and related occupations (415,400), food preparation and serving related occupations (323,940), production occupations (316,470), and transportation and material moving occupations (297,860).
This report also provided employment analysis by industry. It identified five industry clusters as the major sources of employment in the area: (1) materials and machinery (14,777 jobs), (2) wholesale trade (14,240 jobs), (3) retail trade (10,818), (4) health services and biomedical (10,486 jobs), and (5)
construction (9,246 jobs). LAEDC also applied “location quotient” to determine which industries were most concentrated in the area. The top three were paper manufacturing, primary metals manufacturing, and warehousing and storage. LAEDC also identified several industry sectors having both potential for employment growth and positions requiring a “community college education or technical training.” These were professional, scientific and technical services; health care (ambulatory health care, hospitals and nursing and residential care); and manufacturing (selected products).
These two LAEDC reports highlight two trends in RHCCD’s employment environment. First, there are growth industries in Los Angeles County that are also displaying growth in and around the RHCCD service area. These include health care, business and professional services, wholesale trade, and retail trade. Second, there are industries that are not growing throughout Los Angeles County, but are
growing in and around the RHCCD service area. These include metals manufacturing, medical device and biomed, and food processing.
Educational Scan
Rio Hondo College does not operate in isolation. The greater Los Angeles area has many community colleges offering similar programs and students have several options for enrollment. Many students take classes at multiple community colleges, sometimes sequentially and sometimes simultaneously.
A thorough Educational Master Plan must include consideration of the programs offered at nearby community colleges. Program availability is an important factor in decisions to expand or add programs. This part of Chapter V features a scan of program offerings at nearby community colleges. As
complementary to the employment scan, this scan identifies areas where “competition” might interfere with program development. Data for this scan came from CCCCO Curriculum Inventory and covers nine neighboring colleges: Cerritos, Citrus, Cypress, East Los Angeles, Fullerton, Los Angeles Trade-Tech, Long Beach City, Mount San Antonio, and Pasadena.
Although most of Rio Hondo’s programs are also offered at many neighboring colleges, some are offered by only a few (if any) nearby colleges (see Table V-5). Those RHC programs offered at the degree or certificate level by three or fewer community colleges are environmental science, environmental technology, management and supervision, logistics management, mass communications (mass media), fitness specialist, alternative energy technology, heavy equipment maintenance specialist, alternative fuels and advanced transportation technology, civil design and drawing, photography, philosophy,
2014-2019 RIO HONDO COLLEGE EDUCATIONAL MASTER PLAN PAGE26 corrections, wildland fire technology, and geographic information systems. Depending on the
employment outlook for these fields and each program’s vitality, these are programs that could be ripe for expansion.
Table V-5. RHC Programs Offered at Nearby Community Colleges
Offered at 3 or fewer Community Colleges Offered at 4 - 6 Other Community Colleges Offered at 7+ Other Community Colleges Automotive Technology - Heavy Equipment Maintenance Specialist
Civil Design and Drawing
Environmental Technology
Wildland Fire Technology
Environmental Science Geographic Information Systems Logistics Management Mass Communications: Mass Media Management and Supervision Alternative Energy Technology
Alternative Fuels and Advanced Transportation Technology Corrections Fitness Specialist Philosophy Photography
Automotive Collision Repair and Painting
Biology Chicano Studies Drug Studies Electronics Technology Fire Technology Vocational Nursing Animation Commercial Art
General Studies: Arts and Human Expression
Liberal Arts and Sciences, General
Physics
Art
Business Administration
Computer Information Technology
International Business
Kinesiology
Mass Communications: Print Media
Retail Management
Small Business/Entrepreneuralism
Welding Technology
Architectural Design and Drawing Technician Business Marketing Engineering Design Drafting Technician Sociology Administration of Justice Art History Automotive Technology Child Development/Early Care and Education
Communication Studies
General Studies: Science and Mathematics Music Nursing Psychology Theatre Arts Accounting English Mathematics
Employment analyses by EDD and LAEDC identified occupations likely to exhibit employment growth in the coming years. Table V-6 provides a list of community college programs that support these growing occupations, but are not currently offered by Rio Hondo. The table includes a count of the number of nearby community colleges already offering programs in each area. Those programs offered at the degree or certificate level by three or fewer community colleges are registered veterinary technology, biotechnology and biomedical technology, film production, computer support, engineering technology (general), biomedical instrumentation medical laboratory technology, health information technology, and community health care worker. These are fields in which Rio Hondo has the potential to develop a successful niche serving community economic needs. The common themes across most of these fields are healthcare and technology.
2014-2019 RIO HONDO COLLEGE EDUCATIONAL MASTER PLAN PAGE27
Table V-6. RHC Growth Programs and Nearby Community Colleges
Offered at 3 or fewer Community Colleges Offered at 4 - 6 Other Community Colleges Offered at 7+ Other Community Colleges Biomedical Instrumentation Registered Veterinary Technology Film Production
Engineering Technology, General
Sheet Metal and Structural Metal
Medical Laboratory Technology
Community Health Care Worker
Biotechnology and Biomedical Technology
Computer Support
Health Information Technology
Television (including combined TV/film/video)
Manufacturing and Industrial Technology
Dental Assistant
Paralegal
Office Technology/Office Computer Applications
2014-2019 RIO HONDO COLLEGE EDUCATIONAL MASTER PLAN PAGE28
VI. Student Demographics
Although the college has experienced enrollment growth over the past 20 years, student demographics have remained relatively stable. Today’s “typical student” would be a Hispanic male between 20 and 24 years of age, while in 1993-1994 that student would have been a Hispanic male between 25 and 29. The most noteworthy change has been that the student population is getting younger.
Gender
The majority of the college’s students are male. Over the past 20 years, the ratio of male to female students has remained about 3 to 2 (60% to 40%). The highest percentage of male students was 62.7% in 1998-1999. Recent years have seen a trend toward balance. In 2012-2013, 55.8% of the students were male. The college has also seen an increase in students of unknown/undeclared gender, from below 0.1% in the 1990s to almost 0.6% in 2012-2013.
Figure VI-1. Gender Distribution of RHC Students Across 20-Year Span (1993-2013)
Note: The annual percentages of students of unknown/undeclared gender accounted for less than 1% of the total annual distributions and could not be adequately displayed in the figure.
In having a majority of male students, Rio Hondo is unusual among California community colleges. Statewide, for the 2012-2013 school year, the community college student population consisted of 53.0% females, 45.9% males, and 1.1% unknown/undeclared.3 Rio Hondo’s high proportion of male students is primarily due to have a large Public Safety division. The programs (e.g., Police Academy, Fire Technology Emergency Medical Technician, Corrections) enroll about three male students for each female student (i.e., 76.1% of the 7,241 students in 2012-2013 were male).4 Excluding the students who enrolled only in Public Safety courses, Rio Hondo’s 2012-2013 for-credit student population consisted of 50.4% males.
3
CCCCO Datamart (Student Count), retrieved on 5/08/2014.
4
Banner/Cognos (Person Detail), retrieved on 4/28/2014. 0% 10% 20% 30% 40% 50% 60% 70% 80% 90% 100% Females Males
2014-2019 RIO HONDO COLLEGE EDUCATIONAL MASTER PLAN PAGE29 Excluding the students who enrolled only in Public Safety academy courses, but including those who enrolled in Public Safety degree and certificate courses (e.g., Fire Technology, Administration of Justice), the college’s 2012-2013 for-credit student population was 51.5% male. The division with the highest proportion of female students in 2012-2013 was Health Science and Nursing. Four in five (80.1%) of its 548 students were females.
Age Group
The most apparent area of demographic change is in age; the RHC student population is getting younger. The California Community College Chancellor’s Office (CCCCO), on its Data Mart, reports student age in groups: 19 or less, 20 to 24, 25 to 29, 30 to 34, 35 to 39, 40 to 49, 50 or more, and Unknown. For each of the past 20 years, the largest age group has been 20 to 24, usually comprising 25% to 30% of enrollment. For the past two years, the median age has fallen within this group. Before that, the median age group was 25 to 29. Historically about 6 in 10 students have been below 30 years age.
Figure VI-2. Age Distribution of RHC Students Across 20-Year Span (1993-2013)
Note: The annual percentages of students of unknown/undeclared age accounted for less than 1%of the total annual distributions and could not be adequately displayed in the figure.
Consistent with the trend of students getting younger, more than 73% of students in 2012-2013 were below 30. Considering 20 years of age data, RHC had its highest percentages of students 19 or less (26.0%) and 20 to 24 (33.5%) in 2012-2013. At the same time, the college had its lowest percentages of students in the 25 to 29, 30 to 34, 35 to 39, and 40 to 49 age groups.
17% 19% 19% 18% 16% 13% 15% 15% 16% 17% 19% 21% 19% 18% 18% 22% 21% 22% 24% 26% 31% 30% 30% 29% 26% 22% 22% 24% 27% 27% 29% 29% 26% 25% 24% 25% 26% 28% 30% 34% 18% 17% 17% 18% 17% 16% 15% 16% 16% 16% 15% 16% 16% 15% 15% 15% 15% 15% 14% 14% 0% 10% 20% 30% 40% 50% 60% 70% 80% 90% 100% 50 + 40 to 49 35 to 39 30 to 34 25 to 29 20 to 24 19 or Less
2014-2019 RIO HONDO COLLEGE EDUCATIONAL MASTER PLAN PAGE30
Ethnicity
Consistent with the surrounding Los Angeles area, Rio Hondo College has seen an increase in its Hispanic population over the past two decades. This increase was accompanied by decreases in White Non-Hispanic and African-American students.
The percentage of students reporting Hispanic ethnicity increased from 54.9% in 1993-1994 to 67.2% in 2012-2013. Over the same period of time, the percentages of African-American students decreased from 5.5% to 2.2% and White Non-Hispanic decreased from 25.0% to 10.2%. The CCCCO introduced the Multi-Ethnicity category in 2009-2010; as of 2012-2013 almost 1 in 100 RHC student identified in this category. Percentages of other ethnic groups have remained relatively stable: about 8% of students report being Asian and below 2% report being Filipino. Below 1% of students reported being American Indian/Alaskan Native or Pacific Islander.
In contrast to gender and age group, year-to-year comparisons in ethnicity are complicated by dramatic fluctuations in the numbers of students classified as “Unknown.” Typically, about 1 student in 10 is in the Unknown category. Due to changes in definitions and reporting procedures, that percentage
temporarily leaped from 2006-2007 to 2009-2010. During that period between 1 in 3 and 1 in 4 students were in the Unknown category.
Figure VI-3. Ethnicity Distribution of RHC Students Across 20-Year Span (1993-2013)
5% 6% 5% 6% 5% 5% 6% 6% 5% 4% 4% 4% 5% 3% 3% 3% 3% 3% 3% 2% 25% 23% 21% 22% 20% 21% 22% 21% 18% 16% 14% 14% 16% 12% 10% 10% 12% 15% 13% 10% 55% 56% 58% 54% 52% 43% 49% 50% 56% 56% 55% 57% 57% 48% 46% 48% 52% 59% 64% 67% 0% 10% 20% 30% 40% 50% 60% 70% 80% 90% 100% Multi-Ethnicity Hispanic White Non-Hispanic Asian African-American Filipino Pacific Islander American Indian/ Alaskan Native Unknown
2014-2019 RIO HONDO COLLEGE EDUCATIONAL MASTER PLAN PAGE31
Feeder High Schools
The college has two sources of data on new students’ high schools: one for historic data and one for recent data. The source of historic data is the California Postsecondary Education Commission (CPEC). Until the State of California eliminated this commission in November 2011, CPEC provided annual data on the high schools of new RHC students. These updates ended with the 2009-2010 school year. CPEC, though not current, provides comprehensive data for new Rio Hondo students in previous academic years.
During the final five years reported by CPEC, 8 high schools within RHCCD boundaries were among the college’s top 10 feeder high schools (see Table VI-4). The 2 remaining high schools within RHCCD, La Serna and Arroyo, were the 11th and 13th respectively. Two out-of-district high schools in Montebello (Montebello and Schurr) were consistently among the top 10.
Table VI-4. RHC Student Count from Feeder High Schools
Feeder High School 2006 2007 2008 2009 2010 TOTAL
Whittier High, Whittier 115 115 129 126 124 609 El Rancho High, Pico Rivera 125 100 99 99 91 514 Montebello High, Montebello 69 80 112 136 97 494
California High, Whittier 83 74 89 92 77 415
Santa Fe High, Santa Fe Springs 59 63 83 54 57 316
Schurr High, Montebello 84 50 61 58 48 301
Pioneer High, Whittier 58 39 74 69 56 296
Mountain View High, El Monte 54 56 58 42 65 275 South El Monte High, South El Monte 50 49 60 60 49 268
El Monte High, El Monte 46 57 65 51 43 262
La Serna High, Whittier 33 35 49 57 66 240
Los Altos High, Hacienda Heights 39 42 47 45 27 200
Arroyo High, El Monte 31 47 36 36 46 196
Sierra Vista High, Baldwin Park 34 34 43 45 27 183 Bell Gardens High, Bell Gardens 41 31 33 32 31 168
Source: California Postsecondary Education Commission (CPEC), 4/30/2014
The second source is CCCApply (online application) data. The college began collecting these data for the Fall 2012 semester. Because this information is collected only for students applying to the college, many continuing students do not have a high school on file. The percentage of students with a high school of record has increased each semester since Fall 2012, with 59.0% of the Spring 2014 for-credit students having a high school of record. The most complete data, though, are for new students.
RHC had 4,683 new students (including first-time college students and new transfer students) in Fall 2013 and had a high school listed for 3,928 (83.9%) of those students. Table VI-5 displays the college’s top 25 feeder high schools for the new students of Fall 2013. Consistent with the historic data, Whittier and El Rancho were the two high schools sending the most students to Rio Hondo. Two El Monte schools, El Monte and Arroyo, moved up to third and fourth, respectively. Overall, high schools within
2014-2019 RIO HONDO COLLEGE EDUCATIONAL MASTER PLAN PAGE32 the RHCCD bounda