Product Specialization, Efficiency and Productivity Change in
the Spanish Insurance Industry
Hugo Fuentes
*, Emili Grifell-Tatjé
**and Sergio Perelman
*** * Tecnológico de Monterrey, Campus Ciudad de México, Mexico D.C., Mexico**Departament d´Economia de l’Empresa, Universitat Autònoma de Barcelona,
Bellaterra, Spain
*** CREPP, Université de Liège, Liège, Belgium
November, 27. 2005
Abstract
In this paper we analyze the levels of technical efficiency and productivity growth attained by Spanish insurance companies during a period of deregulation. We compute Malmquist productivity indexes using the estimates of parametric distance function for several specialized insurance branches. In this way, we show that branch specialization matters a great deal and that firms combining two or three product lines (Health, Property-Liabilities and Life) perform better than firms operating in one insurance line exclusively. In the light of these results, we recommend that the remaining restrictions coming from the European Third Directives on the operations of multi-branch firms should be removed. Moreover, from a management point of view, it would be appropriate to encourage the creation of multi-branch insurance firms. However, in all cases, the estimated scores indicate low productivity growth (less than 2% per year) compared with a huge increase in insurance activity (premiums were multiplied by nearly 3 in a decade).
JEL classification: D24, C43, G22
Keywords: Efficiency, parametric Malmquist index, output specialization, Spanish insurance
Acknowledgments: The authors are grateful for financial support from Ministerio de Ciencia y Tecnología. SEJ2004-07242-C03-01/ECON, 2005SGR 00813 from the
Generalitat de Catalunya and Fonds de la Recherche Fondamentale Collective (FRFC 2.4501.05) are also acknowledged. Any errors that remain are our own.
1. Introduction
In this paper we analyze the levels of technical efficiency and productivity growth attained by Spanish insurance companies during the decade from 1987 to 1997. This period, which followed Spain’s entry into the European Union (EU), was characterized by a huge deregulation process in European financial markets and constitutes an excellent framework in which to study the effect of reforms devoted to introducing greater competition in the insurance industry. However, the evolution of institutions and the adaptation of firms and consumers to the new rules fixed by European Union Directives is a process that will certainly take more than one decade to achieve. For this reason, we consider the period 1987 – 1997 as a whole, without making a distinction for the year of introduction of new regulations.
Despite the importance of the Spanish insurance industry, it has been the object of scant attention. One exception has been in the field of strategic management and marketing, with research by Martinez (1995), Lado Coustré and Martinez (1997), Lado Coustré and Maydeu-Olivares (2001), Maydeu-Olivares and Lado Coustré (2003) and Martinez, Albarrán and Camino (2001). This situation contrasts with the Spanish banking sector, in which a generous stream of research has been carried out in all areas. Some of this research has focused on analyzing the impact of the deregulation process on the Spanish banking sector. For example, Vives (1990) studied the relationship between deregulation and competition; Fuentelsaz, Gomez and Polo (2002) focused on geographic diversification; Purroy and Salas (2001) examined strategic behavior; Lloydwilliams and Molyneux (1994) investigated market structure; Grifell-Tatjé and Lovell (1999) researched profit generation and, finally, Fuentelsaz and Gomez (2001) considered the effects on the banking sector of Spain’s decision to enter the EU. Other studies on the Spanish banking sector have analyzed the consequences of EU deregulation on the levels of efficiency and productivity change within financial services, but have obtained controversial results [i.e. Pastor (1995), Grifell-Tatjé and Lovell (1996, 1997)]. To date, the consequences of EU deregulation in terms of efficiency in the case of the Spanish insurance market have been analyzed only by Fuentes, Grifell-Tatjé and Perelman (2001) and Cummins, Rubio-Misas and Zi (2004).
Cummins et al. (2004) calculated the technical, cost and revenue efficiency of the Spanish insurance sector in the period from 1989 to 1997, paying special attention to the institutional forms: stock and mutual. They reported a very low level of cost and revenue efficiency, a little higher than 25% but with a better score of close to 50% in the case of technical efficiency. These results undoubtedly demonstrate very poor performance by the Spanish insurance industry. With regards to the institutional form, the authors tested the efficient structure hypothesis. This hypothesis predicts that there will be no significant efficiency differences between stocks and mutuals. This implies that firms of different types are likely to be characterized by different operating technologies adapted to the market sectors in which they have a comparative advantage. The results on this point are unclear because, although Cummins et al. found strong support for this hypothesis based on the scores of technical efficiency, they also found weaker support when looking at the scores of cost and revenue efficiency. On the other hand, the authors rejected the expense preference hypothesis, which predicts that mutuals will fail to minimize costs or maximize revenues due to unresolved agency conflicts. Fuentes et al. (2001) analyzed the efficiency and productivity of Spanish insurance companies operating simultaneously in three product lines: Health, Property-Liabilities and Life, during the period 1987 – 1994.
This paper completes the study by Fuentes et al. in the following ways. First, it covers all the insurance companies in all the branches operating in the Spanish insurance market and second, it extends the period of study to cover the ten years from 1987 to 1997. This was a decade of strong deregulation in the insurance industry because it followed Spain’s entry into the EU.
The paper also complements the study by Cummins et al. (2004). Firstly, we focus on the management decision to product i.e. the specialization of insurance firms. These firms are not only specialized in terms of the different lines of products they offer, “Health”, “Property-Liabilities” and “Life”, but specialization also applies to the way each firm combines these product lines. Given the dramatic differences in the nature and operation of these insurance activities, each one of these combinations will be considered here as a specialized branch and will be analyzed separately. Therefore, we divide the whole insurance market into several specialized branches, composed of firms operating exclusively in one product line or in a combination of them. The results we obtain show that belonging to one or other of these specialized branches matters greatly in a period of deregulation, as observed in the Spanish and European markets. More precisely, the insurance companies operating simultaneously in three product lines, or in two of them, were shown to perform better than those specializing in only one. In this product specialization approach, we perform a comparative analysis of firms that have adopted different institutional forms. It appears that mutuals are more technically efficient than private (stock) companies, but no clear difference appears in terms of productivity change. Here again, what really matters is branch specialization. Firms that appear to take less advantage of the deregulation process are those that operate in just one product line. This is true in the case of private companies operating exclusively in the Health branch and mutuals operating mainly in the Property-Liabilities branch.
Secondly in this paper, we calculate technical efficiency as well as productivity change using parametric Malmquist indexes. We apply the parametric stochastic methodology, which is based on distance function estimations. This methodology allows the decomposition of productivity growth into three effects: technical efficiency change, technical change and technical change due to output-mix or input-mix bias. Our results show that, during the period covered, the main source of productivity growth in the Spanish insurance sector was unbiased technical change or, in other words, neutral shifts of the production frontier.
Thirdly, we define insurance activity as a production process in which the outputs are defined by the capacity of the companies to collect premiums, and we only consider the inputs that have a direct relationship with this activity. Proceeding in this way, we rely more closely on the traditional view of the insurance industry, which neglects the performance of insurance companies in the financial markets and the revenue generated by these activities1. The results we obtain indicate that productivity growth was lower than 2% per year during the period 1987 – 1997. This means that, in spite of an exceptional expansion of the Spanish insurance market during this period (aggregate premiums were multiplied by nearly 3), the sector performed poorly in terms of productivity growth. Insurance companies compensated for these poor results with the gains they obtained in the financial markets, which performed exceptionally well in the nineties.
This paper is organized as follows. Section 2 is devoted to the methodology. Here, we present succinctly the parametric stochastic Malmquist productivity index and its decomposition based on the parametric estimation of an inter-temporal distance
function. In Section 3, we detail the way in which we divided the insurance industry into specialized branches and how the corresponding samples were created. In that section we also analyze the importance of institutional forms through branch specialization, as well as the output and input definitions that we adopt for estimation purposes. Here we also explain the reasons that induced us to neglect one particular category of life-insurance products, single premium, as part of this study. In Section 4, we present the main results for each specialized branch and type of institution. These results include technical efficiency levels and productivity growth indexes, with their corresponding decomposition, analyzed over time. The last section contains the main conclusions.
2. The parametric stochastic Malmquist productivity index 2.1. The Malmquist productivity index
Let xt denote a strictly positive vector of N inputs used to produce a strictly positive vector of M outputs yt in the period t, t = 1,...,T. A basic representation of the production technology by which inputs are used to produce outputs is provided by
Pt(xt) = {yt: yt is obtainable from xt}, t = 1,...,T. (1) Pt(xt) is assumed to be closed, bounded, convex, and to satisfy a strong disposability of inputs and outputs. A functional representation of the structure of production technology for a panel of i = 1,..., I producers is provided by Shephard's (1970) output distance function
DOt(xi,t, yi,t) = min{θ: (yi,t/θ) ∈ Pt(xt)}, t = 1,...,T. (2)
DOt(xi,t,yi,t) provides a measure of the distance from (xi,t,yi,t) to the boundary of Pt(xt),
the distance being measured radially in the output direction. DOt(xi,t,yi,t) ≤ 1, with
DOt(xi,t,yi,t) = 1 if, and only if, yi,t is technically efficient, in the sense that yi,t is on the
boundary of Pt(xt). In fact, the output distance function is the reciprocal of the Debreu (1951)–Farrell (1957) output-oriented measure of technical efficiency. We refer to DOt(xi,t,yi,t) as a within-period output distance function; adjacent-period output
distance functions Dto(xi,t+1,yi,t+1), Dot+1(xi,t,yi,t), Dot(xi,t+1,yi,t) and Dot+1(xi,t+1,yi,t) are defined analogously. Since examining data from one period may or may not be feasible with adjacent-period technology, the output distance functions can take values greater than, equal or less than unity. Therefore an output-oriented Malmquist productivity index t
(
i,t, i,t, i,t+1, i,t+1)
O x y x y
M for producer i between periods t
and t+1, using period t technology as a reference, can be written as
(
i,t, i,t, i,t+1, i,t+1)
= t O x y x y M + + + + + + + + 1 , , 1 , 1 1 , , 1 , . , , , 1 , , 1 , 1 t i y t i x t o D t i y t i x t o D t i y t i x t o D t i y t i x t o D(
+1 +1) (
∆ +1 +1)
∆= TE xit,,yit,,xit, ,yit, . T xit, ,yit, . (3) The first component on the right side of (3) measures the contribution of technical efficiency change to productivity change. DOt+1(xi,t+1,yi,t+1) >=< DOt(xi,t,yi,t),
depending on technical efficiency improvements, stays unchanged or declines between periods t and t+1. The second component measures the contribution to productivity change of technical change, calculated along a ray through period t+1 data. DOt(xi,t+1,yi,t+1) >=< DOt+1(xi,t+1,yi,t+1), depending on technical progress, stagnation
or decline occurs between periods t and t+1. Färe, Grosskopf, Grifell-Tatjé and Lovell (1997) propose an additional decomposition of the technical change element
+ = + + ∆ t i y t i x t o D t i y t i x t D t i y t i x T O , , , 1 , , , 1 , , 1 , . + + + + + + + + + + + + t i y t i x t o D t i y t i x t o D t i y t i x t o D t i y t i x t o D t i y t i x t o D t i y t i x t o D t i y t i x t o D t i y t i x t o D , , , , , , 1 . , , 1 , 1 , , 1 , . , , 1 , , , 1 , 1 . 1 , , 1 , 1 1 , , 1 , = + + + ∆T xi,t,yi,t . OB yi,t,xi,t 1,yi,t 1 . IB xi,t,yi,t,xi,t 1 . (4) The first element, ∆T
(
xi,t,yi,t)
, measures technical change for unchanged outputs andinputs, i.e. with period t data. The second element defines the output bias index,
(
yi,t,xi,t+1,yi,t+1)
OB , which compares the shift of the output set corresponding to the producer’s change in output combinations from period t to period t+1. The third expression defines the input bias index, IB
(
xi,t,yi,t,xi,t+1)
. This compares shifts of theoutput set in periods t and t+1, corresponding to changes in the bundle of inputs. The bias components make no contribution to productivity change if technical change is neutral. Furthermore, there is no output bias effect or input bias effect in the case of one output or one input, see Färe et al. (1997). All three components are greater than, equal to, or less than unity, depending on whether they contribute positively, not at all, or negatively to technical change.
2.2. Calculating the Malmquist productivity index
The output distance functions and, by extension, the Malmquist productivity index and its decomposition, are usually calculated using linear programming techniques, see, for example, the pioneering papers of Färe, Grosskopf, Lindgren and Roos (1992, 1994[1989]). Fuentes et al. (2001) have introduced the parametric stochastic Malmquist productivity index, where the output oriented distance function is defined in a translog form, as in Coelli and Perelman (1999). The translog specification of a
multi-output multi-input technology with technical progress defined in the usual form as a trend variable is given by:
(
)
it m t i k K k M m km t i l t i k K k K l kl t i k K k k t i t i t O x y x x x x y D , , 1 1 , , 1 1 , 1 0 , , ln ln ln ln 2 1 ln , ln∑
∑∑
∑∑
= = = = = + + + =α α α δ 2 2 1 , , 1 1 , 1 2 1 ln ln 2 1 lny y yit t t n t i m M m M n mn t i m M m m β γ γ β + + + +∑
∑∑
= = = ln ln , , 1,..., ; 1,..., . 1 , 1 T t I i t y t x it m M m m t i k K k k + = = +∑
∑
= = µ η (5)The isoquant of the output set corresponds to: ln t
(
i,t, i,t)
=0O x y
D [i.e.
(
i,t, i,t)
=1t
O x y
D ] and the interior points to: −∞<ln t
(
i,t, i,t)
≤0O x y
D
[i.e.0< t
(
i,t, i,t)
≤1O x y
D ]. The parameters of the function, indicated in Greek letters, must satisfy a set of restrictions: first, the usual restrictions for symmetry are applied,
(
m,n ,...,M)
nm
mn =α =1
α , βkl =βlk
(
k,l=1,...,K)
and second, homogeneity of degree +1 in outputs are imposed: 1;1 =
∑
= K k k α 0, 1,..., ; 1 K k K l kl = =∑
= α M k K m km 0, 1,..., 1 = =∑
= δ ; 0 1 =∑
= M m mµ and third, we also imposed homogeneity of degree + 1 in inputs: 1;
1 =
∑
= M m m β M; ,..., m , M n mn 0 1 1 = =∑
= β 0, 1,..., . 1 M m K k km = =∑
= δHomogeneity of degree + 1 in outputs is imposed in order to obtain an output oriented radial distance function. Homogeneity of degree + 1 in inputs implies constant returns to scale technology, an assumption necessary to accurately measure productivity change. Grifell-Tatjé and Lovell (1995) showed that, in the presence of non-constant returns to scale, the Malmquist index does not correctly measure productivity variation. This was also confirmed by Färe and Grosskopf (1996: 54), who demonstrated that a Malmquist index is a productivity index if, and only if, it is defined on a technology of constant returns to scale.
Extending Lovell, Richardson, Travers and Wood (1994), it can be shown that homogeneity of outputs and input implies:
(
)
t(
it it)
O t i t i t i t i t i t i t O x y D x y D , , , , , , , , , , λ ω ωλ = , for any ωi,t >0 and λi,t >0. (6)
Therefore, it is possible to impose homogeneity on outputs and inputs by choosing arbitrarily one of the outputs, e.g. it
M
y, , and one of the inputs, e.g. it K x, , and defining t i M t i, =1 y, ω and it K t i, =1 x, λ .
If we express the right hand side of (5) as TL
(
xi,t,yi,t,t;θ)
, where(
α β δ γ η µ)
θ = , , , , , is a vector of parameters, and take into account the equality (6), expression (5) can be rewritten as:
(
)
(
)
t(
it it)
O t i M t i t i K t i t i K t i M x TL x x y y t D x y y, , , , , , , , ; ln ,, , ln = − − θ . (7) Setting t(
it it)
O t i D x yu, =−ln ,, , and adding a stochastic term, we obtain Aigner,
Lovell and Schmidt’s (1977) representation of a parametric stochastic frontier:
(
)
, , ; , ln , , , , , i,t ^ i,t M t i t i K t i t i K t i M x TL x x y y t y θ+ε = − εi,t =ui,t +vi,t, (8)where εi,t is a composed error term allowing for inefficiency in production ( ) ui,t and
for noise ( ) vi,t and θˆ=
αˆ,βˆ,δˆ,γˆ,ηˆ,µˆ
the estimated parameters. The inefficiencyerror is assumed to be a negative random term independently distributed as truncations at zero of the N
(
, 2)
u σ
ϕ distribution. The noise term is symmetrically distributed and assumed to be iid
[
N( )
0, 2]
v
σ . Both terms are independently distributed
(
σuv =0)
. The predicted value of the output distance function for producer i in period t can then be estimated as a conditional expectation:(
)
[
t it it]
[
( )
it it]
O x y E u D ,, , = exp− , |ε ,(
)
(
)
exp(
2)
1 1 , 2 , , A t i A t i A t i A χε σ σ χε σ χε σ + Φ − − Φ − = , (9) where σ = χ(
1−χ)
σ2 A , 2 2 2 v u σ σ σ = + , χ σ2 σ2 u= , and Φ
()
. represents the distribution function of a standard normal random variable. Note that conditional expectation (9) is a modification of Jondrow et al. (1982) and Battese and Coelli (1988), as introduced by Coelli (1996).Once the parameters of equation (8) have been estimated (indicated with hats) the Malmquist productivity index and its decomposition can be calculated2. Following Fuentes, et al. (2001), we have, in the case of technical efficiency change:
(
x, ,y, ,x, 1,y, 1)
exp[
TL(
x, 1,y, 1,t 1;θˆ)
TL(
x, ,y,,t;θˆ)
]
TE it it it it = it it + − it it
∆ + + + + , (10)
The technical efficiency is calculated as the ratio of two successive distance functions. In a similar way, we can express the technical change with period t+1 data:
(
,)
(
, , ;θˆ)
ln∆T xi,t+1 yi,t+1 =TL xi,t+1 yi,t+1 t −TL
(
xi,t+1,yi,t+1,t+1;θˆ)
. (11)The technical change effect with period t data, ∆T(xit, yit), can be calculated in the same way as (11), but using period t data instead of period t+1 data. As shown in equation (4), ∆T(xit+1, yit+1) can be additionally decomposed into the product of an output bias effect and an input bias effect. The expressions of these two effects are:
(
)
[
]
− =∑
= + + + M m t i m t i m m t i t i t i x y y y y OB 1 , 1 , 1 , 1 , , ln ln ˆ exp , , µ , (12)(
)
[
]
− =∑
= + + K k t i k t i k k t i t i t i y x x x x IB 1 , 1 , 1 , , ,, , exp ηˆ ln ln . (13)Below, we study the efficiency and total factor productivity change of the Spanish insurance industry over the 1987 – 1997 post-deregulation period. We follow the parametric stochastic Malmquist approach presented in this section, where technical efficiency is measured by expression (9), and technical efficiency change, technical change, output bias effect and input bias effect by expressions (10), (11), (12) and (13), respectively.
3. Spanish insurance data
3.1. Product specialization in the Spanish insurance industry
In the Spanish insurance market, we can identify three lines of products: Health, Property-Liabilities, and Life3. One insurance company may specialize in one of these groups of outputs or may offer a combination. In fact, we have four possible combinations: i) Health & Liabilities; ii) Health & Life; iii) Property-Liabilities & Life and iv) Health, Property-Property-Liabilities & Life. Thus, it is possible to investigate the insurance industry by looking at the decisions taken regarding specialization. This approach allows us to split the Spanish insurance market into seven groups, or branches, and to study these branches separately instead of together. In addition, with this approach, we introduce the possibility that each branch may have a different kind of technology. In other words, the characteristics of an insurance company organization could change depending on the product lines that it offers. As a result, adaptation to a deregulated market could be different between the branches. As we shall see in this study, we find a different level of efficiency and of productivity change depending on the branch. Moreover, we study whether there has been a move to specialization as a managerial answer to a more competitive environment. We can follow this multi-branch approach because we combine two sources of information, which allows the allocation of one insurance company to each one of the seven possible branches.
The data we use in this paper describes the operating performance of Spanish insurance companies during the period 1987 – 1997. We collected the data from two sources of information. The first was the annual Balance y Cuentas de Pérdidas y Ganancias, which is issued by the Spanish regulator Dirección General de Seguros
(DGS). This institution publishes the accounting information of the Spanish insurance companies that it regulates (we will return to this point later). The second source of information was from the insurance trade association Unión Española de Entidades Aseguradoras y Reaseguradoras (UNESPA), which, until 1997, used to publish annually the Estadística de Seguros Privados. Joining together these two different sources of information allows the multi-branch approach followed by this paper. Unfortunately, it is not possible to extend the study after 1997 because UNESPA has not published the Estadística de Seguros Privados since 1998. Additionally, there was also a change in the accounting rules in 1998, which, due to the definitions of outputs and inputs, makes it difficult to match the account statements before and after this year.
UNESPA used to collect information from its associates using a questionnaire. Sometimes, the completed questionnaire from an insurance company failed to arrive on time. Under these circumstances, the data from that particular company was not published. Consequently, the number of companies covered by UNESPA was always
lower than was the case in the DGS information. For this reason, we lost on average 9% of the observations as a result of the integration of the two data sets4. Nevertheless, the remaining insurance companies can each be classified into one of the possible seven branches.
The first observation we can make from this process of allocation is that two branches are almost empty. There are only two observations per year in the Property-Liabilities & Life branch and five per year in the Health & Life branch. For this reason, these two branches are not included in this study. At the end of this first stage, we have a sample of 4,031 observations where (see Table 1) approximately 33%, on average, of the companies are in the Health & Property-Liabilities (H&PL) branch; 21% in the Health, Property-Liabilities & Life (H,PL&L) branch; 19% in the Health branch; 16% in the Property-Liabilities (PL) branch and, finally, 12% in the Life branch. The Spanish life insurance branch presents special characteristics. It is for this reason that we pay particular attention to this branch later.
3.2. Institutional forms
In the Spanish insurance market, we can find two institutional forms: private (or stock), and mutual. In the private institutional form, three different kinds of firms can be found: private insurance companies, foreign trade branches, and reinsurance companies. However, the weight of each of these in the Spanish insurance industry is different. In the data set, the private companies represent approximately 79%, the mutual 16%, the foreign trade branches 5% and, finally, the reinsurance companies have a residual weight. Reinsurance companies are excluded from this study because we believe that they have special characteristics that make them incomparable with the other institutional forms.
Spain is a decentralized country, in which the central government has granted to some regions full responsibility for some issues, among them the supervision of mutualities. The mutual form is very important in Catalonia and the Basque Country but, unfortunately, information about these mutualities is not available. This is because DGS could not provide us with information about these two most industrialized regions. As a result, the true weight of the mutual form in the Spanish insurance industry is not represented: it should be higher than the 16% shown here.
In this wide sample of 4,031 observations, we can obtain a clear picture of the structure of the Spanish insurance industry and its evolution with regard to the institutional form. Table 1 shows the composition of the industry by institutional form and branch. In the case of mutual companies, on average, 78% of them are found in two branches: PL, and H&PL. But the trends of these two branches during the period of study were very different. Mutualities reduced their weight sharply in the PL branch but increased it markedly in the H&PL branch5. The remainder are mainly in the HPL&L branch. Mutual companies almost disappeared in the Health branch and the Life branch at the end of the period, 1997. These results suggest that mutualities had been concentrating their activity in branches with two or more lines of products, leaving the ones with only one product line.
The distribution of the private companies is different with, on average, 30% in the H&PL branch, 23% in the Health branch, 22% in the H,PL&L branch, 13% in the Life branch and, finally, 12% in the PL branch. The weight in the PL branch, H&PL branch and H,PL&L branch remained steady over the period. By contrast, it climbed steadily in the case of the Life branch, as the weight went from 4% in 1987 to 25% in 1997. A
very different form of behavior can be observed in the case of the Health branch, where the proportion of health insurance companies in the private form declined from 29% in 1987 to 10% in 1997. The explanation for this decline lies mainly in the important process of mergers and acquisitions, which occurred in the Health branch during the period of study.
The foreign trade branches are mainly concentrated in two types of activity: on average, 61% of them are in the H&PL branch and 21% in the Life branch. The remainder are spread through the other branches. However, it is not possible to extend the study of the foreign trade branches after 1994. We lost the information about these companies in the remaining years as a result of the process of joining the data sets from DGS and UNESPA.
The private insurance companies are almost the sole institutional form in the Health branch and Life branch (see Table 1), although in the latter branch there is a modest representation of, on average, 8% of foreign trade branches. Mutualities account, on average, for 37% and private companies for almost all of the remainder of the PL branch. The share of the mutual form is only 15% in the H,PL&L branch. Consequently, the private companies are the prevailing institutional form in this branch. The only situation where the three institutional forms are well represented is in the H&PL branch with, on average, 72% of the Spanish private companies, 20% of the mutualities and, finally, 8% of the foreign companies.
3.3. Inputs and outputs
In the insurance literature, there is a lack of agreement on defining the output of an insurance company. There are two main tendencies detailed in the literature: physical and monetary. In the former, the output is defined by the number of policies in force, (Burgess and Walter, 1982). In the latter, we can find mainly two approaches: i) value added (Berger and Humphrey 1993) and ii) premiums (Fecher et al. 1993). All these different approaches to the definition of what an insurance company produces have advantages and disadvantages. This paper focuses on specialization in the insurance industry and, consequently, the non-life product has been split into health and property–liabilities. For this reason, there are constraints on the information available. As a result, it is not possible to follow the physical and the value added approaches. Moreover, we are particularly critical with respect to the proxies adopted in the value added approach in the studies of efficiency and productivity in the insurance industry.
In the value added approach and from a practical point of view, losses and the expected value of loss claims are used as one of the proxies of the services provided. We believe that this approach has two important limitations. First, it is possible that poorly managed insurance firms will choose a non-optimal client portfolio and, consequently, have to face huge losses and collapse. Despite this, they may still be identified as one of the most efficient and productive insurance companies. The second limitation of the value added approach is that it takes into account random fluctuations, such as natural disasters or terrorist attacks. The insurance companies that operate in Spanish territory must cover the damage caused by terrorist attacks. This is something that may not be the case in other EU countries. Cummins et al. (2004: 3130) recognized this problem “even though the theoretical justification for using premiums as output is
not as strong as for losses, premiums are highly correlated with expected losses, and hence provide an alternative output measure that is less subject to random fluctuations.” Thus, in this study, outputs are defined by total annual premiums by each
“premiums reflect the ability of an insurance company to market products, to select
clients, and to accept carrying risks, ..., premiums represent the value that free willing consumers attribute to the insurance service they are seeking”.
Furthermore, we follow a classical production point of view in which outputs are compared with the inputs needed in the production process. It means that we have excluded any revenue or expense with its origin in the financial market. Isolating the measures of efficiency and productivity of the ups-and-downs of the financial markets, we expect that they only reflect the operating behavior of the insurance firm. The Spanish Life category has peculiar characteristics that are discussed in detail in the next section.
On the inputs side, we have identified two types: labor cost and operating expenses. Labor cost is defined by the wage bill as well as by the commissions paid to intermediaries, and operating expenses by the sum of non-labor operating expenses, which include direct expenditure on buildings and amortization expenses. Unfortunately, there is not enough accounting information to split operating expenses into expenditure on materials and expenditure on buildings. But, the adopted definition of inputs is a well known approach in both insurance and banking literature, see, for example, Fecher, et al. (1993) and Delhausee, et al. (1995) in the first case, and Grifell-Tatjé and Lovell (1997) in the second6.
In defining outputs and inputs by their value instead of by physical terms, such as the number of contracts, the variables depend on variations both in price and in quantity. The correct way to solve this problem is to have output and input price variation both in each type of output and input, and across insurance companies. Unfortunately, this information is not available because there is no specific price index for the Spanish insurance industry. Given this lack of information, we have deflated outputs and inputs to the beginning of the period of study, 1987, using the Spanish Consumer Price Index.
3.4. The Life category
In the Life category, we can distinguish between renewal premiums and single premiums. The latter were introduced for the first time in 1986 as a new way of saving with tax advantages, but they provide poor insurance services7. The introduction of
single premiums had an enormous impact on the Spanish financial market. At the end of the year of their introduction, 1986, the total number of single premiums was more than triple that of renewal premiums and, from 1986 to 1988, it grew to about 95%8. But single premiums were revealed as an opaque tax investment and attracted some money from the black economy. In 1989, the Spanish Treasury Department decided to rectify this situation and modified the single premiums law9. As a consequence, the annual premiums of 1989 fell to about half the level of those of 1986,10. Because of these historical circumstances and the poor insurance services offered by single premiums, we decided to exclude them as a product in the Life category. Thus, the Life branch is defined by renewal premiums, which are conventional insurance products.
As we have already seen, two branches include the life product: the Life branch itself and the H,PL&L branch. Nevertheless, in the case of the Life branch, we found such a dispersion among the data of the insurance companies that this persuaded us to postpone the efficiency and productivity analysis of this branch11. The dispersion is probably due to the fact that the Spanish commercial banks and savings banks are the owners of about half of the Life insurance companies. Thus, life products might be sold using a commercial bank or a savings bank branch network. As a result, the real
revenues and real expenses might not be appropriately accounted for by the insurance companies. Consequently, this paper measures the efficiency and productivity change of the Spanish insurance industry during the period 1987 – 1997, focusing on four branches: i) Health; ii) Property-Liabilities (PL); iii) Health & Property-Liabilities and, finally, iv) Health, Property-Liabilities & Life.
3.5. The sample
Basing our approach on the adopted definitions of outputs and inputs, we checked the data set, looking for inconsistencies, such as there being no information about one input or one output, or incongruity in the pattern of the outputs or the inputs. In addition, we also excluded those insurance companies with fewer than five observations during the period. This study was finally carried out with a sample of 677 observations in the Health branch, 570 in the PL branch, 824 in the H&PL branch, and 590 in the H,PL&L branch. This represents 55% of the insurance companies and 62% of the total annual premiums excluding the Life branch, as obtained from the DGS information. Looking at the institutional form, the percentages of representation in the sample are close to those that we previously calculated (Table 1) in the Spanish insurance industry.
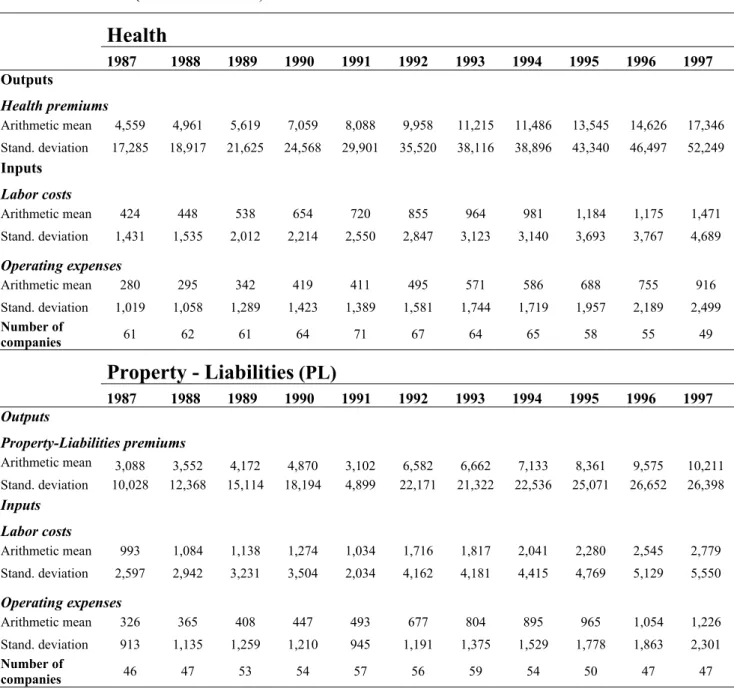
Table 2 shows the number of insurance companies per year and by branch as well as the arithmetic mean and the standard deviation of the outputs and inputs. The first thing that strikes us is the small size of Spanish insurance companies at the beginning of the period of study, 1987. Thus, it should not be surprising that a common feature in Table 2 is the sharp increase in the size of the insurance companies within each branch. One explanation for this behavior is the important process of mergers and, mainly acquisitions, which took place during this period. We have established that approximately 191 over 358 firms were involved in at least one merger or acquisition during the period 1987 – 1997. Moreover, this size increase is accompanied by a decrease in its dispersion, as evidenced by the output coefficient of variation (standard deviation/arithmetic mean). But this decreasing tendency does not reduce sufficiently the output coefficient of variation, and this still reflects at the end of the period a huge size dispersion both by variable and by branch. Consequently, the four branches in our sample contain both very small and very large insurance companies.
Other features can be highlighted from Table 2. The Health branch shows the highest increase in annual premiums, while the Property-Liabilities line in the H&PL branch presents the lowest increase over the period. In all the cases, labor is the higher cost, but the proportion that it represents with respect to the total cost varies between branches and over time. As a result, there are important differences in the average input mix between the branches. Although this information is not in Table 2, we have found a huge dispersion in the input mix within each branch. This dispersion could be an indication that there are no productivity gains associated with the choice of input mix.
One striking aspect of Table 2 is that specialization in only one line of products does not mean the attraction of a larger amount of premiums. This is true in the case of the PL branch, where the annual average premiums for the whole period are lower than half the property-liability premiums in the H&PL, and H,PL&L branches. In contrast, the Health branch presents the highest premiums, if we compare it with the other two multi-branches offering the health product. Also worthy of note is that the average health premiums increase sharply in the Health branch. The increase is also significant in the H&PL, and H,PL&L branches, but is lower in these cases than in the Health branch. Thus, we have two very different situations. In the first, specialization in only one line of products – property-liabilities – does not imply a faster growth. In the
second situation, specialization in the health product allows a faster growth through new insurance policies.
4. Efficiency and productivity variation by branch
In this section, we examine technical efficiency and productivity change, and their components, in each of the specialization branches. Our aim is to calculate the level of technical inefficiency and productivity change in each branch separately, and to attribute calculated productivity variation to the change in efficiency and technical progress. Additionally, we decompose the technical change component into the product of three indexes: the first measures the technical progress using period t data, the second expresses an input bias effect, and the third an output bias effect, see equation (4). In the case of branches with only one product line the latter effect, the output bias effect, does not exist. As we shall see, the productivity behavior of each one of the branches is quite different, and this justifies analysis through examination of specialization in the insurance industry.
4.1. Distance function estimation
Table 3 presents the estimated parameters, branch by branch. The four distance functions were estimated under the assumption of linear homogeneity of inputs and outputs. This assumption implies constant returns to scale and similar results, independently of the orientation chosen12. For these estimations, we rely on the Battese
and Coelli (1988) version of the stochastic frontier model proposed by Aigner, Lovell and Schmidt (1977) and Meeusen and van den Broeck (1977). The Frontier program was used for estimation (Coelli, 1996). Underlined parameters were calculated by applying the homogeneity conditions. Note that, for insurance companies specializing in only one product line, the estimated distance function is equivalent to a translog production frontier. In the multiple-branch cases, one line (y2: Property-Liabilities) was selected as the normalized variable13.
First order parameters on inputs have the correct sign (multiplied by – 1) and correspond to partial elasticities of the distance function evaluated at the mean, i.e. partial elasticity with respect to the labor factor varies from 0.417 in the Health branch to 0.758 in the PL branch. Moreover, the partial elasticities with respect to products indicate, for multiple product branches and at mean values, the share of each product on production improvement, e.g. in the three product line branch, Life has the lowest share (0.066) compared with Health (0.460) and PL premiums (0.474)14.
Overall, the results for the two multi-product branches are better on statistical grounds than those obtained with the single branches. Most parameters are significant at the 5% level, including those that incorporate the trend variable (t) and are associated with technological change. For the Health and PL branches, the results are less conclusive, in particular for technological change that appears to be statistically non-significant. In addition, for the Health branch, the share of the inefficiency component of the total error variance is rather high (λˆ =0.939) in comparison with those of other
branches and, in this case only, the inefficiency term distribution appears to be truncated at a value not equal to zero (ϕˆ=1.10).
4.2. Technical efficiency estimation
We begin our analysis with a discussion of technical efficiency by branch (see Table 3 for a summary of annual results). These results are based on solutions to the parametric stochastic output distance function given in equation (8). Although Table 4 reports arithmetic mean results, we obtain a separate solution for each insurance company in each one of the branches. As we can see, average efficiency scores are very different among branches and they show a different form of behavior. None of the four branches shows any clear trend for the whole period 1987 – 1997. This behavior, as we shall see, needs to be translated into the Malmquist technical efficiency effect, which will show a productivity growth rate close to one in all cases except the Health branch.
In Table 4, H,PL&L has the highest technical efficiency scores. The average efficiency score is close to 80%. Although this does not appear in Table 4, looking at the best and worst insurance companies, we can see that, in the H,PL&L branch, the best insurance companies have scores of higher than 90% in each year and the worst insurance companies have scores of no lower than 42% in each year, except 199615. The average efficiency sharply decreases when we move from H,PL&L to H&PL, to PL, and to Health. In the H&PL branch, we obtain an average efficiency score each year of about 72 – 74% and not a very different figure, 67 – 69%, in the PL branch. The situation is very different in the case of Health, with a very poor average efficiency score of about 35 – 39%16. This means that, with the same consumption of inputs, the Health branch should increase the level of services provided by around 60%. This low average score is the consequence of the dispersion of individual results, with 5.1% of the health insurance companies with levels of efficiency higher than 70%, and 61% of the companies with efficiency levels of lower than 40%. The picture that emerges from these results is especially worrying for the Health branch. In addition, we cannot provide an explanation for this situation because our attempts to find a cause or causes have so far failed; the variable size of the companies, for example, does not explain the situation17.
Finally, it is worthy of note that, since the number of product lines differs between three of the branches and the sample sets are different through time and across the four branches, it is not possible to conclude that technical efficiency is higher among the H,PL&L insurance companies than among the other insurance companies. When data from the four branches defines the same production frontier, a direct comparison among the efficiency levels is possible. It is appropriate to conclude that, in our sample, there was a better level of technical efficiency among H,PL&L insurance companies than among insurance companies belonging to any of the other three branches.
4.3. Parametric stochastic Malmquist results
We now turn to an examination of the magnitude of productivity variation within each branch. The parametric stochastic Malmquist results, and their components, are summarized in Table 5. At this point, it is important to remember that parameters of technical change in the case of the Health and PL branches are not statistically significant. Thus, the technical change effect is not reported for these two branches.
During the period 1987 – 1997, we can observe a different rate of productivity growth according to the insurance branch. Productivity increases of 1.5% and 1.7% occur in the H,PL&L and H&PL branches, respectively. However, the analysis of productivity behavior over time differs by branch. In the H&PL branch, growth during
the first part of the period is followed by stagnation and decline. On the other hand, H,PL&L shows an average decline during the first years and a strong recovery in the last ones. More precisely, in the case of H&PL, we can observe on average a productivity growth rate of 2.8% per year until 1992. These results suggest a fast adaptation to the deregulation process in the insurance market, which followed Spain’s entry into the European Union (EU) in 1986. However, productivity gains are more difficult to obtain when we approach the end of the period under study because, after 1992, we can observe a modest positive rate of 0.3% per year. By contrast, we obtain a very different path of results in the case of H,PL&L. This branch has an average productivity decline of -1.0% per year until 1991, but this decline is followed by an impressive average productivity growth of 3.6% per year for the rest of the period. The results for this branch may reflect a difficult adaptation, in the years that followed Spain’s entry into the EU, to a more competitive environment, arising from a more flexible regulation of the insurance industry. In the case of the Health and PL branches, the productivity change is only explained by the technical efficiency effect because the parameters of technical change are not statistically significant.
The three components of parametric stochastic Malmquist – technical efficiency change, technical change and bias technical change – provide the explanation for the overall measured productivity growth by branch. The contribution of the Malmquist technical efficiency change effect can be consider equal, on average, to one, which means no growth in three of the four branches: PL, H&PL and H,PL&L. However, the Health branch presents a deterioration in technical efficiency, implying a productivity decline of 1.8% per annum on average18. This decrease is more marked after 1992 (-3.2% per year on average). A more significant technical change effect is shown by the H&PL and H,PL&L branches. The former presents a growth rate of 1.7% and the latter a growth rate of 1.8% per year on average. It is interesting to note the different behavior of this technical progress. The H&PL branch presents this growth mainly in the early periods. Conversely, the H,PL&L branch shows technical progress after 1991. Before this year, this branch has a slightly negative rate of technical change. This is compensated for in the second period by a sharp technical change growth of 3.8% per year on average.
Table 5 shows the results of decomposition of the technical change component into the product of technical change along a ray through period t data and the bias effect. A decomposition of the bias effect into the product of an input bias effect and an output bias effect is possible in the H&PL and H,PL&L branches. The results for the two branches in all the years are conclusive. Neither an input bias effect nor an output bias effect occurred during the period of study19. In other words, the technical change is neutral. Under these circumstances, an insurance company cannot obtain a productivity advantage through the choice of the mix of inputs or the mix of outputs. This result may explain why we observed a broad dispersion in the mix of inputs and the mix of outputs in the Spanish insurance industry.
4.4. The impact of the institutional form on efficiency and productivity
As we saw in Table 1, private insurance companies are the main institutional form in the four branches, although their weight is different. The PL branch is where the mutualities have the highest representation, followed by the H&PL branch and the H,PL&L branch. The foreign trade branch companies have only some presence in the H&PL branch and, in the sample, till 1994. Table 6 summarizes the following: the average arithmetic means of technical efficiency; the average geometric mean of
productivity change and its decomposition into technical efficiency change; technical change for each one of the institutional forms and branches during the period 1987 – 1997.
One feature of the results in Table 6 warrants particular attention. In all cases, the mutual form is more efficient than the private form. The difference is particularly important in the H&PL branch and in the H,PL&L branch, where the mutualities show an average score of around 8% higher than the private companies. In the only situation where we have information about the foreign trade branches, they show a very poor average score of 68%, clearly below the average of the H&PL branch.
Although this is not in Table 6, the institutional forms do not show a different pattern of productivity change from that of their branch. These patterns were described in the previous section. In Table 6, we can see that the PL branch shows, on average, very close productivity change results by institutional form. In contrast, the foreign trade branches exhibit the highest productivity change in the H&PL branch and the private companies do so in the H,PL&L branch. In both cases, this superior performance has its origin in the high scores for technical change, 2.1% and 1.8%, respectively. The mutualities manifest a different form of behavior in the H&PL branch, with a Malmquist index below the branch average. It is interesting to note that Spanish mutualities, on average, never show a better productivity score than their branch average. Finally, there is no input bias effect or output bias effect associated with the institutional form because, as we have seen, the technical change is neutral in each of the three branches.
5. Concluding observations
In this paper, we have presented a study of efficiency and total factor productivity change in the Spanish Insurance industry during the 1987 – 1997 post-regulation period, focusing on the specialization of insurance companies. We identified three lines of products: Health, Property-Liabilities and Life. An insurance company may specialize in one of these or may offer a combination. Four branches were identified: i) Health; ii) Property-Liabilities (PL); iii) Health & Property-Liabilities (H&PL) and, iv) Health, Property-Liabilities & Life (H,PL&L). The other three possible combinations were not taken into consideration either because the insurance companies did not offer such a combination or, as in the case of the Life branch, the data showed deep contradictions.
For each of the four branches, we calculated the technical efficiency using a parametric stochastic distance function and the total productivity change using a parametric stochastic technique to compute and decompose the Malmquist productivity index. The levels of technical efficiency were found to be very different depending of the branch. The H,PL&L branch showed the highest levels, which were very close, in each of the years, to 80%. In a very different position was the Health branch, with a very poor average efficiency score of lower than 40% in all the periods. This low efficiency score is similar to the one estimated for this branch in other European countries. The other two branches, PL and H&PL, were in a better position, with an average technical efficiency level of 68% and 73%, respectively. Looking at the institutional form, the mutual form was shown to be more efficient than the private (stock) or foreign trade forms.
During the period 1987 – 1997, a different productivity growth could be observed according to the insurance branch. A productivity increase of 1.5% and 1.7% occurred in the H,PL&L and H&PL branches, respectively. The technical change effect provides
the main explanation for the productivity results, although the parameters associated with this effect are not statistically significant in the cases of Health and PL branches. Moreover, in the Health branch there is a productivity decline of 1.8% which is totally explained by the technical efficiency effect. Additionally, the results of the decomposition of the technical change component into the product of technical change (period t data) and the bias effect are conclusive. Neither input bias effect nor output bias effect occurred in the period of time under study. Under these circumstances, an insurance company cannot obtain a productivity advantage through the choice of the mix of inputs or the mix of outputs. In the case of the institutional form, the private insurance companies exhibited on average a productivity growth slightly higher than the mutualities and, for both institutional forms, the technical efficiency change effect was close to one.
Our findings have clear policy implications. A principle of the First Directives of the European Union was the specialization of insurance firms into just one branch. The Third Directives relaxed this principle because it was not demonstrated, in practice, that an insurance system based on specialized firms gave better coverage than one based on multi-branch firms. This paper shows that firms combining two or three product lines perform better than specialized ones. In the light of these results, the remaining restrictions, if any, from the Third Directives regarding the operations of multi-branch firms must be removed. Moreover, some kind of incentive should be given, or at least there should be a lifting of the threat of penalization, in order to encourage the transformation of specialized insurance firms into multi-branch companies.
References
Aigner, D.J., C.A.K Lovell, and P. Schmidt (1977), “Formulation and Estimation of Stochastic Frontier Production Function Models.” Journal of Econometrics 6: 21-37. Battese, G.E., and T.J. Coelli (1988), “Prediction of Firm-Level Technical Efficiencies with a Generalised Frontier Production Function and Panel Data.” Journal of Econometrics 38: 387-399.
Berger, A.N. and D.B. Humphrey (1993), “Measurement and Efficiency Issues in Commercial Banking.” Z. Griliches, (ed.), Output Measurement in the Service Sectors. National Bureau of Economic Research Studies in Income and Wealth, 56, Chicago and London, University of Chicago Press: 245-279.
Burgess, J. and G. Walter (1982), “Returns to Scale in the Australian Life Insurance Industry: A Comment.” The Economic Record 58: 245 – 279.
Coelli, T.J. (1996), “A Guide to FRONTIER Version 4.1: A Computer Program for Frontier Production Function Estimation.” CEPA Working Paper 96/07, Department of Econometrics, University of New England, Armidale (Australia).
Coelli, T.J. (2000), “On the Econometric Estimation of the Distance Function Representation of a Production Technology.” CORE DP 2000/42, Université Catholique de Louvain.
Coelli, T.J. and S. Perelman (1999), “A Comparison of Parametric and Non-parametric Distance Functions: With Application to European Railways.” European Journal of Operations Research 117: 326-339.
Cummins, J.D. and M.A. Weiss (2000), “Analyzing Firm Performance in the Insurance Industry Using Frontier Efficiency and Productivity Methods.” in G. Dionne (ed.), “Handbook on Insurance.” Kluwer Academic Press, Boston.
Cummins, J.D., M. Rubio-Misas and H. Zi (2004), “The Effect of Organizational Structure on Efficiency: Evidence from the Spanish Insurance Industry.” Journal of Banking and Finance 28: 3113-3150.
Debreu, G. (1951), “The Coefficient of Resource Utilization.” Econometrica 19: 273-292.
Delhausse, B., F. Fecher, S. Perelman and P. Pestieau (1995), “Measuring Productive Performance in the Non-Life Insurance Industry: The Case of French and Belgian Markets.” Tijdschrift voor Economie en Management 40: 47-69.
Farrell, M.J. (1957), “The Measurement of Productive Efficiency.” Journal of the Royal Statistical Society, A CXX, Part 3: 253-290.
Färe, R., S. Grosskopf, B. Lindgren and P. Roos (1992), "Productivity Changes in Swedish Pharmacies 1980-1989: A Non-Parametric Malmquist Approach," Journal of Productivity Analysis 3(1/2), June: 85-101.
Färe, R., S. Grosskopf, B. Lindgren and P. Roos (1994[1989]), “Productivity Developments in Swedish Hospitals: A Malmquist Output Index Approach.” In A. Charnes, W.W. Cooper, A. Y. Lewin and L.M. Seiford (eds.), Data Envelopment Analysis: Theory, Methodology and Applications. Kluwer Academic Publishers: Boston [this paper was presented at the Conference on New Uses of DEA in Management and Public Policy, University of Texas, Austin, September 27-29, 1989].
Färe, R. and S. Grosskopf (1996), Intertemporal Production Frontiers: With Dynamic DEA. Kluwer Academic Press, Boston.
Färe, R., E. Grifell-Tatjé, S. Grosskopf and C.A.K. Lovell (1997), “Biased Technical Change and the Malmquist Productivity Index.” The Scandinavian Journal of Economics 99(1): 119-127.
Fecher, F., D. Kessler, S. Perelman and P. Pestieau (1993), “Productive Performance of the French Insurance Industry.” Journal of Productivity Analysis 4: 77-93.
Fuentelsaz, L. and J. Gomez (2001), “Strategic and Queue Effect on Entry in Spanish Banking.” Journal of Economics and Management Strategy 10(4): 529-563.
Fuentelsaz, L., J. Gomez and Y. Polo (2002), “Followers’ Entry Timing: Evidence from the Spanish Banking Sector after Deregulation.” Strategic Management Journal 23(3): 245-264.
Fuentes, H., E. Grifell-Tatjé and S. Perelman (2001), “A Parametric Distance Function Approach for Malmquist Productivity Index Estimation.” Journal of Productivity Analysis 15: 79-94.
Grifell-Tatjé, E. and C.A.K. Lovell (1995), “A Note on the Malmquist Productivity Index.” Economics Letters 47: 169-75.
Grifell-Tatjé, E. and C.A.K. Lovell (1996), “Deregulation and Productivity Decline: The Case of Spanish Savings Banks.” European Economic Review 40(6): 1281-1303. Grifell-Tatjé, E. and C.A.K. Lovell (1997), “The Sources of Productivity Change in Spanish Banking.” European Journal of Operational Research 98(2): 364-380.
Grifell-Tatjé, E. and C.A.K. Lovell (1999), “Profits and Productivity.” Management Science 45(9): 1177-1193.
Hornstein, A. and E. C. Prescott (1991), “Measures of Insurance Sector Output.” The Geneva Papers on Risk and Insurance 16(59): 191-206.
Jondrow, J., C.A.K. Lovell, I.S. Materov and P. Schmidt (1982), “On Estimation of Technical Inefficiency in the Stochastic Frontier Production Function Model.” Journal of Econometrics 19: 233-238.
Lado Coustré, N. and M.A. Martinez (1997), “Market Orientation and Business Performance in the Spanish Insurance Sector.” The Geneva Papers on Risk and Insurance 22 (85): 571-590.
Lado Coustré, N. and A. Maydeu-Olivares (2001), “Exploring the Link Between Market Orientation and Innovation in the European and US Insurance Markets.” International Marketing Review 18(2): 130-144.
Lovell, C.A.K., S. Richardson, P. Travers and L.L. Wood (1994), “Resources and Functionings: A New View of Inequality in Australia.” W. Eichhorn (ed.), Models and Measurement of Welfare and Inequality, Berlin, Springer Verlag.
Lloydwilliams, D.M. and P. Molyneux (1994), “Market-structure and Performance in Spanish Banking,” Journal of Banking and Finance 18(3): 433-443.
Martinez, M.A. (1995), “Organization and Strategy in Insurance: Empirical Research into the Sector in Spain.” The Geneva Papers on Risk and Insurance 20 (74): 84-100. Martinez, M.A., I. Albarrán and D. Camino (2001), “Executive Management in Insurance Entities: A Comparative Study of Mutual Companies and Joint-Stock Companies in Spain with a View to the 21st Century Market.” The Geneva Papers on Risk and Insurance 26(2): 206-231.
Maydeu-Olivares, A. and N. Lado Coustré (2003), “Market Orientation and Business Economic Performance. A Mediated Model.” International Journal of Service Industry Management 14 (3): 284-309.
Meeusen, W. and J. van den Broeck (1977), “Efficiency Estimation from Cobb-Douglas Production Functions with Composed Error.” International Economic Review 18: 435-444.
O’Brien, C.D. (1991), “Measuring Output Life Assurance Companies.” The Geneva Papers on Risk and Insurance 16: 207-235.
Orea, L. (2002), “A Parametric Decomposition of a Generalized Malmquist Productivity Index.” Journal of Productivity Analysis 18: 5-22.
Pastor, J.M. (1995), “Productividad, Eficiencia y Cambio Técnico en los Bancos y Cajas de Ahorro Españolas.” Doctoral Thesis, Departamento de Análisis Económico. Universitat de Valencia.
Purroy, P. and V. Salas (2000), “Strategic Competition in Retail Banking under Expense Preference Behavior.” Journal of Banking and Finance 24(5): 809-824.
Shephard, R. W. (1970), The Theory of Cost and Production Functions. Princeton: Princeton University Press.
Vives, X. (1990), “Deregulation and Competition in Spanish Banking.” European Economic Review 34 (2/3): 403 – 411.
Table 1: Institutional Forms in the Spanish Insurance Industry
Health Life Liabilities
Property-(PL)
Health &
Property-Liabilities (H&PL)
Health, Property-Liabilities & Life
(H,PL&L) Number of observations Mutual 3% row 2% column 18 Number 1% row 1% column 5Number 36% row 36% column 231Number 42% row 20% column 267 Number 19% row 14% column 120 Number 100% row 16% column 641 Number Private 23% row 97% column 732 Number 13% row 91% column 422Number 12% row 61% column 393 Number 30% row 72% column 961 Number 22% row 84% column 694 Number 100% row 79% column 3,202 Number Foreign Trade Branches 0% row 0% column 1 Number 21% row 8% column 39Number 9% row 3% column 17 Number 61% row 8% column 114 Number 9% row 2% column 17 Number 100% row 5% column 188 Number Total 19% row 100% column 751 Number 12% row 100% column 466 Number 16% row 100% column 641 Number 33% row 100% column 1,342 Number 21% row 100% column 831 Number 100% row 100% column 4,031 Number
Table 2: Summary Statistics for the Spanish Insurance Industry by Specialization, 1987 – 1997a (Values in 103 Euros).
Health
1987 1988 1989 1990 1991 1992 1993 1994 1995 1996 1997 Outputs Health premiums Arithmetic mean 4,559 4,961 5,619 7,059 8,088 9,958 11,215 11,486 13,545 14,626 17,346 Stand. deviation 17,285 18,917 21,625 24,568 29,901 35,520 38,116 38,896 43,340 46,497 52,249 Inputs Labor costs Arithmetic mean 424 448 538 654 720 855 964 981 1,184 1,175 1,471 Stand. deviation 1,431 1,535 2,012 2,214 2,550 2,847 3,123 3,140 3,693 3,767 4,689 Operating expenses Arithmetic mean 280 295 342 419 411 495 571 586 688 755 916 Stand. deviation 1,019 1,058 1,289 1,423 1,389 1,581 1,744 1,719 1,957 2,189 2,499 Number of companies 61 62 61 64 71 67 64 65 58 55 49Property - Liabilities
(PL) 1987 1988 1989 1990 1991 1992 1993 1994 1995 1996 1997 Outputs Property-Liabilities premiums Arithmetic mean 3,088 3,552 4,172 4,870 3,102 6,582 6,662 7,133 8,361 9,575 10,211 Stand. deviation 10,028 12,368 15,114 18,194 4,899 22,171 21,322 22,536 25,071 26,652 26,398 Inputs Labor costs Arithmetic mean 993 1,084 1,138 1,274 1,034 1,716 1,817 2,041 2,280 2,545 2,779 Stand. deviation 2,597 2,942 3,231 3,504 2,034 4,162 4,181 4,415 4,769 5,129 5,550 Operating expenses Arithmetic mean 326 365 408 447 493 677 804 895 965 1,054 1,226 Stand. deviation 913 1,135 1,259 1,210 945 1,191 1,375 1,529 1,778 1,863 2,301 Number of companies 46 47 53 54 57 56 59 54 50 47 47