Journal of Personality and Social Psychology 1988. Vol. 54. No. 6, 1063-1070
Copyright 1988 by the American Psychological Association, Inc. G022-35l4/88/$00.75
Development and Validation of Brief Measures of Positive
and Negative Affect: The PANAS Scales
David Watson and Lee Anna Clark
Southern Methodist University
Auke Tellegen
University of Minnesota
In recent studies of the structure of affect, positive and negative affect have consistently emerged as two dominant and relatively independent dimensions. A number of mood scales have been created to measure these factors; however, many existing measures are inadequate, showing low reliability or poor convergent or discriminant validity. To fill the need for reliable and valid Positive Affect and Negative Affect scales that are also brief and easy to administer, we developed two 10-item mood scales that comprise the Positive and Negative Affect Schedule (PANAS). The scales are shown to be highly internally consistent, largely uncorrelated, and stable at appropriate levels over a 2-month time period. Normative data and factorial and external evidence of convergent and discriminant validity for the scales are also presented.
Two dominant dimensions consistently emerge in studies of
affective structure, both in the United States and in a number
of other cultures. They appear as the first two factors in factor
analyses of self-rated mood and as the first two dimensions in
multidimensional scalings of facial expressions or mood terms
(Diener, Larsen, Levine, & Emmons, 1985; Russell, 1980,
1983; Stone, 1981; Watson, Clark, & Tellegen, 1984; Zevon &
Tellegen, 1982).
Watson and Tellegen (1985) have summarized the relevant
evidence and presented a basic, consensual two-factor model.
Whereas some investigators work with the unrotated
dimen-sions (typically labeled pleasantness-unpleasantness and
arousal), the varimax-rotated factors—usually called Positive
Affect and Negative Affect—have been used more extensively in
the self-report mood literature; they are the focus of this article.
Although the terms Positive Affect and Negative Affect might
suggest that these two mood factors are opposites (that is,
strongly negatively correlated), they have in fact emerged as
highly distinctive dimensions that can be meaningfully
repre-sented as orthogonal dimensions in factor analytic studies of
affect.
Briefly, Positive Affect (PA) reflects the extent to which a
per-son feels enthusiastic, active, and alert. High PA is a state of
high energy, full concentration, and pleasurable engagement,
whereas low PA is characterized by sadness and lethargy. In
con-trast, Negative Affect (NA) is a general dimension of subjective
distress and unpleasurable engagement that subsumes a variety
of aversive mood states, including anger, contempt, disgust,
guilt, fear, and nervousness, with low NA being a state of
calm-We wish to thank Lisa Binz, Sondra Brumbelow, Richard Cole, Mary Dieffenwierth, Robert Folger, Jay Leeka, Curt Mclntyre, James Pen-nebaker, and Karen Schneider for their help in collecting the data re-ported in this article.
Correspondence should be addressed to David Watson, Department of Psychology, Southern Methodist University, Dallas, Texas, 75275.
ness and serenity. These two factors represent affective state
di-mensions, but Tellegen (1985; see also Watson & Clark, 1984)
has demonstrated that they are related to corresponding
affec-tive trait dimensions of posiaffec-tive and negaaffec-tive emotionality
(indi-vidual differences in positive and negative emotional reactivity).
Trait PA and NA roughly correspond to the dominant
personal-ity factors of extraversion and anxiety/neuroticism, respectively
(Tellegen, 1985; Watson & Clark, 1984). Drawing on these and
other findings, Tellegen has linked trait NA and PA, respectively,
to psychobiological and psychodynamic constructs of
sensitiv-ity to signals of reward and punishment. He has also suggested
that low PA and high NA (both state and trait) are major
distin-guishing features of depression and anxiety, respectively
(Tel-legen, 1985; see also Hall, 1977).
Numerous PA and NA scales have been developed and
stud-ied in a variety of research areas. Generally speaking, the
find-ings from these studies indicate that the two mood factors relate
to different classes of variables. NA—but not PA—is related to
self-reported stress and (poor) coping (Clark & Watson, 1986;
Kanner, Coyne, Schaefer, & Lazarus, 1981; Wills, 1986), health
complaints (Beiser, 1974;Bradburn, 1969; Tessler & Mechanic,
1978; Watson & Pennebaker, in press), and frequency of
un-pleasant events (Stone, 1981; Warr, Barter, & Brownbridge,
1983). In contrast, PA—but not NA—is related to social
activ-ity and satisfaction and to the frequency of pleasant events
(Beiser, 1974; Bradburn, 1969; Clark & Watson, 1986, 1988;
Watson, 1988).
Anomalous and inconsistent findings have also been
re-ported, however. For example, whereas most studies have found
these NA and PA scales to have low or nonsignificant
corre-lations with one another (e.g., Clark & Watson, 1986, 1988;
Harding, 1982; Moriwaki, 1974; Warr, 1978; Wills, 1986),
oth-ers have found them to be substantially related (Brenner, 1975;
Diener & Emmons, 1984; Kammann, Christie, Irwin, &
Dixon, 1979). There are many possible explanations for such
inconsistencies (e.g., see Diener & Emmons, 1984), but one that
must be considered concerns the various scales themselves. It
1063
may be, for example, that some scales are simply better, purer measures of the underlying factors than are others. Watson (in press) reported evidence supporting this idea. He found that some scale pairs (such as those used by Diener and his associates in a number of studies; e.g., Diener & Emmons, 1984; Diener & Iran-Nejad, 1986; Diener et al., 1985) yield consistently higher NA-PA correlations than do others (such as our own scales, to be described shortly).
More generally, one must question the reliability and validity of many of these measures. Some mood scales have been devel-oped through factor analysis (e.g., Stone, 1981), but others have been constructed on a purely ad hoc basis with no supporting reliability or validity data (e.g., McAdams & Constantian, 1983). Watson (in press) analyzed the psychometric properties of several popular measures and found many of them to be wanting, at least for use in student populations. For example, Bradburn's (1969) widely used NA and PA scales were unreli-able (coefficient a = .52 for NA, .54 for PA) and only moder-ately related to other measures of the same factor (for NA, the convergent correlations ranged from .39 to .52; for PA, they ranged from .41 to .53). The short PA and NA scales used by Stone and his colleagues (Hedges, Jandorf, & Stone, 1985; Stone, 1987; Stone, Hedges, Neale, & Satin, 1985) were also unreliable (in two samples, the NA scale had coefficient as of .48 and .52, whereas the PA scale had corresponding values of .64 and .70).
Clearly there is a need for reliable and valid PA and NA scales that are also brief and easy to administer. In this article we de-scribe the development of such scales, the 10-item NA and PA scales that comprise the Positive and Negative Affect Schedule (PANAS), and present reliability and validity evidence to sup-port their use.
Development of the PANAS Scales
Much of our previous mood research has been concerned with identifying these dominant dimensions of affect and clari-fying their nature (Clark & Watson, 1986,1988;Tellegen, 1985; Watson, in press; Watson & Clark, 1984; Watson et al., 1984; Watson & Tellegen, 1985; Zevon & Tellegen, 1982). To have a broad and representative sample of mood descriptors, we have used questionnaires that contained a large number (57-65) of mood terms. Once the basic NA and PA factors were clearly identified, however, we wanted to measure them more simply and economically. We therefore turned our attention to the de-velopment of brief PA and NA scales.
Our greatest concern was to select terms that were relatively pure markers of either PA or NA; that is, terms that had a sub-stantial loading on one factor but a near-zero loading on the other. As a starting point, we used the 60 terms included in the factor analyses reported by Zevon and Tellegen (1982). This sample of descriptors was constructed by selecting three terms from each of 20 content categories; for example, the terms guilty, ashamed, and blameworthy comprise the guilty category (see Zevon & Tellegen, 1982, Table 1). The categories were iden-tified through a principal-components analysis of content sort-ings of a large sample of descriptors and provide a comprehen-sive sample of the affective lexicon.
From this list we selected those terms that had an average loading of .40 or greater on the relevant factor across both the
R- and P-analyses reported in Zevon & Tellegen (1982). Twenty PA markers and 30 NA markers met this initial criterion. How-ever, as noted previously, we were also concerned that the terms not have strong secondary loadings on the other factor. We therefore specified that a term could not have a secondary load-ing of |.25| or greater in either analysis. This reduced the pool of candidate descriptors to 12 for PA and 25 for NA.
Preliminary reliability analyses convinced us that 10 terms were sufficient for the PANAS PA scale; we therefore dropped 2 terms (delightedand healthy) that had relatively high secondary loadings on NA. This yielded the final list of 10 descriptors for the PA scale: attentive, interested, alert, excited, enthusiastic, inspired, proud, determined, strong and active.
The 25 NA candidate terms included all 3 terms from seven of the content categories (distressed, angry, contempt, revul-sion, fearful, guilty, and jittery) and 2 from each of two others (rejected and angry at self). Because we wanted to tap a broad range of content, we constructed a preliminary 14-item scale that included 2 terms from each of the seven complete triads. We found, however, that the contempt and revulsion terms did not significantly enhance the reliability and validity of the scale. Moreover, these terms were less salient to our subjects and were occasionally left unanswered. We therefore settled on a final 10-item version that consisted of 2 terms from each of the other five triads: distressed, upset (distressed); hostile, irritable (angry); scared, afraid (fearful); ashamed, guilty (guilty); and nervous, jittery (jittery). The final version of PANAS is given in the
Ap-pendix.
Reliability and Validity of the PANAS Scales
Subjects and Measures
The basic psychometric data were gathered primarily from undergraduates enrolled in various psychology courses at Southern Methodist University (SMU), a private southwestern university. The students participated in return for extra course credit. In addition, groups of SMU employees completed ques-tionnaires asking how they felt "during the past few weeks" (« = 164) and "during the past few days" (n - 50). A sample of 53 adults not affiliated with SMU also filled out a mood form with "today" time instructions. Preliminary analyses revealed no systematic differences between student and nonstudent re-sponses, and they have been combined in all analyses. Neverthe-less, because most of our data were collected from college stu-dents, it is important to establish that the PANAS scales also work reasonably well in adult and clinical samples. We briefly address this issue in a later section.
The mood questionnaire consisted of a single page with the 60 Zevon and Tellegen (1982) descriptors arrayed in various orders. The subjects were asked to rate on a 5-point scale the extent to which they had experienced each mood state during a specified time frame. The points of the scale were labeled very slightly or not at all, a little, moderately, quite a bit, and very much, respectively. The PANAS terms were randomly distrib-uted throughout the questionnaire. It is important to note that we have since used the 20 PANAS descriptors without these ad-ditional terms and obtained essentially identical results (Clark & Watson, 1986; Watson, 1988).
instruc-DEVELOPMENT AND VALIDATION OF THE PANAS SCALES 1065
Table 1
Positive and Negative Affect Schedule (PANAS) Scale Means and Standard Deviations/or Each Rated Time Frame
PANAS PA Time
instructions Moment Today
Past few days
Past few weeks Year General Scale n 660 657 1,002 586 649 663 M 29.7 29.1 33.3 32.0 36.2 35.0 SD 7.9 8.3 7.2 7.0 6.3 6.4 PANAS NA Scale M 14.8 16.3 17.4 19.5 22.1 18.1 SD 5.4 6.4 6.2 7.0 6.4 5.9
Note. PA = Positive Affect. NA = Negative Affect.
tions. Subjects were asked to rate how they felt (a) "right now (that is, at the present moment)" (moment instructions); (b) "today" (today); (c) "during the past few days" (past few days); (d) "during the past week" (week); (e) "during the past few weeks" (past few weeks); (f) "during the past year" (year); and (g) "in general, that is, on the average" (general). For six of these time frames, we collected data on large samples to be used for normative, internal consistency, and factor analyses. The ns are 660 (moment), 657 (today), 1,002 (past few days), 586 (past few weeks), 649 (year), and 663 (general). These samples are largely but not completely independent: Some subjects completed mood forms involving two or more different temporal instruc-tions; such multiple ratings were always spaced at least 1 week apart. In addition, a subset of these subjects (n = 101) com-pleted ratings on all seven time frames on two different occa-sions, providing retest data.
Normative and Reliability Data
Basic scale data. Table 1 presents basic descriptive data on
the PANAS PA and NA scales for the various time instructions. Given the large sample sizes, these provide reasonably good col-lege student norms. In our data, we have not found any large or consistent sex differences, so the data are collapsed across sex. Nevertheless, it seems advisable to test for sex differences in any new (especially nonstudent) sample.
Inspecting Table 1, one sees that subjects report more PA than NA, regardless of the time frame. Moreover, mean scores on both scales tend to increase as the rated time frame length-ens. This pattern is expectable: As the rated time period in-creases, the probability that a subject will have experienced a significant amount of a given affect also increases.
The PANAS scale intercorrelations and internal consistency reliabilities (Cronbach's coefficient a) are reported in Table 2. The alpha reliabilities are all acceptably high, ranging from .86 to .90 for PA and from .84 to .87 for NA. The reliability of the scales is clearly unaffected by the time instructions used.
The correlation between the NA and PA scales is invariably low, ranging from -.12 to -.23; thus, the two scales share ap-proximately 1 % to 5% of their variance. These discriminant val-ues indicate quasi-independence, an attractive feature for many purposes, and are substantially lower than those of many other short PA and NA scales (see Watson, in press). Interestingly,
our PA-NA correlation was unaffected by the rated time frame, whereas Diener and Emmons (1984) found that the correlation between their PA and NA scales decreased as the rated time frame lengthened. However, this discrepancy is beyond the scope of our article; see Watson (in press) for a detailed discus-sion of the effects of different temporal instructions on various mood scales.
Tesl-retest reliability. As noted previously, 101 SMU
under-graduates filled out PANAS ratings for each of the seven time frames on two different occasions. The mood ratings were col-lected at weekly intervals. The first set of ratings was colcol-lected during Weeks 1-7 of the fall 1986 semester in the following or-der: year, past few days, today, past few weeks, general, moment, and week. Then, following a 1-week break, the PANAS scales were readministered during Weeks 9-15 in the same sequence. Thus, each scale was retested after an 8-week interval.
These reliability data are shown in Table 3. The NA and PA stability values were first compared at each rated time frame and no significant differences were found (p > .05, 2-tailed t test). Multiple comparisons were then made across the time frames for each affect separately (p < .002, Bonferroni cor-rected for 21 comparisons). Not surprisingly, the retest stability tends to increase as the rated time frame lengthens. Ratings of longer time periods, such as how one has felt during the past few weeks or the past year, are implicit aggregations. In a sense, subjects average their responses over a longer time frame and hence over more occasions. Thus, these data replicate the fre-quent finding that stability rises with increasing temporal ag-gregation (e.g., Diener & Larsen, 1984; Epstein, 1979). The sta-bility coefficients of the general ratings are high enough to sug-gest that they may in fact be used as trait measures of affect.
It is also noteworthy that the PANAS scales exhibit a signifi-cant level of stability in every time frame, even in the moment ratings. These results are also consistent with earlier findings (e.g., Watson & Clark, 1984, Table 8) and reflect the strong dis-positional component of affect. That is, even momentary moods are, to a certain extent, reflections of one's general affective level (Costa & McCrae, 1980; Watson & Clark, 1984).
Generatizability to nonstudent samples. Our largest
nonstu-dent sample consisted of 164 SMU employees who rated how they had felt during the past few weeks. A separate analysis of this sample yielded results comparable with the values listed in
Table 2
Internal Consistency Reliabilities (Coefficient A Ipha) and Scale Intercorrelations
Alpha reliabilities Time
instructions Moment Today Past few days Past few weeks Year General n 660 657 1,002 586 649 663 PANAS PA scale .89 .90 .88 .87 .86 .88 PANAS NA scale .85 .87 .85 .87 .84 .87 PA-NA intercor-relation -.15 -.12 -.22 -.22 -.23 -.17 Note. PANAS = Positive and Negative Affect Schedule. PA = Positive Affect. NA = Negative Affect.
Table 3
Test-Retesl Reliabilities of the Positive and Negative Affect Schedule (PANAS) Scales (S- Week Relest Interval)
Time instructions Moment Today Past few days Past week Past few weeks Year General PANAS PA scale .54* .47" .48" .47' .58" .63'" .68' PANAS NA scale .45" .39" .42" .47" .48" .60"" .71' Note. n= 101. Coefficients not sharing the same superscript are differ-ent at p < .05 (two-tailed, Bonferroni corrected for multiple compari-sons). PA = Positive Affect. NA = Negative Affect. Significance tests are computed separately for each scale. See text for further details.
Table 2. Specifically, the alpha reliabilities of the PANAS PA
and NA scales were .86 and .87, respectively, and the correlation
between the scales was —.09. Given these data, we believe that
the PANAS scales will provide useful information in adult
sam-ples as well, although further data are desirable to establish this
fully.
We have also collected data on a small (« = 61) psychiatric
inpatient sample using the general instructions. Again, the
PA-NAS scales were reliable (for PA, a = .85; for NA, a = .91) and
only moderately intercorrelated with one another (r = —.27).
Given the small sample size, these data cannot be considered
definitive, but they are encouraging and suggest that the PANAS
scales retain their reliability and quasi-independence in clinical
samples. In addition, all but four of the patients retook the
mea-sure after a 1-week interval, and the resulting stability analyses
yielded high test-retest reliabilities: .81 for NA and .79 for PA.
Finally, consistent with previous studies (Watson & Clark,
1984), we found significant group differences for NA, with the
patients considerably higher (M = 26.6) and more variable
(SD = 9.2) than the normative group (M = 18.1, SD = 5.9; see
Table 1). The corresponding differences for PA (patient group
M = 32.5, SD = 7.5; normative group M = 35.0, SD = 6.4)
were also statistically significant because of the very large n of
the normative sample, but it would be premature to accept a
mean scale difference of 2.5 points as clinically meaningful
without further study.
Factorial Validity
Scale validity. An important step in evaluating the PANAS scales is to demonstrate that they adequately capture the under-lying mood factors. To do this, we subjected ratings on the 60 Zevon and Tellegen (1982) mood descriptors in each of the six large data sets to a principal factor analysis with squared multi-ple correlations as the communality estimates. Two dominant factors emerged in each solution. Together, they accounted for roughly two thirds of the common variance, ranging from 62.8% in the moment solution to 68.7% in the general ratings. The first two factors in each solution were then rotated to or-thogonal simple structure according to the varimax criterion.
Each of the six solutions generated two sets of factor scoring weights that can be used to compute regression estimates of the
underlying PA and NA factors in those data. Within each data set, we then correlated these estimated factor scores with the PANAS PA and NA scales. The results, shown in Table 4, dem-onstrate the expected convergent/discriminant pattern: Both PANAS scales are very highly correlated with their correspond-ing regression-based factor scores in each solution, with conver-gent correlations ranging from .89 to .95, whereas the discrimi-nant correlations are quite low, ranging from —.02 to —. 18.
Item validity. It is also important to demonstrate the factorial validity of the individual PANAS items. To do this, we factored subjects' ratings on the 20 PANAS descriptors in each of the six data sets; as before, we used a principal factor analysis with squared multiple correlations as the initial communality esti-mates. Because the PANAS terms were selected to be relatively pure factor markers, it is not surprising that two dimensions accounted for virtually all of the common variance in these so-lutions (ranging from 87.4% in the moment data to 96.1 % in the general ratings).
Median varimax loadings for the PANAS terms on these two factors are presented in Table 5. All of the descriptors have strong primary loadings (.50 and above) on the appropriate fac-tor, and the secondary loadings are all acceptably low. Thus, all of the PANAS items are good markers of their corresponding factors.
Rating scale effects. The data shown in Tables 1 through 5 are all based on the same 5-point rating scale. Because the sub-jects were instructed to rate the extent to which they experi-enced each mood state, this may be termed an extent format. It seems reasonable to ask, however, whether different response formats might yield different results. Warr et al. (1983) have presented data indicating that the correlation between PA and NA scales varies according to the response scale used. Specifi-cally, their PA and NA scales were highly correlated when they used a frequency-type format in which subjects rated the pro-portion of time they had experienced each mood state during a specified time period.
To test the effect of rating format, we collected ratings on 54 mood terms in two different student samples, both using past few weeks time instructions. In the first sample, 413 subjects rated their mood using the usual extent rating format. In the second, 338 students rated themselves on a 4-point frequency
Table 4
Correlations Between the Positive and Negative Affect Schedule (PANAS) Scales and Scores of the First Two
Varimax Factors in Each Sample PANAS PA scale Time
instructions Moment Today Past few days Past few weeks Year General correlations
n
660 657 1,002 586 649 663 Factor 1 -.02 -.02 -.15 -.10 -.17 -.08 Factor 2 .95 .95 .92 .92 .89 .94 PANAS NA scale correlations Factor 1 .91 .93 .93 .92 .93 .93 Factor 2 -.15 -.11 -.10 -.18 -.09 -.12 Note. Factor analyses are based on the set of 60 mood terms reported in Zevon & Tellegen (1982). PA = Positive Affect. NA = Negative Affect.DEVELOPMENT AND VALIDATION OF THE PANAS SCALES 1067
Table 5
Median Varimax-Rotated Factor Loadings of the Positive and Negative Affect Schedule (PANAS)
Descriptors Across the Six Solutions
PANAS descriptor Enthusiastic Interested Determined Excited Inspired Alert Active Strong Proud Attentive Scared Afraid Upset Distressed Jittery Nervous Ashamed Guilty Irritable Hostile Positive Affect .75 .73 .70 .68 .67 .63 .61 .60 .57 .52 .01 .01 -.12 -.16 .00 -.04 -.12 -.06 -.14 -.07 Loading on Negative Affect -.12 -.07 -.01 .00 -.02 -.10 -.07 -.15 -.10 -.05 .74 .70 .67 .67 .60 .60 .59 .55 .55 .52
format (the options were little or none of the time, some of the
time, a good part of the time, and most of the lime).
In addition to the PANAS terms, the mood descriptors used in these samples allowed us to compare the factorial validity of our scales with those of other investigators. In both samples, we were able to measure the brief NA and PA scales developed by Diener and Emmons (1984, Studies 3 through 5; see also Diener & Iran-Nejad, 1986; Diener & Larsen, 1984; Diener et al., 1985), Stone and his associates (Hedges et al., 1985; Stone, 1987; Stone et al, 1985), and McAdams and Constantian (1983). Further, in the extent sample, 301 subjects rated them-selves on Bradburn's (1969) widely used NA and PA scales; these were replaced by Warr et al.'s (1983) revised measures in the frequency sample.
The ratings in each sample were subjected to separate princi-pal factor analyses with squared multiple correlations in the di-agonal (these analyses are reported in detail in Watson, in press). Two large factors emerged in each solution, accounting for 75.4% and 73.3% of the common variance in the extent and frequency data, respectively. The first two factors in each solu-tion were therefore rotated using varimax.
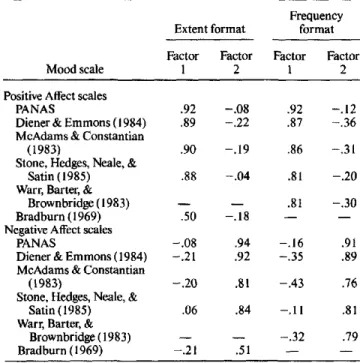
Table 6 presents correlations between the various mood scales and regression estimates of these factors. Considering first the PANAS scales, Table 6 demonstrates that they have excel-lent factorial validity even when a frequency response format is used: In both samples the convergent correlations are above .90 and the discriminant coefficients are all low. Thus, while we prefer an extent-type rating scale, other response formats can be used without diminishing the factorial validity of the scales. Table 6 also demonstrates that the PANAS scales compare favorably with other brief affect measures. With the exception of the Bradburn scales, all of the mood scales have good
conver-gent correlations (i.e., .76 to .92) with the appropriate factor, but none are higher than the corresponding values for the PA-NAS scales. Thus, in terms of convergent validity, most of these scales are reasonable approximations of the underlying factors, although some are clearly more precise representations than others. The discriminant correlations vary widely, however, es-pecially in the frequency-format data, where many of the co-efficients exceed -.30; across both samples, only the PANAS scales have discriminant correlations consistently under —.20. Overall, the PANAS scales offer the clearest convergent/dis-criminant pattern of any pair.
In summary, the PANAS scales provide reliable, precise, and largely independent measures of Positive Affect and Negative Affect, regardless of the subject population studied or the time frame and response format used.
External Validity
Correlations with measures oj distress and psychopathology.
It is also interesting to examine correlations between the PA-NAS scales and measures of related constructs, such as state anxiety, depression, and general psychological distress (for an extended discussion of how Positive and Negative Affect relate to anxiety, depression, and general psychological dysfunction, see Tellegen, 1985; Watson & Clark, 1984). We have used the PANAS scales in conjunction with a number of other com-monly used measures and report here on three of them: the Hopkins Symptom Checklist (HSCL; Derogatis, Lipman,
Rick-Table 6
Correlations Between Various Positive Affect (PA) and Negative Affect (NA) Mood Scales and the Factor Scores From the Extent- and Frequency-Format Data
Extent format
Mood scale Positive Affect scales
PANAS
Diener & Emmons ( 1 984) McAdams & Constantian
(1983)
Stone, Hedges, Neale, & Satin (1985) Warr, Barter, &
Brownbridge(I983) Bradburn (1969) Negative Affect scales
PANAS
Diener & Emmons (1984) McAdams & Constantian
(1983)
Stone, Hedges, Neale, & Satin (1985) Warr, Barter, &
Brownbridge(1983) Bradburn (1969) Factor 1 .92 .89 .90 .88 —.50 -.08 -.21 -.20 .06 — -.21 Factor 2 -.08 -.22 -.19 -.04 — -.18 .94 .92 .81 .84 — .51 Frequency format Factor 1 .92 .87 .86 .81 .81 — -.16 -.35 -.43 -.11 -.32 — Factor 2 -.12 -.36 -.31 -.20 -.30 — .91 .89 .76 .81 .79 —
Note. «s with the extent-format factors ranged from 301 to 413. ns with
the frequency-format factors ranged from 336 to 338. PANAS = Posi-tive and NegaPosi-tive Affect Schedule.
Table 7
Correlations Between the Positive and Negative Affect Schedule (PANAS) Scales and the Hopkins Symptom Checklist (HSCL), Beck Depression Inventory (BDI), and STAI State Anxiety Scale (A -State)
Measure and PANAS time instructions HSCL
Past few weeks Today1
BDI
Past few days Past few weeks A-State
Past few weeks
Correlations with
n
398 53 880 208 203 PANAS NA .74 .65 .56 .58 .51 PANAS PA -.19 -.29 -.35 -.36 -.35Note. Unless otherwise noted, subjects are college students. PA -
Posi-tive Affect. NA = NegaPosi-tive Affect. " Normal adult sample.
els, Uhlenhuth, & Covi, 1974), the Beck Depression Inventory (BDI; Beck, Ward, Mendelson, Mock, & Erbaugh, 1961), and the State-Trait Anxiety Inventory State Anxiety Scale (A-State; Spielberger, Gorsuch, & Lushene, 1970).
The HSCL (Derogatis et al., 1974) is a measure of general distress and dysfunction. Subjects rate the extent to which they have experienced each of 58 symptoms or problems during the past week. The HSCL and a subsequent 90-item version, the SCL-90 (Derogatis, Rickels, & Rock, 1976), have been used fre-quently as measures of clinical symptomatology in both normal and clinical populations (e.g., Gotlib, 1984;Kanneretal., 1981; Rickels, Lipman, Garcia, & Fisher, 1972). Although the HSCL and SCL-90 each contain several subscales, analyses have re-peatedly shown that both instruments reflect a large general dis-tress factor (e.g., Dinning & Evans, 1977; Gotlib, 1984).
The BDI (Beck et al., 1961) is a 21-item self-report measure of depressive symptomatology. Subjects rate whether they have experienced each symptom during the past few days. The BDI is commonly used to assess mild to moderate levels of depres-sion, and studies have generally supported its validity in this context (e.g., Bumberry, Oliver, & McClure, 1978; Coyne & Gotlib, 1983; Hammen, 1980).
The A-State (Spielberger et al., 1970) is a 20-item scale that asks subjects to rate their current affect. Researchers have used the A-State to study subjects' responses to a variety of stressful and aversive events, including surgery, shock, pain, failure, criti-cism, interviews, and exams (see Watson & Clark, 1984).
Correlations between the PANAS scales and the HSCL, BDI, and A-State are presented in Table 7. Looking first at the HSCL, Table 7 indicates that it is largely a measure of NA, although it also shows modest (negative) correlations with PA. In fact, the correlations between the HSCL and the PANAS NA scale are high enough to suggest that the two measures are roughly inter-changeable, at least in normal populations. Insofar as this is the case, the PANAS NA scale seems to offer a shorter (10 vs. 58 items), simpler, and conceptually more straightforward mea-sure of general psychological distress.
The BDI is also substantially correlated with the PANAS NA scale, but the coefficients are not so high as to indicate
inter-changeability. In addition, the BDI has significant (negative) correlations with PA, consistent with previous findings that de-pressive symptomatology is affectively complex (Tellegen, 1985; Watson & Clark, 1984; Watson, Clark, & Carey, in press). That is, it involves the lack of pleasurable experiences (low PA) in addition to anger, guilt, apprehension, and genera.1 psychologi-cal distress (high NA). The PANAS spsychologi-cales offer the advantage of providing reliable and independent measures of these two affective components. Researchers interested in studying de-pressed affect might therefore want to use the PANAS scales as a complement to more traditional depression measures.
The A-State is also a mixture of high NA and low PA, repli-cating the results of Watson and Clark (1984, Table 4) using NA and PA factor scores. An inspection of the A-State's items indicates why this is the case. Many of the items tap mood states traditionally associated with anxiety (e.g., feeling tense, upset,
worried, anxious, nervous, jittery, and highstrung) or its absence
(e.g., feeling calm, relaxed, and content), and such items will produce a substantial correlation with the PANAS NA scale. Other (reverse-keyed) items, however, reflect pleasant or high PA states (e.g., feeling joyful, pleasant, self-confident, and
rested) that account for the A-State's significant correlation
with PA. The A-State has repeatedly demonstrated its useful-ness as a sensitive measure of unpleasant mood states; but, as with the BDI, the PANAS scales offer the advantage of assessing these two affective components separately.
Intraindividual analyses ofnontest correlates.1 When used with short-term time frame instructions (i.e., moment or to-day), the PANAS scales are sensitive to changing internal or ex-ternal circumstances. We have used the PANAS scales in three large scale within-subjects investigations that illustrate their usefulness in studying qualitatively distinctive intraindividual mood fluctuations. In the first (Watson, 1988), 80 subjects com-pleted a PANAS questionnaire each evening for 5-7 weeks, us-ing today time instructions. At each assessment the subjects also estimated their social activity (number of hours spent with friends that day) and rated the level of stress they had experi-enced. A total of 3,554 measurements were collected (M = 44.4 per subject). As hypothesized, within-subject variations in per-ceived stress were strongly correlated with fluctuations in NA but not in PA. Also, as expected, social activity was more highly related to PA than to NA.
The other two studies were primarily concerned with diurnal variation in mood. Clark and Watson (1986) had 123 subjects fill out a PANAS form every 3 waking hours for a week using moment time instructions. Subjects also rated their current stress and noted whether they had been interacting socially within the past hour. A total of 5,476 assessments were collected
(M = 44.9 per subject). Leeka (1987) replicated this design with
an additional 73 subjects (a total of 3,206 measurements; M -43.9 per subject). In both studies, perceived stress was again consistently correlated with intraindividual fluctuations in NA but not in PA. And, as before, social interaction was more strongly related to PA than to NA.
PA also showed a strong time-of-day effect in both studies. Specifically, PA scores tended to rise throughout the morning,
1 The data reported in Watson (1988) and Clark and Watson (1986)
are based on PA and NA factor scores. We have reanalyzed these data using the PANAS scales and have obtained virtually identical results.
DEVELOPMENT AND VALIDATION OF THE PANAS SCALES 1069
remain steady during the rest of the day, and then decline again during the evening. However, NA did not exhibit a significant diurnal pattern in either sample.
Conclusion
We have presented information regarding the development of brief scales to measure the two primary dimensions of mood— Positive and Negative Affect. Whereas existing scales are unreli-able, have poor convergent or discriminant properties, or are cumbersome in length, these 10-item scales are internally con-sistent and have excellent convergent and discriminant corre-lations with lengthier measures of the underlying mood factors. They also demonstrate appropriate stability over a 2-month time period. When used with short-term instructions (e.g., right
now or today), they are sensitive to fluctuations in mood,
whereas they exhibit traitlike stability when longer-term in-structions are used (e.g., past year or general). The scales corre-late at predicted levels with measures of recorre-lated constructs and show the same pattern of relations with external variables that have been seen in other studies. For example, the PA scale (but not the NA scale) is related to social activity and shows signifi-cant diurnal variation, whereas the NA scale (but not the PA scale) is significantly related to perceived stress and shows no circadian pattern.
Thus, we offer the Positive and Negative Affect Schedule as a reliable, valid, and efficient means for measuring these two important dimensions of mood.
References
Beck, A. X, Ward, C. H., Mendelson, M., Mock, J., & Erbaugh, J. (1961). An inventory for measuring depression. Archives of General
Psychiatry, 4, 561-571.
Beiser, M. (1974). Components and correlates of mental well-being.
Journal of Health and Social Behavior, IS, 320-327.
Bradburn, N. M. (1969). The structure of psychological well-being. Chi-cago: Aldine.
Brenner, B. (1975). Enjoyment as a preventive of depressive affect.
Jour-nal of Community Psychology, 3,346-357.
Bumberry, W., Oliver, J. M., & McClure, J. (1978). Validation of the Beck Depression Inventory in a university population using psychiat-ric estimate as a criterion. Journal of Consulting and Clinical
Psychol-ogy, 46, 150-155.
Clark, L. A., & Watson, D. (1986, August). Diurnal variation in mood:
Interaction with daily events and personality. Paper presented at the
meeting of the American Psychological Association, Washington, DC.
Clark, L. A., & Watson, D. (1988). Mood and the mundane: Relations between daily life events and self-reported mood. Journal of
Personal-ity and Social Psychology. 54, 296-308.
Costa, P. T., Jr., & McCrae, R. R. (1980). Influence of extraversion and neuroticism on subjective well-being: Happy and unhappy people.
Journal of Personality and Social Psychology, 38,668-678.
Coyne, J. C, & Gotlib, I. H. (1983). The role of cognition in depression: A critical appraisal. Psychological Bulletin, 94, 472-505.
Derogatis, L. R., Lipman, R. S., Rickels, K., Uhlenhuth, E. H., & Covi, L. (1974). The Hopkins Symptom Checklist (HSCL): A self-report symptom inventory. Behavioral Science, 19, 1-15.
Derogatis, L. R., Rickels, K., & Rock, A. (1976). The SCL-90 and the MMPI: A step in the validation of a new self-report scale. British
Journal of Psychiatry, 128, 280-289.
Diener, E., & Emmons, R. A. (1984). The independence of positive and
negative affect. Journal of Personality and Social Psychology, 47, 1105-1117.
Diener, E., & Iran-Nejad, A. (1986). The relationship in experience be-tween various types of affect. Journal of Personality and Social
Psy-chology, 50, 1031-1038.
Diener, E., & Larsen, R. J. (1984). Temporal stability and cross-situa-tional consistency of affective, behavioral, and cognitive responses.
Journal of Personality and Social Psychology, 47, 871-883.
Diener, E., Larsen, R. J., Levine, S., & Emmons, R. A. (1985). Intensity and frequency: Dimensions underlying positive and negative affect.
Jourruil of Personality and Social Psychology, 48, 1253-1265.
Dinning, W. D., & Evans, R. G. (1977). Discriminant and convergent validity of the SCL-90 in psychiatric inpatients. Journal of
Personal-ity Assessment, 41, 304-310.
Epstein, S. (1979). The stability of behavior: I. On predicting most of the people much of the time. Journal of Personality and Social
Psy-chology, 37, 1097-1126.
Gotlib, I. H. (1984). Depression and general psyche-pathology in univer-sity students. Journal of Abnormal Psychology, 93, 19-30.
Hall, C. A. (1977). Differential relationships of pleasure and distress
with depression and anxiety over a past, present, and future time framework. Unpublished doctoral dissertation, University of
Minne-sota, Minneapolis.
Hammen, C. L. (1980). Depression in college students: Beyond the Beck Depression Inventory. Journal of Consulting and Clinical
Psy-chology,48, 126-128.
Harding, S. D. (1982). Psychological well-being in Great Britain: An evaluation of the Bradburn Affect Balance Scale. Personality and
In-dividual Differences, 3, 167-175.
Hedges, S. M., Jandorf, L., & Stone, A. A. (1985). Meaning of daily mood assessments. Journal of Personality and Social Psychology, 48, 428-434.
Kammann, R., Christie, D., Irwin, R., & Dixon, G. (1979). Properties of an inventory to measure happiness (and psychological health). New
Zealand Psychologist, 8, 1-9.
Kanner, A. D., Coyne, J. C., Schaefer, C, & Lazarus, R. S. (1981). Com-parison of two modes of stress measurement: Daily hassles and uplifts versus major life events. Journal of Behavioral Medicine, 4, 1-39. Leeka, J. (1987). Patterns of diurnal variation in mood in depressed and
nondepressed college students. Unpublished master's thesis, Southern
Methodist University, Dallas, TX.
McAdams, D. P., & Constantian, C. A. (1983). Intimacy and affiliation motives in daily living: An experience sampling analysis. Journal of
Personality and Social Psychology, 45, 851-861.
Moriwaki, S. Y. (1974). The Affect Balance Scale: A validity study with aged samples. Journal of Gerontology, 29, 73-78.
Rickels, K., Lipman, R. S., Garcia, C. R., &Fisher, E. (1972). Evaluat-ing clinical improvement in anxious outpatients. American Journal
of Psychiatry, 128, 119-123.
Russell, J. A. (1980). A circumplex model of affect. Journal of
Personal-ity and Social Psychology, 39, 1161-1178.
Russell, J. A. (1983). Pancultural aspects of the human conceptual orga-nization of emotions. Journal of Personality and Social Psychology,
45, 1281-1288.
Spielberger, C. D., Gorsuch, R. L., & Lushene, R. E. (1970). Manual
for the State-Trait Anxiety Inventory. Palo Alto, CA: Consulting
Psy-chologists Press.
Stone, A. A. (1981). The association between perceptions of daily expe-riences and self- and spouse-rated mood. Journal of Research in
Per-sonality, ;.5, 510-522.
Stone, A. A. (1987). Event content in a daily survey is differentially associated with concurrent mood. Journal of Personality and Social
Psychology. 52, 56-58.
Stone, A. A., Hedges, S. M., Neale, J. M., & Satin, M. S. (1985). Pro-spective and cross-sectional mood reports offer no evidence of a
"Blue Monday" phenomenon. Journal of Personality and Social Psy-chology, 49, 129-134.
Tellegen, A. (1985). Structures of mood and personality and their rele-vance to assessing anxiety, with an emphasis on self-report. In A. H. Tuma & J. D. Maser (Eds.), Anxiety and the anxiety disorders (pp. 681-706). Hillsdale, NJ: Erlbaum.
Tessler, R., & Mechanic, D. (1978). Psychological distress and perceived health status. Journal of Health and Social Behavior, 19.254-262. Warr, P. (1978). A study of psychological well-being. British Journal of
Psychology, 69, 111-121.
Warr, P., Barter, J., & Brownbridge, G. (1983). On the independence of positive and negative affect. Journal of Personality and Social Psy-chology, 44, 644-651.
Watson, D. (in press). The vicissitudes of mood measurement: Effects of varying descriptors, time frames, and response formats on mea-sures of Positive and Negative Affect. Journal of Personality and So-cial Psychology.
Watson, D. (1988). Intraindividual and interindividual analyses of Posi-tive and NegaPosi-tive Affect: Their relation to health complaints, per-ceived stress, and daily activities. Journal of Personality and Social Psychology, 54, 1020-1030.
Watson, D., &Clark, L. A. (1984). Negative Affectivity: The disposition to experience aversive emotional states. Psychological Bulletin, 96, 465-490.
Watson, D., Clark, L. A., & Carey, G. (in press). Positive and Negative Affectivity and their relation to anxiety and depressive disorders. Journal of Abnormal Psychology.
Watson, D., Clark, L. A., & Tellegen, A. (1984). Cross-cultural conver-gence in the structure of mood: A Japanese replication and a compar-ison with U.S. findings. Journal of Personality and Social Psychology, 47. 127-144.
Watson, D., & Pennebaker, J. W. (in press). Health complaints, stress, and distress: Exploring the central role of negative affectivity. Psycho-logical Review.
Watson, D., & Tellegen, A. (1985) Toward a consensual structure of mood. Psychological Bulletin, 98, 219-235.
Wills, T. A. (1986). Stress and coping in early adolescence: Relationships to substance use in urban school samples. Health Psychology, 5, 503-529.
Zevon, M. A., & Tellegen, A. (1982). The structure of mood change: An idiographic/nomothetic analysis. Journal of Personality and Social Psychology, 43. 111-122.
Appendix
The PANAS
This scale consists of a number of words that describe different feelings and emotions. Read each item and then mark the appropriate answer in the space next to that word. Indicate to what extent [INSERT APPROPRIATE TIME INSTRUCTIONS HERE]. Use the following scale to record your answers.
very slightly or not at all
2
a little moderately
4
quite a bit extremely
_ interested _ distressed _ excited .upset . strong -guilty _ scared _ hostile _ enthusiastic _ proud
We have used PANAS with the following time instructions:
Moment (you feel this way right now, that is, at the present moment) Today (you have felt this way today)
Past few days (you have felt this way during the past few days) Week (you have felt this way during the past week) Past few weeks (you have felt this way during the past few weeks) Year General _ irritable _ alert _ ashamed _ inspired _ nervous _ determined _ attentive -jittery _ active _ afraid
(you have felt this way during the past year)
(you generally feel this way, that is, how you feel on the average)
Received May 10, 1987 Revision received September 14, 1987 Accepted November 11, 1987