MASTERARBEIT
Titel der Masterarbeit
„The relationship between performance,
CEO compensation and corporate governance“
Verfasser
Manuel Gunacker, Bakk. rer. soc. oec.
angestrebter akademischer Grad
Master of Science (MSc)
Wien, 2012
Studienkennzahl lt. Studienblatt: A 066 915
Studienrichtung lt. Studienblatt: Masterstudium Betriebswirtschaft Betreuerin / Betreuer: Univ.-Prof. Dr. Gyöngyi Lóranth
II
Table of contents
Figures ... VI Tables ... VI Abbreviations ... VII 1 Introduction ... 1 2 Literature review ... 22.1 Defining the model ... 2
2.1.1 The ideal solution ... 3
2.1.2 Optimal solution ... 5
2.2 Mechanisms to reduce agency cost ... 8
2.2.1 Non-financial alignment mechanisms ... 8
2.2.1.1 Monitoring / Bonding ... 9
2.2.1.2 Threat of dismissal ... 12
2.2.2 Financial alignment mechanisms ... 13
2.2.2.1 Managerial equity ownership ... 15
2.2.2.2 Incentive contracts ... 21
2.2.3 Influential players ... 30
2.2.3.1 Board of directors ... 30
2.2.3.2 Institutional investors ... 35
3 Methodology ... 39
3.1 Why to focus solely on the CEO... 39
3.2 Performance measures ... 40
3.2.1 Stock return ... 40
3.2.2 ROA ... 40
III 3.2.4 Timing ... 42 3.2.5 Relative performance ... 42 3.3 Compensation variables ... 43 3.4 Control variables ... 44 3.4.1 Managerial ownership ... 44
3.4.2 Number of directors in the board ... 45
3.4.3 Board independence ... 46
3.4.4 Concentration of institutional shareholdings ... 46
3.4.5 Size ... 47
3.4.6 Industry ... 48
3.4.7 E-Index ... 48
3.4.8 CEO age ... 49
3.4.9 Interlock ... 50
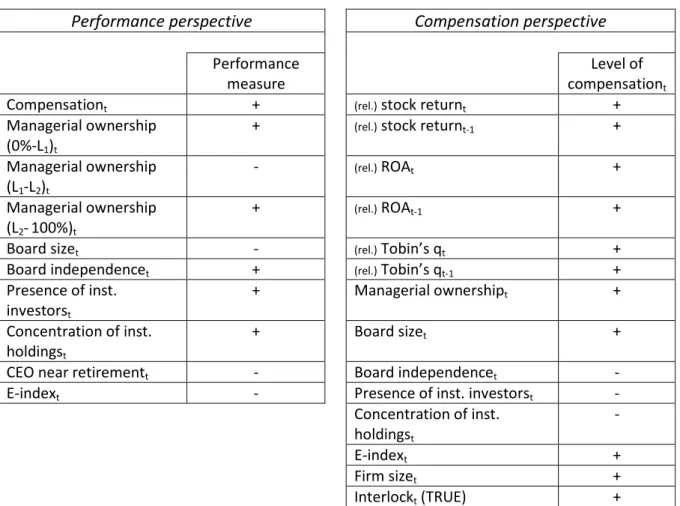
3.5 Regression Functions and Expected Correlations ... 51
3.5.1 Performance perspective ... 51 3.5.2 Compensation perspective ... 51 3.5.3 Expected Correlations ... 52 4 Data ... 52 4.1 Sample description ... 52 4.2 Descriptive statistics ... 53 4.2.1 Descriptive statistics, 1993-2009 ... 54 4.2.2 Descriptive statistics, 1993-2005 ... 56 4.2.3 Descriptive statistics, 2006-2009 ... 58 4.3 Correlation coefficients ... 60 5 Regression results ... 64 5.1 1993 - 2009 ... 65
IV 5.1.1 Performance perspective ... 65 5.1.2 Compensation perspective ... 67 5.2 1993-2005 ... 69 5.2.1 Performance perspective ... 69 5.2.2 Compensation perspective ... 72 5.3 2006-2009 ... 74 5.3.1 Performance perspective ... 74 5.3.2 Compensation perspective ... 76
5.4 Analyzing the components of compensation ... 78
5.4.1 Exclude salary from TDC ... 78
5.4.1.1 1993-2005 ... 79
5.4.1.2 2006 - 2009 ... 83
5.4.2 Excluding bonus from TDC ... 86
5.4.2.1 1993 - 2005 ... 86
5.4.2.2 2006 - 2009 ... 91
5.4.3 Excluding options from TDC ... 94
5.4.3.1 1993 - 2005 ... 95
5.4.3.2 2006 - 2009 ... 100
6 Conclusion ... 104
7 Limitations & Extensions ... 109
7.1 Board characteristics ... 109
7.2 Market for corporate control ... 110
7.3 The role of debt ... 111
7.4 Miscellaneous extensions ... 112
7.5 Final note ... 113
V 9 Appendix - unreported tables ... 118 Abstract ... 146 Curriculum Vitae ... 148
VI
Figures
Figure 1: The ideal solution (without outside funding) ... 4
Figure 2: The optimal solution (with outside funding) ... 6
Figure 3: The optimal solution with monitoring / bonding ... 10
Figure 4: The relationship between performance and managerial ownership ... 19
Figure 5: Composition of the average CEO compensation in different countries ... 22
Figure 6: Composition of the average CEO compensation in Europe and the U.S. ... 23
Tables
Table 1: Regional differences in average CEO compensation ... 22Table 2 & 3: Expected empirical relationships ... 52
Table 4: Number of observations per year ... 53
Table 5: Descriptive statistics of the whole sample ... 54
Table 6: Descriptive statistics of the 1993 - 2005 subsample ... 56
Table 7: Descriptive statistics of the 2006 - 2009 subsample ... 58
Table 8: Pairwise correlations ... 61
Table 9: Regression results: Performance perspective 1993 - 2009 ... 65
Table 10: Regression results: Compensation perspective 1993 - 2009 ... 67
Table 11: Regression results: Performance perspective 1993 - 2005 ... 70
Table 12: Regression results: Compensation perspective 1993 - 2005 ... 72
Table 13: Regression results: Performance perspective 2006 - 2009 ... 74
Table 14: Regression results: Compensation perspective 2006 - 2009 ... 76
Table 15: Regression results: Performance perspective 1993 - 2005, salary excluded ... 79
Table 16: Regression results: Compensation perspective 1993 - 2005, salary excluded ... 81
Table 17: Regression results: Performance perspective 2006 - 2009, salary excluded ... 83
Table 18: Regression results: Compensation perspective 2006 - 2009, salary excluded ... 84
Table 19: Regression results: Performance perspective 1993 - 2005, bonus excluded ... 86
Table 20: Regression results: Compensation perspective 1993 - 2005, bonus excluded ... 89
Table 21: Regression results: Performance perspective 2006 - 2009, bonus excluded ... 91
Table 22: Regression results: Compensation perspective 2006 - 2009, bonus excluded ... 93
Table 23: Regression results: Performance perspective 1993 - 2005, options excluded ... 95
Table 24: Regression results: Compensation perspective 1993 - 2005, options excluded ... 97
Table 25: Regression results: Performance perspective 2006 - 2009, options excluded ... 100
Table 26: Regression results: Compensation perspective 2006 - 2009, options excluded ... 102
Table 27 & 28: Comparison of expected and actually observed empirical relationships ... 106
Table 29: Regression results: Performance perspective 1993 - 2009, alt. specification ... 118
Table 30: Regression results: Compensation perspective 1993 - 2009, alt. specification ... 119
Table 31: Regression results: Performance perspective 1993 - 2005, alt. specification ... 120
Table 32: Regression results: Compensation perspective 1993 - 2005, alt. specification ... 122
Table 33: Regression results: Performance perspective 2006 - 2009, alt. specification ... 123
Table 34: Regression results: Compensation perspective 2006 - 2009, alt. specification ... 124
Table 35: Regression results: Performance perspective 1993 - 2005, salary excluded, alt. specification ... 125
Table 36: Regression results: Compensation perspective 1993 - 2005, salary excluded, alt. specification ... 127
VII Table 37: Regression results: Performance perspective 2006 - 2009,
salary excluded, alt. specification ... 128
Table 38: Regression results: Compensation perspective 2006 - 2009, salary excluded, alt. specification ... 129
Table 39: Regression results: Performance perspective 1993 - 2005, bonus excluded, alt. specification ... 130
Table 40: Regression results: Compensation perspective 1993 - 2005, bonus excluded, alt. specification ... 132
Table 41: Regression results: Performance perspective 2006 - 2009, bonus excluded, alt. specification ... 133
Table 42: Regression results: Compensation perspective 2006 - 2009, bonus excluded, alt. specification ... 134
Table 43: Regression results: Performance perspective 1993 - 2005, options excluded, alt. specification ... 135
Table 44: Regression results: Compensation perspective 1993 - 2005, options excluded, alt. specification ... 137
Table 45: Regression results: Performance perspective 2006 - 2009, options excluded, alt. specification ... 138
Table 46: Regression results: Compensation perspective 2006 - 2009, options excluded, alt. specification ... 139
Table 47: Regression results: Performance perspective 1993 - 2005, options only ... 140
Table 48: Regression results: Compensation perspective 1993 - 2005, options only ... 142
Table 49: Regression results: Performance perspective 2006 - 2009, options only ... 143
Table 50: Regression results: Compensation perspective 2006 - 2009, options only ... 144
Abbreviations
alt. ... alternative
ASE ... American Stock Exchange BLK ... Black Scholes
BV ... Book Value
CalPERS ... California Public Employee's Retirement System CEO ... Chief Executive Officer
inst. ... institutional
IRRC ... Investor Responsibility Research Center MV ... Market Value
no. ... number
NPV ...Net Present Value
NYSE ... New York Stock Exchange q ... Tobin's q
rE ... return on equity (dividends reinvested)
rel ... relative
R&D ... Research and Development
SEC ... Securities and Exchange Commision SIC ... Standard Industry Classification TDC ... Total Direct Compensation
VIII UK ... United Kingdom
U.S. ... United States
1
1
Introduction
In recent years, in the light of the various crises, compensation of corporate top management received considerably more interest than usual. Not only the politics, the public and the media questioned the appropriateness of existing compensation arrangements, but also the shareholders of the firms. Oftentimes, the perception of nowadays compensation schemes is that CEOs are rewarded arbitrarily and that their pay is not connected to their performance. Searching for the existence of this link is one of the two goals of this work. To get a more detailed insight of the relationship, this paper also analyses the effectiveness of certain components of compensation.
The second aim is to validate which instruments of corporate governance are effective in aligning the interests of the CEO with those of the firm's shareholders. Since compensation is supposed to be one of these instruments, the second goal of my thesis is closely related to the first one. In financial literature the possibly deviating interests between the CEO and the shareholders is known as the principal agent conflict, or the problem of the separation of ownership and control. In theory, and oftentimes in reality too, managers possibly have different preferences than shareholders. In particular, they are prone to engage in self-serving activities such as inefficient spending, empire building, extraction of perks etc., whereas the primary desire of the shareholders is that the value of their stake gets maximized. In order to prevent managers from departing too far from maximizing the value to shareholders, incentive and monitoring systems have been implemented.
The fact that there are still numerous papers published that address the problems arising from the separation of ownership and control, illustrates that there is still no consensus about what instruments good corporate governance should involve and which play a less important role or could be omitted altogether. My thesis contributes to the literature in that it provides the reader with a broad overview of the different mechanisms developed to align shareholders’ and CEO’s interests, together with empirical evidence which of those are indeed positively related to firm performance. Due to its recent popularity my thesis focuses especially on the effectiveness of CEO compensation, both in total and of certain components.
2 The majority of the analysis is conducted in two subsamples (1993-2005 and 2006-2009), since the SEC changed the disclosure requirements concerning compensation in 2005, making an analysis over the whole range of years less representative. The estimates resulting from the analysis are not designed to make any claims concerning causality, however. Rather, evaluating the cause of the relationships is left to future research.
The remainder of this paper is organized as follows: Next, section 2 familiarizes the reader with the theoretical background and what prior empirical evidence suggested. Afterwards, sections 3 and 4 describe the used methodology, expected relationships, and provide a detailed description of the data. Section 5 presents the results of the empirical analysis, followed by the conclusion in section 6. In the end, section 7 gives some final remarks and outlines possible extensions for future research. The appendix provides the regression results of a selective set of alternative specifications.
2
Literature review
Ever since there were people manipulating goods and assets owned by another, the separation of ownership and control caused problems to those affected. Theoretically, there is no difference between a farmer cultivating the land owned by a nobleman in the medieval era, or a manager running a multi-million dollar company with a vast number of shareholders. Both relationships can be seen as principal-agent relationships with similar inherent problems. As soon as the individual in charge of control does not have to bear the whole cost of his actions (because his actions are not perfectly observable), an agency problem arises. Since those problems are omnipresent, there is extensive literature addressing this issue. One of the most influential papers addressing the problems arising from the so called principal-agent relationship is by Jensen and Meckling in 19761. In this section I will start by reviewing this basic paper. Afterwards, I will illustrate what has happened in related research so far by focusing on a set of selective papers.
2.1
Defining the model
An agency relationship is defined as “…a contract under which one or more persons (the principal(s)) engage another person (the agent) to perform some service on their behalf
1
3 which involves delegating some decision making authority to the agent”2. The major problem within this relationship is the decision making authority. In theory (and often also in reality) individuals are value maximizers. That is, every individual strives towards maximizing his personal utility in terms of pecuniary as well as non-pecuniary wealth.
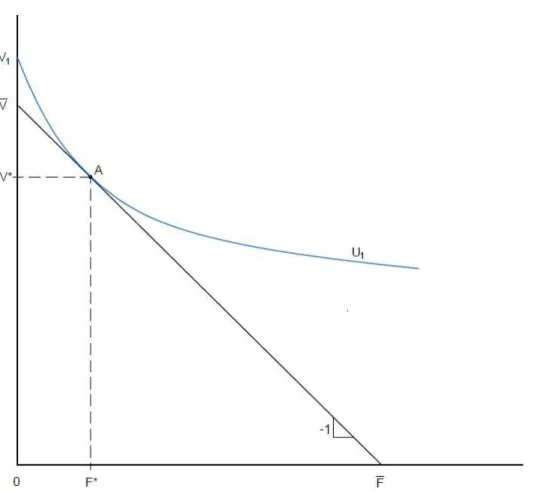
2.1.1 The ideal solution
If an individual has to bear the whole cost of his consumption of non-pecuniary income (e.g. is the owner-manager of a firm), he3 will choose to extract an amount of non-pecuniary wealth such that his personal utility is maximized. The graph below depicts this equilibrium in the case of an owner-manager4:
2
cf. Jensen, Meckling, 1976, “Theory of the firm: Managerial Behavior, Agency costs and ownership structure”, p. 308
3
I am referring to the CEO and managers as to be male just as a matter of convenience and not because I want to make any references about gender roles in the corporate environment. Henceforth, the terms "he" and "she" are used interchangeably.
4
Although agency problems can be found in many different interpersonal relationships (communities, universities, sports teams, etc.), this paper focuses solely on the relationship between a firm's equity-shareholders and its management
4 In this graph denotes the value of the firm if the manager chooses not to consume any perquisites, and denotes the highest possible level of perquisite5 consumption (at this point the firm's only purpose would be to generate non-pecuniary wealth for its owner). Therefore the line represents the locus of all possible combinations. Its slope is equal to -1 since the cost of every dollar increase in non-pecuniary benefits reduces the firm value by the equivalent dollar, which is “…analogous to a budget constraint”6.
5
The extraction of non-pecuniary wealth is not limited to the consumption of perquisites; it also involves activities such as shirking, inefficient spending or other “non-value-maximizing objectives such as sales growth, empire building, and employee welfare” (cf. Morck, Shleifer, Vishny, 1988, “Management ownership and market valuation”, p. 293); for the sake of readability I am referring to perquisites as synonym for the extraction of non-pecuniary wealth in every possible form
6
cf. Jensen, Meckling, 1976, “Theory of the firm: Managerial Behavior, Agency costs and ownership structure”, p. 315
Figure 1 “The ideal solution (without outside funding)”
Derived from Jensen, Meckling, 1976, “Theory of the firm: Managerial Behavior, Agency cost and ownership structure”
V … denotes firm value
F … denotes the value of non-pecuniary wealth the agent will extract U … indifference curves
A … the “ideal” solution: the equilibrium in which V and F are balanced such that it gives the owner-manager the highest feasible utility
5 At the point , a manager, eager to maximize his personal welfare, values an incremental increase in perquisites higher than an incremental loss in firm value, and therefore will move down the line towards point A, where the (personal) marginal cost in firm value is equal to the (personal) marginal benefit of perquisites. Therefore, point A resembles the ideal solution if the firm is owned by a single owner-manager. It should be recognized, that the slope of his utility function (U1) at this point is equal to the slope of (i.e. -1).
Summing that up, in the ideal solution firm value is equal to V* and the level of fringe benefits is equal to F*.
2.1.2 Optimal solution
In case the owner-manager wants to sell some fraction (1-α) of his ownership and remain as manager, a naïve buyer may be willing to pay (1-α)V*, the value of the acquired fraction of the current firm value V*. However, if his actions are not perfectly observable, the manager will not have to bear the whole $ cost of consuming perquisites anymore, but rather a dollar value equal to his fraction of ownership (α). Therefore, the slope of his budget constraint changes to –α (as depicted in fig. 2 – see below). This line has to pass point A, “… since he [the manager] can if he wishes have the same wealth and level of non-pecuniary consumption he consumed as full owner”7. Again he will maximize his personal wealth, ending up at point B (where the highest feasible utility function is tangent to his budget constraint), consuming non-pecuniary benefits of F0. The total costs of his consumption, however, remains unchanged, bringing firm value down to V0. This decrease in firm value affects the wealth of all owners depending on the fraction they are holding. Hence, in the new equilibrium the new owner would incur a fraction of the costs of consumption equal to (1-α)F0, and the rest would have to be borne by the manager.
7
cf. Jensen, Meckling, 1976, “Theory of the firm: Managerial Behavior, Agency costs and ownership structure”, p. 317
6 Most investors are not that naïve however, so they will only be willing to pay an amount that is equal to the expected value of the firm, given the higher level of perquisites consumed by the manager. Through anticipating the agent’s behavior, investors force the manager towards a new equilibrium of pecuniary and non-pecuniary wealth which is at point C. At this point the managers utility function is again tangent to his budget constraint, at a point where it intersects the firm’s budget constraint. That the transaction has to occur at exactly this point can easily be explained. Consider the case that the tangency occurs left to C, where the owner-manager will receive payments that are lower than the claim is actually worth. On the opposite, if the tangency occurs at a point to the right of C, the
owner-Figure 2 “The optimal solution (with outside funding)”
From Jensen, Meckling, 1976, “Theory of the firm: Managerial Behavior, Agency cost and ownership structure”, p.316
V … denotes firm value
F … denotes the value of non-pecuniary wealth the agent will extract U … indifference curves
α ... the fractional ownership the agent retains after resorting to outside funds A … the “ideal” solution
B … equilibrium with naïve investors
7 manager will receive inappropriate high payments, leaving the new owners worse off. Since both participants in this transaction are assumed to be rational wealth maximizers, a transaction can only take place at point C.
In this new equilibrium firm value is equal to V’ and the manager’s consumption of non-pecuniary wealth is F’. If there is no monitoring and/or bonding allowed (see further down), the whole decrease in firm value V* - V’ (and therefore in wealth) has to be borne solely by the manager8. Firm value is decreasing by the same magnitude as the extraction of non-pecuniary wealth is increasing. The manager’s welfare however (non-pecuniary + non-non-pecuniary wealth) is not decreasing by an amount equal to V* - V’. Rather it is decreasing by the distance between the intersects of the vertical axis and the utility functions U1 and U3, which
is equal to V1 – V3. The magnitude of V1 – V3 is smaller than V* - V’, since part of the firm
value decrease the manager incurs is compensated by the higher level of perquisite consumption (it is important to realize that this increase cannot compensate the manager thoroughly, since at this point he would value pecuniary wealth more than non-pecuniary wealth). In the absence of monitoring and bonding activities, Jensen and Meckling define the manager’s total wealth reduction (V1 – V3) as “net agency cost”9. Obviously a manager
“…would sell such a claim only if the increment in welfare he achieves by using the cash amounting to (1-α)V’ for other things was worth more to him than this amount of wealth [V1
– V3]”10.
Due to the selling of equity to investors, the manager is forced to increase his consumption of perquisites, since, if he chooses not to do so, he will get less for the claim than it is actually worth. The lower the fraction (α) the manager retains, the flatter gets the slope of his budget constraint, and, since investors will anticipate the behavior of appropriating “… larger amounts of the corporate resources in the form of perquisites”11, the more expensive it will be to him to sell shares (in terms of incurred agency cost). Following this logic, the manager will keep on selling equity to investors as long as his increase in personal welfare
8
for the proof cf. Jensen, Meckling, 1976, “Theory of the firm: Managerial Behavior, Agency costs and ownership structure”, p. 318,319
9
cf. Jensen, Meckling, 1976, “Theory of the firm: Managerial Behavior, Agency costs and ownership structure”, p. 319
10
cf. Jensen, Meckling, 1976, “Theory of the firm: Managerial Behavior, Agency costs and ownership structure”, p. 319
11
cf. Jensen, Meckling, 1976, “Theory of the firm: Managerial Behavior, Agency costs and ownership structure”, p. 313
8 (no matter if measured in perquisites or in other benefits he can obtain by using the payments received by investors) will outweigh the incurred (agency) cost. Moreover, in this model, agency cost can be seen as a measure of deviation of interest between principal and agent. As a result, a lower fraction α can be interpreted as a lower likelihood that the manager will act in shareholder’s best interest. Following this model, the obvious conclusion that could be drawn is, that the higher a manager's ownership in a firm, the more likely he will act in shareholders' best interest12. Some empirical studies, however, do not support this notion without reproach13 which is why other theories about management ownership have been developed (e.g. entrenchment theory14 - see further down).
2.2
Mechanisms to reduce agency cost
Obviously, as far as I presented it, the model by Jensen and Meckling would not be applicable to reality. If owner-managers sell equity only as long as their incremental increase in personal wealth outweighs the agency cost they incur, we would not see multi-million dollar corporations, traded publicly, with management holding only a tiny fraction of the shares. To ensure that shareholders' invested capital is not exposed to the free disposition of the management, control instruments have been implemented.
Literature suggests a wide variety of instruments designed to minimize agency cost and boost performance. Although those instruments are heavily interrelated, they can roughly be divided in two categories, financial and non-financial alignment mechanisms. I will start by reviewing the latter one.
2.2.1 Non-financial alignment mechanisms
Non-financial mechanisms to reduce agency cost are designed to decrease the divergence of interests without actively tying a manager's pecuniary wealth to shareholders' wealth. In this paper, I want to focus on the most prominent of those measures, monitoring / bonding and the threat of dismissal, the first of which Jensen and Meckling explicitly analyzed in their paper.
12
cf. Jensen, Murphy, 1990, “CEO incentives – It’s not how much you pay, but how”
13
cf. e.g. Morck, Shleifer, Vishny, 1988, “Management ownership and Market Valuation”; Janakirman, Radhakrishnan, Tsang, 2010, “Institutional Investors, Managerial Ownership, and Executive Compensation”
14
cf. e.g. Morck, Shleifer, Vishny, 1988, “Management ownership and Market Valuation”; Janakirman, Radhakrishnan, Tsang, 2010, “Institutional Investors, Managerial Ownership, and Executive Compensation”
9
2.2.1.1 Monitoring / Bonding
If a manager wants to raise funds but has no desire to increase his consumption of non-pecuniary wealth to corresponding levels, he could issue “guarantees” not to consume such high levels in order to encourage investors to pay a higher amount for their share. This activity is called “bonding”. If the principal is interested in curbing the manager’s perquisites consumption he will engage in “monitoring”. In doing so, the principal will closely observe the agent's actions, and threaten him with certain consequences if he is seriously departing from the behavior the principal is hoping for.
No matter which of those two mechanisms is prevalent (a mixture would also be possible), the costs, as well as the benefits, of aligning interests will be incurred by the former owner-manager15. As a value maximizing individual, a manager will sign such a contract only as long as the benefits outweigh the costs. Using the model presented above, this relationship can be depicted as follows.
15
cf. Jensen, Meckling, 1976, “Theory of the firm: Managerial Behavior, Agency costs and ownership structure”, p. 324, 325
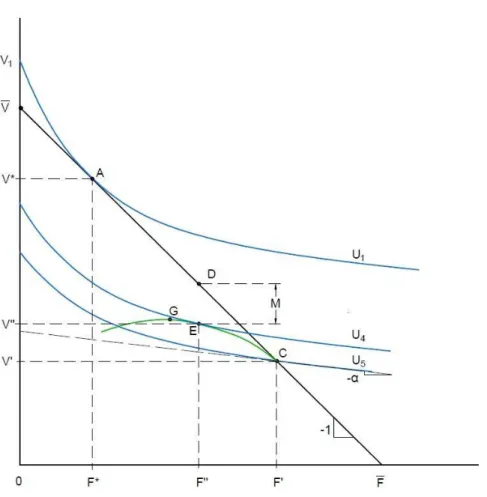
10 Other than in section 2.1.2 above, monitoring is possible now. Let us assume that investors, through anticipating his behavior, forced a manager to point C, yielding a firm value equal to V' and a perquisite consumption level of F'. Assume furthermore, that monitoring does reduce perquisite consumption F, and that the monitoring costs (M) are increasing with the magnitude of the desired reduction.
If it would be possible to force the manager to a certain level of F at zero cost, investors would force him towards point A (the ideal solution where the agency cost is equal to zero). A level of perquisite consumption lower than F* however, would not be possible since the
Figure 3 “The optimal solution with monitoring / bonding”
From Jensen, Meckling, 1976, “Theory of the firm: Managerial Behavior, Agency cost and ownership structure”, p.324
V … firm value
F … value of non-pecuniary wealth the agent will extract U … indifference curves
α ... the fractional ownership the agent retains after resorting to outside funds A … the “ideal” solution
C … the “optimal” solution if investors anticipate the agent’s change in behavior E … optimal solution to the agent
G … optimal solution to the principal (not feasible since agent is worse off) M … monitoring cost = D-E
11 manager would not sign such a contract (his personal welfare would decrease if he moves up the line beyond point A).
In fact, monitoring is seldom available at zero cost, and therefore if monitoring forces the manager to extract a lower level of non-pecuniary wealth, the value of the firm would not increase by the same magnitude as F decreases. Rather, the firm would move along the green expansion path shown in Figure 3. Since monitoring costs are increasing at higher levels, the expansion path is a concave function, reaching its maximum at point G. A rational manager however, striving to maximize his personal welfare, will not commit himself to a contract which does not give him the highest feasible utility. From the manager's perspective, the optimal solution is denoted by point E (the point where the expansion path is tangent to the highest indifference curve - in this case U4
)
. At this point, firm value equalsV'' and perquisite consumption is at F''. The monitoring cost at point E is given by M=D-E. It is important to realize that point D does not denote the ideal solution, but rather an optimal one. As mentioned above, if M=0 for all levels of F, the ideal solution would be at point A. The monitoring model presented in Figure 3 is also valid for bonding activities since "[...] it makes no difference who actually makes the monitoring expenditures - the owner bears the full amount of costs [...]"16 and gets all the benefits. Monitoring / bonding costs will be different for every company, depending on the individual value a manager assigns to the perquisites available, the composition of the board (cf. section 2.2.3.1), manager’s entrenchment (cf. section 2.2.2.1), how incentive contracts are shaped (cf. section 2.2.2.2), how observable manager’s actions are, etc.. Which form is dominant in a firm depends on who can limit the perquisite consumption at a lower cost. Is the manager able to issue a compelling contract to limit his extraction of F, bonding will be the prevalent activity. If the manager is not able to do so (or only at a higher cost), investors will engage in monitoring.
Links to other sections
In case investors want to engage in monitoring, they often delegate this task to the board of directors (at least investors with only a small stake oftentimes have to rely on the board, since they do not have the incentive and the means to conduct this task themselves). The
16
cf. Jensen, Meckling, 1976, “Theory of the firm: Managerial Behavior, Agency costs and ownership structure”, p.325
12 question at hand is how the board should be composed. How many directors should be on the board? How many outside directors should be included? Different implications of those questions are presented in section 2.2.3.1. A group that is considered highly capable of monitoring management are large (institutional) investors, presented in section 2.2.3.2 . Furthermore, monitoring is closely related to the next section.
2.2.1.2 Threat of dismissal
Although I have no intention to test for this instrument separately (for example by examining the relationship between management turnover and performance, or by running an event analysis), I want to present its implications (in short) for the sake of completeness. This instrument, which is also designed to mitigate the agency problem, is obviously extremely closely related to monitoring (if not a consequence of it). If the agent's actions are monitored with high scrutiny and he does not act in the principal's interest (i.e. deliver poor performance), he is threatened with dismissal. Since a large portion of a managers’ wealth is typically tied to the firm he works for, especially in terms of his invested human capital (i.e. training, prospects on the job market, etc.), the threat of dismissal should constrain manager's behavior, lessen agency cost and is supposed to boost performance in turn. Although this argumentation is consistent with previous studies17, there is a considerable controversy about its virtue. Part of the research confirms that "[...] poor stock return increases the probability of a CEO's losing his job"18 and that "[...] boards react relatively quickly to poor performance in their decisions to replace the CEO"19. Other empirical findings, however, suggest that “[…] dismissals are not an important source of managerial incentives since the increases in dismissal probability due to poor performance and the penalties associated with dismissal are both small"20. Researchers supporting that notion attribute the lack of empirical evidence to the fact that “[…] employment contracts, severance agreements, or golden parachute arrangements [...] further reduce or eliminate
17
cf. e.g. Weisbach, 1988, "Outside Directors and CEO Turnover"; Bhagat, Bolton, 2008, "Corporate governance and firm performance"; Yermack, 1996, “Higher market valuation of companies with a small board of directors”
18
cf. Weisbach, 1988, "Outside Directors and CEO Turnover", p.440
19
cf. Weisbach, 1988, "Outside Directors and CEO Turnover", p.443
20
13 the pecuniary punishment for failure […]”21. Furthermore, they suggest that the board does not always act in shareholders’ best interest either since its members are oftentimes reluctant to lay off managers after periods of poor performance due to psychological and social factors such as collegiality22.
Links to other sections
Usually researchers tested for the threat of dismissal using CEO or management turnover as a proxy. Since the studies that did find a significant relationship revealed that the turnover probability is especially sensitive to the size of the board23, the number of outside directors on the board24 (cf. section 2.2.3.1 further down), and the concentration of institutional shareholders25 (cf. section 2.2.3.2 further down), I expect those numbers to incorporate the threat of dismissal, which is why I will not test for this mechanism by using a separate variable. Furthermore, in case the manager is entrenched (cf. section 2.2.2.1 below), the threat of dismissal becomes even less powerful, due to the lower probability of a lay off26.
2.2.2 Financial alignment mechanisms
Financial alignment mechanisms are designed to mitigate the agency problem by actively connecting the agent's and the principal's wealth. Although these measures can be split in two major groups (managerial equity ownership and incentive compensation plans), I want to continue with the overall effect first, since an interesting study form 201027 examined the aggregated effect. Later on, I'm going to present the two groups separately.
When agency theory came up in the 70s, the academic community was positive that they discovered a key driver to a further understanding of manager behavior. In these days, financial alignment seemed to be a powerful tool to reduce agency cost, forcing the manager
21
cf. Jensen, Murphy, 1990, “Performance Pay and Top-Management Incentives”, p242
22
cf. Bebchuck, Fried, 2006, “Pay without Performance: An overview of the issues”
23
cf. Yermack, 1996, “Higher market valuation of companies with a small board of directors”
24
cf. e.g. Weisbach, 1988, "Outside Directors and CEO Turnover"
25
cf. Hartzell, Starks, 2003, “Institutional Investors and Executive Compensation”
26
cf. Janakirman, Radhakrishnan, Tsang, 2010, “Institutional Investors, Managerial Ownership, and Executive Compensation”
27
cf. e.g. Nyberg, Fulmer, Gerhart, Carpenter, 2010, "Agency theory revisited: CEO Return and Shareholder interest alignment"
14 to act in shareholders' best interest. After years of empirical research however, "enthusiasm is clearly waning"28.
Even early studies found that the change in manager's wealth (measured in absolute dollar value) that is associated with a change in shareholder wealth is almost negligible small29. But contrary to recent studies, the general conclusion in these early days was not that financial alignment mechanisms have been implemented ineffectively, but rather that management should receive even more stock and option grants in order to increase their share, which was supposed to align interests30.
Recent researchers on the other hand, criticize that “[…] upon discovering practices that appear inconsistent with the cost-efficient provision of incentives, financial economists have often labored to come up with clever explanations for how such practices might be consistent with arm’s length contracting after all. Practices for which no explanation has been found have been considered ‘anomalies’ or ‘puzzles’ that will ultimately either be explained within the paradigm or disappear”31.
Although the tenor of recent papers is that financial alignment instruments do not work well the way they have been implemented, Nyberg, Fulmer, Gerhart and Carpenter32 argued that it is too early to dismiss the effectiveness of financial alignment altogether. They argue that preceding studies failed to measure CEOs' wealth change appropriately and that CEOs, since they typically have a large portion of their personal wealth invested in the firm, should be considered as shareholders rather than employees. This is why they introduced CEO return (the percentage change of the CEO's wealth within one year - analogous to stock return) as a proxy of financial alignment. By using this variable they found "[...] a positive, statistically significant, and economically meaningful relationship between CEO return and shareholder return [which] stands in sharp contrast to the conventional wisdom in the management
28
cf. Nyberg, Fulmer, Gerhart, Carpenter, 2010, "Agency theory revisited: CEO Return and Shareholder interest alignment", p.1029
29
cf. Jensen, Murphy, 1990, “Performance Pay and Top-Management Incentives” found that CEO's wealth changes by roughly $3 for every $1,000 change in shareholder wealth
30
cf. Jensen, Murphy, 1990, “CEO incentives – It’s not how much you pay, but how”
31
cf. Bebchuck, Fried, 2006, “Pay without Performance: An overview of the issues”, p. 8,9
32
cf. Nyberg, Fulmer, Gerhart, Carpenter, 2010, "Agency theory revisited: CEO Return and Shareholder interest alignment"
15 literature that such financial alignment either does not exist or is so small in magnitude as to be irrelevant"33.
Since the concept of CEO return involves his stake in the firm, one can expect the correlation to be higher in firms with high managerial (CEO) ownership (which happens in part mechanically through his ownership in the firm). Nevertheless it would be interesting to see if managerial ownership or the various components of incentive compensation have a larger impact when CEO return is used as compensation proxy. This is why I want to run two separate regressions. One in which managerial ownership is included in the computation of the CEO return, and one where managerial ownership is omitted altogether. This approach will illustrate the impact of ownership on the performance / CEO return relationship.
Alternatively, I will capture the degree of financial alignment by using conventional measures too, which are presented in the following.
Hypothesis
Hypothesis1A: CEO return is positively related to performance.
Hypothesis1B: High (low) performance coincides with high (low) CEO return
2.2.2.1 Managerial equity ownership
With their model, Jensen and Meckling implicitly stated that the most profitable firms should be those with high managerial ownership (convergence-of-interest hypothesis34). Theoretically, their arguments would suggest that an owner-manager invests almost his whole wealth in his company before he resorts to outside funds35. Empirically, this “[…] is not consistent with what we generally observe”36. A major reason why owner-managers do not wait to search for outside financing until they are running out of (cost-efficient) wealth could be diversification. Since agents tend to be risk averse they could be reluctant to put all
33
cf. Nyberg, Fulmer, Gerhart, Carpenter, 2010, "Agency theory revisited: CEO Return and Shareholder interest alignment", p. 1041
34
cf. Morck, Shleifer, Vishny, 1988, “Management ownership and market valuation”
35
As previously explained he will resort to outside funding only to the extent that the preceeds from the purchase outweigh the incurred agency cost.
36
cf. Jensen, Meckling, 1976, “Theory of the firm: Managerial Behavior, Agency costs and ownership structure”, p. 349
16 their eggs into one basket. As long as the additionally incurred agency cost (of accumulating more outside funding) is lower than the value of risk reduction, the agent will continue raising funds.
On the other side, if a manager is willing to keep a high stake in the firm, although this will leave him poorly diversified, and thereby reduce agency cost, the effect on shareholders will not necessarily be a positive one. In such a situation, the manager may want to decrease his risk via investing in less risky projects (which probably would be less profitable). The shareholders, able to hedge their risk via diversification on the market, would be better off if the firm's resources would be invested in the riskier, more profitable project. So there should be considerable shareholder interest that the manager is well diversified, as long as the incurred agency cost (to be borne by the manager) is lower than the difference between the risky and the less risky project.
That managerial ownership connects CEO’s wealth with shareholders' wealth and therefore in general provides incentives to act in shareholders' interest, is almost undoubted37. Some studies found that the incentive effect of managerial equity ownership is even higher than the effect of highly pay-for-performance sensitive compensation packages38, which are presented in the next section.
Following the agency theory, it does not come as a surprise that the incentive effect of managerial ownership is supposed to be more prevalent in small firms, because (i) the manager in such companies is often the founder and (ii) if not, he is more likely to have enough wealth to acquire a significant share of the firm and still remain sufficiently diversified (which is difficult for managers of multimillion dollar corporations39). It is worth noting that, although managers of large companies typically have a smaller share, they usually “[…] tend to have a larger dollar investment in their firms’ shares”40. However, since the model builds on the manager's personal cost of consuming perquisites, the agent's
37
From the reviewed literature concerning managerial ownership only the 2005 paper by Sundaramurthy, Rhoades, and Rechner, "A Meta-analysis of the effects of executive and institutional ownership on firm performance" did neither find a significant positive nor a significant negative relationship
38
cf. Jensen, Murphy, 1990, “Performance Pay and Top-Management Incentives”; Nyberg, Fulmer, Gerhart, Carpenter, 2010, "Agency theory revisited: CEO Return and Shareholder interest alignment"
39
cf. Jensen, Murphy, 1990, “CEO incentives – It’s not how much you pay, but how”
40
17 extraction of non-pecuniary wealth will be the lower, the higher his fractional ownership position in the firm (which is represented by the steeper slope of α).
Although this argumentation is supported by part of the literature41, there is considerable empirical evidence that is not consistent with the proposition that managerial ownership is a good thing per se.
Researchers rising demur against this view argue that, even given the case that the manager has enough wealth to finance his firm and still remain diversified, high managerial ownership cannot automatically be taken as an indicator of high performance. These authors42 are concerned that managers are likely to become “entrenched" with increasing ownership fraction. That is, if their stake is relatively high they could get powerful enough to exert considerable pressure on the board (cf. section 2.2.3.1), resist hostile takeovers43 (refers to the market of corporate control, which I do not intend to test for in my analysis), have a say on the shape of their own compensation plans (see section 2.2.2.2 further down), or seriously contradict instruments imposed by institutional shareholders (cf. section 2.2.3.2). In other words, "[...] large managerial ownership insulates from other forces that reduce agency costs [...]"44. Management's ability to exert pressure on the board or resist amendments desired by large shareholders could lead to poor performance, a low pay-for-performance sensitivity and high compensation levels.
One should recognize however, that the "negative" effect of managerial ownership on other control mechanisms could also be due to a lower demand for other instruments to align interests45. High stock ownership by the management could already reduce a large part of agency costs, making additional efforts obsolete.
41
cf. e.g. Jensen, Murphy, 1990, “Performance Pay and Top-Management Incentives”; Byrd, Parrino, Pritsch, 1998, "Stockholder-Manager Conflicts and Firm Value; Damodaran, John, Liu, 2005, "What motivates managers? Evidence from organizational form changes"
42
cf. e.g. Stulz, 1988, "Managerial Control of voting rights"; Morck, Shleifer, Vishny, 1988, “Management ownership and market valuation”; Janakiraman, Radhakrshnan, Tsang, 2010, “Institutional Investors, Managerial Ownership, and Executive Compensation”
43
cf. Stulz, 1988, "Managerial Control of voting rights"
44
cf. Hermalin, Weisbach, 1991, "The Effects of Board Composition and Direct Incentives on Firm Performance"
45
18 Moreover, it is worth noting that entrenchment not only arises through high managerial ownership (and therefore voting power46), also a manager’s characteristics such as “[…] tenure with the firm, status as a founder, or even personality […]”47 can lead to such a situation. Moreover, if the CEO also serves as chairman of the board, he can easily get entrenched48.
Concerning managerial ownership, the effects on performance predicted by the convergence-of-interest hypothesis and the entrenchment theory point in opposite directions. Under the convergence-of-interest hypothesis performance increases with manager’s stake and it decreases under entrenchment theory49. That is why some authors50 proclaim a somewhat N-shaped relationship.
46
Managers can increase their voting power not only through ownership in the firm. For a detailed overview of the ways managers could use to increase their voting power, see Stulz, 1988, "Managerial Control of voting rights".
47
cf. Morck, Shleifer, Vishny, 1988, “Management ownership and market valuation”, p. 294
48
cf. e.g. Chiang, Lin, 2011, "Examining Board Composition and Firm Performance"; Yermack, 1996, “Higher market valuation of companies with a small board of directors”
49
At this point I want note that some authors use the term "managerial power theory" instead of "entrenchment theory". There is no difference between those terms as long as one is aware of the fact that entrenchment can also arise through factors other than ownership.
50
cf. Morck, Shleifer, Vishny, 1988, “Management ownership and market valuation”; Janakirman, Radhakrishnan, Tsang, 2010, “Institutional Investors, Managerial Ownership, and Executive Compensation”
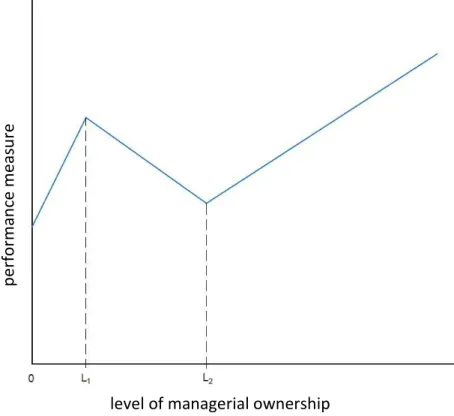
19 They argue that for increases at low levels of managerial ownership (from 0 to L1) the
convergence-of-interest effect does boost performance and that the entrenchment at this level is negligible51. At a medium level (L1 to L2)52 the manager's increased ownership
position already leads to substantial entrenchment.Although the interests of the principals and the agent are still converging, a manager at this level already has significant influence on many instruments designed to discipline him. This influence, which is caused by his entrenchment, outweighs the positive effect of increased ownership, resulting in a decrease of interest alignment. At high levels (> L2) the convergence-of-interest effect dominates
51
cf. Hermalin, Weisbach, 1991, "The Effects of Board Composition and Direct Incentives on Firm Performance"
52
Although researchers did find similar N-shaped relationships, the values for L1 and L2 differ with respect to
the managers in consideration: In their 1988 paper "Management ownership and market valuation", Morck, Shleifer, and Vishny considered the whole board of directors and fixed L1 at 5% and L2 at 25%. In contrast,
considering only top-five executives in their 2010 paper " Institutional Investors, Managerial Ownership, and Executive Compensation", Janakiraman, Radhakrshnan, and Tsang pinned the levels down at 1% and 5% respectively. p e rf o rm an ce m e as u re
level of managerial ownership Figure 4 “The relationship between performance and managerial ownership”
Derived from Morck, Shleifer, Vishny, 1988, “Management ownership and market valuation”, p. 301
Note: From 0 to L1 increasing ownership has a positive effect on performance. From L1 to L2, ownership
probably still has a positive effect on performance due to convergence-of-interest effect. This effect however, is outweighed by the entrenchment effect of increased ownership. For ownership portions > L2 an agent’s
influence due to entrenchment is not significantly higher than for levels just below L2. Therefore, the
convergence-of-interest effect (which operates over the whole range of ownership) results in a positive relationship between ownership and performance again.
20 again, since “[…] managements with even more […] ownership might not be significantly more entrenched […]”53.
Nowadays, many firms require their managers to hold a substantial share of the company. However, they oftentimes allow them to do so via holding options instead of shares54. Since options do not have the same risk distribution as a firm's stock (options don't have a downside risk) they do not induce the same alignment of interest. Hence, it is reasonable to use a managerial ownership variable that does not included unexercised options.
Links to other sections
The interrelation of this section with others can - for the most part - be attributed to the entrenchment effect. If a manager is entrenched he could potentially resist board decisions (cf. section 2.2.3.1 - especially with respect to the nomination of outside directors), or oppose corporate governance changes imposed by institutional shareholders (cf. section 2.2.3.2). Moreover, “[…] increased shareholdings of the CEO reduce the probability that he resigns […]”55. In other words, high managerial ownership reduces the effectiveness of the threat of dismissal.
With his influence on the board, an entrenched CEO could also have an impact on the implementation of new compensation plans, thereby potentially produce "[...] considerable distortions and costs to investors and the economy"56.
Furthermore, one should be aware of the fact that managerial ownership is often a product of compensation schemes with a heavy reliance on options. If the manager is performing well he will exercise his options, resulting in holding a larger portion of the firm57. If this portion is sufficiently large, the agent could get powerful enough to influence his own compensation.
53
cf. Morck, Shleifer, Vishny, 1988, “Management ownership and market valuation”, p. 302
54
cf. Lavelle, L., 2002, "How to halt the options express"
55
cf. Weisbach, 1988, “Outside directors and CEO Turnover”, p. 450
56
cf. Bebchuk, Fried, 2006, "Pay without Performance: An Overview of the issues", p. 5, 6
57
21
Hypothesis
Hypothesis2A: At low and high (intermediate) levels, managerial ownership has a positive
(negative) relationship to performance.
Hypothesis2B: With increasing managerial ownership, the level of compensation will rise and
the performance sensitivity will decline, either because there is a lower need or because the manager is powerful enough to resist an elaborate implementation. Concerning
compensation there is no piecewise linear relationship but only a linear one.
2.2.2.2 Incentive contracts
Another way to constrain a manager’s behavior (i.e. limiting his extraction of non-pecuniary wealth) is the use of highly pay-for-performance sensitive compensation contracts. Those contracts are designed to provide an incentive for the manager to deliver the best possible performance, via connecting his compensation to firm performance. Figure 3 presented in section 2.2.1.1 is also applicable to incentive contracts (e.g. as part of a bonding contract). The higher the pay-for-performance sensitivity, the higher is the cost M (because if their income is conditional on performance, managers want to get compensated for the excessive risk they are exposed to).
These contracts typically comprise of a mixture of base salary, bonus, option grants, stock grants, long term performance plans and additional perks, and are usually “[…] prepared by the remuneration committee in partnership with a human resource consulting firm”58. Moreover, deferred payments, pension plans, etc. play a role in providing incentives. Although the data I intend to analyze covers only firms traded on North American stock exchanges (such as the New York Stock Exchange [NYSE], the American Stock Exchange [ASE], the NASDAQ, etc.), it is noteworthy that the components of managerial pay are used differently in different cultures, economies etc.59, which is illustrated in the following.
58
cf. Dossi, Patelli, Zoni, 2010, “The Missing Link between Corporate Performance Measurement Systems and Chief Executive Officer Incentive Plans”, p. 551
59
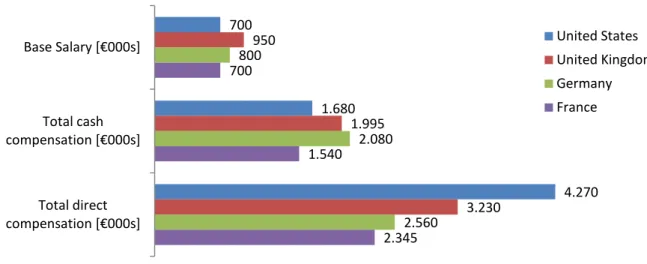
22 Although neither the table nor the figure explicitly includes stock options, stock grants and deferred compensation, it becomes evident that CEO compensation practices differ substantially with respect to the country. Despite the fact that they pay about the same average base salary, in terms of total direct compensation (TDC) continental Europe seems to pay less to their CEOs. As can be referred form the table, this difference can, for the most part, be attributed to a lower reliance on long term incentive plans. If the UK is also included in the European Segment, the difference becomes even more obvious.
TABLE 1
Regional differences in average CEO compensation
France Germany United Kingdom United States
Base Salary [€000s] 700 800 950 700 Annual Bonus as % of Base Salary 120% 160% 110% 140% Total cash compensation [€000s] 1.540 2.080 1.995 1.680 Long-Term Incentives as % of Base Salary 115% 60% 130% 370% Total direct compensation [€000s] 2.345 2.560 3.230 4.270
Source: HayGroup in Dossi, Patelli, Zoni, 2010, “The Missing Link between Corporate Performance Measurement Systems and Chief Executive Officer Incentive Plans”, p. 539
Note: The sample was composed of the largest US and European companies (€3-10 billion in total revenues)
700 1.680 4.270 950 1.995 3.230 800 2.080 2.560 700 1.540 2.345 Base Salary [€000s] Total cash compensation [€000s] Total direct compensation [€000s] United States United Kingdom Germany France
Figure 5 “Composition of the average CEO compensation in different countries”
From HayGroup in Dossi, Patelli, Zoni, 2010, “The Missing Link between Corporate Performance Measurement Systems and Chief Executive Officer Incentive Plans”, p. 539
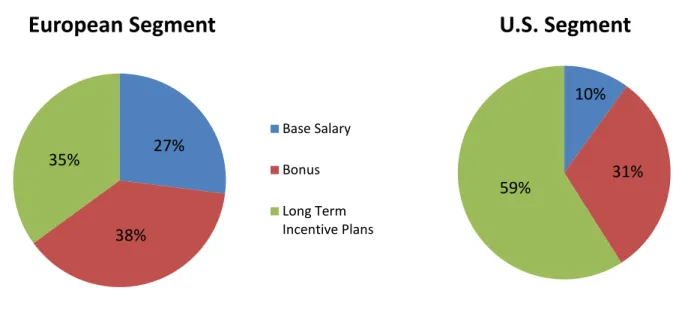
23 As mentioned above, this analysis does not explicitly display equity-based compensation, which is a crucial component of nowadays top management compensation, but as an illustration of the differences it serves its purpose. In the following, I want to present how equity-based compensation evolved over the last two decades.
Due to financial economists’, and henceforth politics’ and societies’, enthusiasm in the 1990s over the effectiveness of highly performance sensitive compensation schemes to align interests, one would expect an increased usage of those contracts in the last decades, especially with corporations boasting themselves of using highly sensitive executive compensation. And in fact, a study in 2005 showed that the equity-based compensation substantially increased between 1993 and 2003, even after controlling for industry, size and performance effects60. This increase can mostly be attributed to the excessive use of option grants in the 1990s, where firms exploited the advantage that options did not have to be included in the income statement as long as they have not been exercised, which is good for cash poor start-ups but was also used by long-established, solvent companies61.
Interestingly, executives’ cash compensation also increased according to this study, which shows that equity based compensation was not used as a substitute to cash. A potential
60
cf. Bebchuk, Grinstein, 2005, “The Growth of Executive Pay”
61
cf. Lavelle, 2002, "How to halt the options express" 27% 38% 35%
European Segment
Base Salary Bonus Long Term Incentive Plans 10% 31% 59%U.S. Segment
Figure 6 “Composition of the average CEO compensation in Europe and the U.S.”
From HayGroup in Dossi, Patelli, Zoni, 2010, “The Missing Link between Corporate Performance Measurement Systems and Chief Executive Officer Incentive Plans”, p. 539
24 explanation for this instance is that managers want to get compensated for the additional amount of personal welfare they put at risk in accepting highly equity based compensation.
Most studies addressing pay-for-performance sensitivity found that compensation in small firms tends to be far more sensitive to performance than in large firms62. Authors argue that pay-for-performance sensitivity tends to be lower in large firms due to the fact that they usually have a low volatility and small growth opportunities63. This suggests that in cases where management is easier to monitor, the need for expensive incentive contracts is lower64. Small, highly volatile firms with high growth opportunities on the other hand, tend to use more incentive generating compensation since it is difficult to monitor manager’s actions sufficiently65.
Those highly performance sensitive CEO compensation plans are more expensive, because "[...] these contracts typically incorporate risk premiums to compensate for [the] risk shifting"66. Part of this premium could for example be a higher base salary67.
In recent years, after the various crises, media as well as the public and politics started to pay close attention to top management compensation. In many cases, contemporary compensation plans were perceived as unfair and not justifiable with respect to delivered performance. As a prominent example just remember when Stephen Hester, CEO of the Royal Bank of Scotland (RBS), bowed to the political pressure in January 2012 and "[...] decided he would not accept the 3.6m shares that the bank's board had decided to award him [...]"68. Some protagonists in the recent public uproar claimed that flaw compensation schemes were limited to a few companies, or that they are outcomes of unintended mistakes made by the board, and henceforth should be corrected fast.
62
cf. e.g Jensen, Murphy, 1990, “Performance Pay and Top-Management Incentives”; Hartzell, Starks, 2003, “Institutional Investors and Executive Comepensation”;
63
cf. Hartzell, Starks, 2003, “Institutional Investors and Executive Comepensation”
64
cf. Fahlenbrach, 2009, "Shareholder rights, Boards, and CEO compensation"
65
cf. Byrd, Parrino, Pritsch, 1998, "Stockholder-Manager Conflicts and Firm Value"
66
cf. Nyberg, Fulmer, Gerhart, Carpenter, 2010, "Agency theory revisited: CEO Return and Shareholder interest alignment", p.1035
67
cf. Fahlenbrach, 2009, "Shareholder rights, Boards, and CEO compensation", p.84
68
http:\\www.guardian.co.uk\business\2012\jann\29\rbs-stephen-hester-waives-bonus (last access on Jan. 31st, 2012)
25 Previews empirical evidence rather supports public perceptions than rejecting them, finding that "[...] 'bad apples' [...] have been widespread, persistent, and systematic [...]"69, and furthermore identifying "[...] structural defects in the underlying governance structures that enable executives to exert considerable influence over their boards"70. Those defects in turn enable managers to influence their compensation significantly.
Some investors may feel that a firm’s direct expenditures in managements’ compensation are negligible small and economically not significant (left alone the costs incurred through providing flaw incentives). Empirical results, however, revealed that the aggregate compensation paid to top-five executives in the US economy between 1993 and 2003 was about $350 billion. Presented as a percentage of total earnings (net income) the economic relevance of executive compensation becomes even more evident. From 1993 to 2003, overall compensation of the top-five executives equaled roughly 7 percent of the aggregate earnings. Since the magnitude was smaller in the first years of this period (around 5% from 1993 to 1997, and over 8% from 1999 till 2003), the findings suggest a “[…] growing economic significance of executive pay”71.
Although executive compensation is apparently expensive, pay-for-performance sensitivity is pretty low according to some researchers. A study by Jensen and Murphy in 199072 analyzing the relationship between change in shareholder wealth and CEO wealth, revealed that CEO’s cash compensation changed only about 3 cents per $ 1000 change in shareholder wealth (including stock options CEO’s wealth change was equal to about 30 cents). According to them, this weak relationship is primary an outcome of compensation constraints imposed by politics and the public73. These constraints prevent firms from paying their managers a sufficient amount in order to reduce the agency problem. In a recent article Dillon74, confirming that view, argued that the increased public scrutiny of recent years potentially cause firms problems in finding new talent for vacant management jobs, which in turn would
69
cf. Bebchuk, Fried, 2006, "Pay without Performance: An overview over the Issues", p.6
70
cf. Bebchuk, Fried, 2006, "Pay without Performance: An overview over the Issues", p.6
71
cf. Bebchuk, Grinstein, 2005, “The Growth of Executive Pay”,p.295; which is also consistent with the findings of Fahlenbrach, 2009, "Shareholder rights, Boards, and CEO compensation"
72
cf. Jensen, Murphy, 1990, “Performance Pay and Top-Management Incentives”
73
In their 2008 paper, "Information asymmetry, contract design and process of negotionan: The stock options awarding case", Bruslerie and Deffains-Crapsky also argued in favor of this argumentation by defining a model in which any interference by politics or society in the option granting process will "[...] induce a social cost of mis-optimization [p.90]".
74
26 have a negative impact on firm performance in the long run. In fact, she argues that firms feel that "[...] the challenge of setting executive pay sufficient to attract, motivate, and retain top talent just got harder [...]"75. Hence, it would be necessary to ensure that top managers earn at least the same as they would get anywhere else76. Such practices however, could lead to inefficient arrangements, because committees could seek to reward similar as peer groups rather than connecting the compensation sufficiently to performance.
This is why others77 argue that the composition and implementation of management compensation is to blame for the apparently weak connection between performance and executive pay. They identify potential problems within the components, which are briefly discussed in the following:
Base salary: Although the base salary could, theoretically, be awarded in a performance contingent way too (by cutting and raising it depending on performance), "empirical evidence suggests [...] that U.S. firms do not use salary mechanisms effectively"78. This is why the base salary is typically the fixed income a manager gets within one year, independent of his performance. Due to this independence, the pay-for-performance sensitivity will be lower in firms where base salary accounts for a high portion of total compensation. Most managers, however, will require a certain amount of base salary in order to compensate the risk they are taking in accepting a high portion of their annual pay to be conditional on performance.
Due to the fact that base salary is decreasing sensitivity, it would be useful to run an additional regression without it, in order to test whether or not the other components of compensation are sufficiently connected to performance and how big the negative impact of base salary on performance sensitivity is.
Bonus: This is the part of the compensation that should be directly conditional on performance. Part of it is usually dependent on stock market performance, part on accounting numbers and yet another part depends on subjective factors such as employee satisfaction. The problem is, that “although bonuses represent 50 percent of CEO salary,
75
cf. Dillon, 2009, "The coming battle over executive pay", p.97
76
cf. Jensen, Murphy, 1990, “CEO incentives – It’s not how much you pay, but how”
77
cf. Bebchuk, Fried, 2006, "Pay without Performance: An overview over the Issues"
78