THE VALIDITY,
INTERPRETATION
AND USE OF SCHOOL
VALUE-ADDED
MEASURES
By
Thomas Perry
A thesis submitted to the
University of Birmingham
for the degree of
Doctor of Philosophy
School of Education
College of Social Sciences
University of Birmingham
February 2016
University of Birmingham Research Archive
e-theses repository
This unpublished thesis/dissertation is copyright of the author and/or third parties. The intellectual property rights of the author or third parties in respect of this work are as defined by The Copyright Designs and Patents Act 1988 or as modified by any successor legislation.
Any use made of information contained in this thesis/dissertation must be in accordance with that legislation and must be properly acknowledged. Further distribution or reproduction in any format is prohibited without the permission of the copyright holder.
Abstract
This thesis examines the validity of school value-added measures and the validity of arguments for their interpretation and use. The opening chapters review the development of school value-added measures, existing evidence on their properties and validity and their current use in research, policy and practice. The empirical results are based on four studies using English National Pupil Database data and a large, nationally-representative dataset of teacher-assessed attainment data for English pupils aged from 7 to 13. The findings all relate to the properties of school value-added measures and the seriousness of a number of threats to their validity. The four empirical studies examine the following issues: observable bias and error, inter-method reliability when compared to estimates from a quasi-experimental regression discontinuity design, stability of school value-added scores and of specific cohorts over time, and consistency of school value-added scores within cohorts and between different school cohorts at a single point in time.
The closing chapters discuss the validity of value-added measures in general and in relation to the areas of use identified. Individually and collectively, the results advance understanding of numerous threats to validity and have substantial implications for the use of value-added measures in research, policy and practice.
To my beloved family
Elaine, Evelyn and ‘Bump’
Acknowledgements
My supervisors, Peter Davies and Stephen Gorard, have been immensely influential in shaping the ideas in this thesis and my development as a researcher more generally. I truly appreciate all their generous support and valuable advice. I consider myself incredibly lucky to have had two brilliant supervisors guiding my research.
I would also like to thank my friends and family whose patience, interest and constant support have kept me going throughout my studies. I am especially grateful to my wife Elaine and daughter Evelyn who have managed to keep things in perspective and a smile on my face; my friends, Becky Morris and Keir Irwin Rogers, for always showing an interest in my research; and my parents and parents-in-law for always being there to support me.
Finally, I would like to thank the ESRC who, in funding my research, have given me an opportunity to explore my interests and pursue a career seeking answers to important questions.
Table of Contents
1.
Introduction and Summary ... 1
1.1 Chapter Introduction ... 1 1.2 Thesis Introduction ... 1
1.2.1 Summary of Thesis Topic and Contribution
1.3 Introduction to the Area of Study ... 3 1.3.1 Scope and Focus
1.3.2 Introduction to Value-Added and the Question of its Validity
1.4 Summary of Chapters ... 11 1.4.1 Chapter Aims and Overview
2.
The Aims and Designs of Value-Added Measures ... 15
2.1 Chapter Introduction ... 15 2.2 Value-Added and the School Effect ... 15
2.2.1 The Value and Problems of Educational Measurement 2.2.2 The Aim of Value-Added
2.2.3 Origins of the Term ‘Value-Added’
2.2.4 Adapting Value-Added to the Problem of School Effectiveness
2.3 Value-Added Model Designs ... 21 2.3.1 Introduction
2.3.2 School-Level Models
2.3.3 Pupil-Level Value-Added Models 2.3.4 Multi-level Value-Added Models 2.3.5 Growth Models
2.3.6 Further Variations and Alternative Applications
3. Value-Added in Research, Policy and Practice ... 32
3.1 Chapter Introduction ... 32 3.2 Survey of Educational Effectiveness Research Use of Value-Added ... 32
3.3 The Use of Value-Added in Educational Effectiveness Research ... 37 3.3.1 Introduction
3.3.2 Use of the Value-added Method for the Identification of Educational Effectiveness Factors
3.3.3 School-Level Random Effects 3.3.4 Teacher-Level Random Effects
3.3.5 Review of Wider Research Use of Value-Added
3.4 The Use of Value-Added in English Educational Policy and Governance ... 44 3.4.1 Introduction
3.4.2 Developing Value-Added as a National School Performance Indicator 3.4.3 Reforms 2010-2015
3.4.4 The New Generation of Progress Measures
3.5 The Impact and Use of School Value-Added in School Practice ... 56 3.5.1 Introduction
3.5.2 Use of and Attitudes towards Data in English Schools 3.5.3 Value-Added Evidence as Part of School Data Use 3.5.4 Use of Value-Added Data Services and Tools 3.5.5 Summary: Value-Added Data in English schools
4.
The Validity of Value-Added Measures ... 67
4.1 Chapter Introduction ... 67 4.2 Evidence Concerning the Validity of School Value-Added Measures ... 68
4.2.1 Introduction to the Validity of Value-Added Measures of School Effectiveness 4.2.2 The Problem of Bias
4.2.3 Measurement Error 4.2.4 Stability
4.2.5 Consistency
4.3 Interpretation of Value-Added Evidence and Methodological Assumptions... 95 4.3.1 Section introduction
4.3.2 The Problem of Justification: Bias, Error or Effect?
4.4 Alternative Measures of School Effectiveness ... 112 4.4.1 Introduction to Alternative Measures of School Effectiveness
4.4.2 Alternative Measures of School Effectiveness
4.4.3 Measuring School Effectiveness using a Regression Discontinuity Design 4.4.4 Comparing Regression Discontinuity and Value-Added Designs
5.
Methods ... 120
5.1 Chapter Introduction ... 120 5.1.1 Introduction to the Four Empirical Studies
5.1.2 Chapter Organisation
5.2 Research Questions and Design ... 121 5.2.1 Core Research Question
5.2.2 Primary Research Questions 5.2.3 Analytical Approach
5.3 Key Data Sources ... 125 5.3.1 Performance Tables Data
5.3.2 National Pupil Database Data 5.3.3 ‘Making Good Progress’ Data
5.3.4 Approaches and Actions Common to all Studies
5.4 Study 1 - Bias and Error ... 130 5.4.1 Overview and Research Questions
5.4.2 Sample
5.5 Study 2 - Inter-Method Reliability ... 133 5.5.1 Overview and Research Questions
5.5.2 Sample
5.6 Study 3 – Stability over Time ... 137 5.6.1 Overview and Research Questions
5.6.2 Sample
5.7 Study 4 – Cohort Consistency ... 138 5.7.1 Overview and Research Questions
6.
Results ... 140
6.i Chapter Introduction and Organisation ... 140 6.1 Study 1 - Bias and Error ... 140 6.1.1 RQ 1.1 - Are there observable biases in the current English value-added measure?
6.1.2 RQ 1.2 - What is the level of missing data in the National Pupil Database? 6.1.3 RQ 1.3 - What is the influence of measurement error on value-added scores? 6.2 Study 2 - Inter-Method Reliability ... 174
6.2.1 RQ 2.1 - How similar are estimates of effectiveness produced by value-added (VA), cross-sectional regression discontinuity (RD) and longitudinal regression discontinuity (LRD) designs?
6.3 Study 3 - Stability over Time ... 183 6.3.1 RQ 3.1 - How stable is the current English value-added measure across several years?
6.3.2 RQ 3.2 - Is the rate of stability in value-added scores associated with school performance?
6.3.3 RQ 3.3 -How stable is the contextual value-added performance of a given cohort over time?
6.4 Study 4 – Cohort Consistency ... 193 6.4.1 RQ 4.1 - How consistent are value-added estimates of performance across cohorts from within a single school in a single year?
6.4.2 RQ 4.2 - How consistent is performance within cohorts?
6.4.3 RQ 4.3 - Does within-cohort consistency vary by mean school performance?
7. Discussion ... 205
7.1 Chapter Introduction ... 205 7.2 General Implications of the Results... 206
7.2.1 Section introduction
7.3 The Validity of Value-Added in Relation to Interpretation and Use ... 212 7.3.1 Introduction
7.3.2 Theoretical Basis for Considering Validity in Relation to Interpretation and Use 7.3.3 Implications for Policy Use of Value-Added Evidence
7.3.4 Implications for Practice
7.3.5 Implications for Educational Effectiveness Research
8. Summary and Conclusions... 242
8.1 Chapter Introduction and Thesis Summary ... 242 8.1.1 Chapter Introduction
8.1.2 Thesis Summary
8.1.3 Key Results and Other Thesis Contributions 8.1.4 Study Limitations and Areas for Further Research
8.2 Conclusions ... 248 8.2.1 The Validity of Value-Added Measures
8.2.2 Implications and Recommendations
8.2.3 Concluding Remarks: The Value of Value-Added
List of Figures
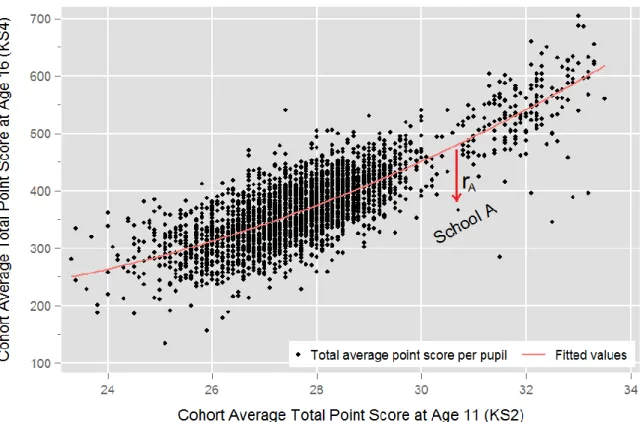
Figure 2.4.2a - 2014 KS2 Scores against KS4 Scores at School-Level ... 23
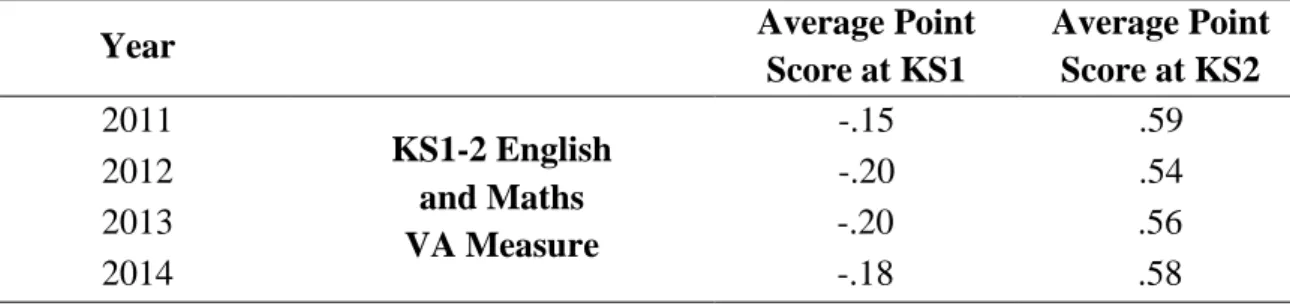
Figure 2.4.2b - 2014 KS2 Scores against KS4 Scores at School-Level with added marking showing the (negative) residual (rA) for School A ... 24
Figure 6.1.1a - 2014 School KS2-4 Value-Added Scores against selected Contextual Variables at School-Level with linear trend lines and reference lines. ... 147
Figure 6.1.1b - Boxplots of School-Level Value-Added by Intake Single-Sex Status ... 148
Figure 6.1.1c - The Effect of Taking Pupil-Level Contextual Factors into Account on 2013 School KS2-4 Value-Added Scores ... 149
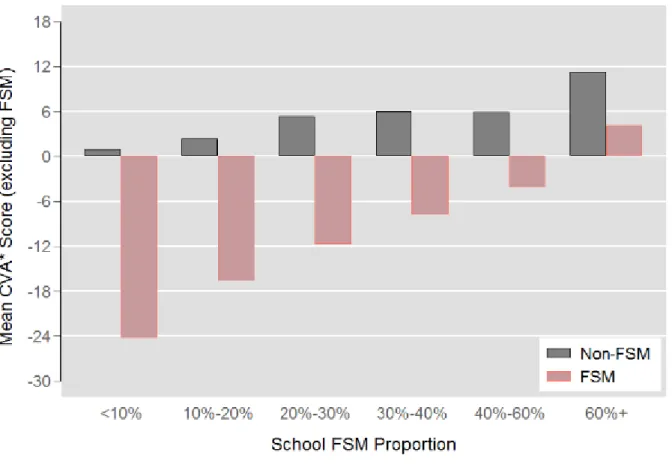
Figure 6.1.1e - Mean Difference in CVA performance for Non-FSM and FSM status pupils by School FSM Proportion in a CVA model excluding measures of disadvantage ... 151
Figure 6.1.1f - 2014 School KS1-2 Value-Added Scores against selected Contextual Variables at School-Level with linear trend lines and reference lines... 154
Figure 6.1.1g - The Effect of Taking Pupil-Level Contextual Factors into Account on 2012 School KS1-2 Value-Added Scores ... 156
Figure 6.1.2a - 2013 KS4 Pupil Attainment Distribution on the Best 8 Score (Plus Bonus) Measure ... 159
Figure 6.1.2b - 2008 Pupil KS2 Attainment Distribution ... 160
Figure 6.1.2c - 2012 Pupil KS2 Attainment Distribution ... 161
Figure 6.1.2d - 2012 Pupil KS1 Attainment Distribution ... 162
Figure 6.1.3a - Estimated Change in School-Level KS2-4 Value-Added Scores after Introducing a Small Pupil-Level Error in the KS2 and KS4 Attainment Scores. ... 165
Figure 6.1.3b - Estimated Change in School-Level KS2-4 Value-Added Scores after Introducing a ‘Small’ Pupil-Level Error in the KS2 and KS4 Attainment Scores excluding Selective Schools ... 166
Figure 6.1.3c - Estimated Change in School-Level KS2-4 Value-Added Scores after
Introducing a ‘Medium’ Pupil-Level Error in the KS2 and KS4 Attainment
Scores. ... 167
Figure 6.1.3d - Estimated Change in School-Level KS2-4 Value-Added Scores after Introducing a ‘Large’ Pupil-Level Error in the KS2 and KS4 Attainment Scores ... 168
Figure 6.1.3e - Median Error in School-Level Value-Added by Average Key Stage 2 Score ... 169
Figure 6.1.3f - Estimated Change in School-Level KS1-2 Value-Added Scores after Introducing a ‘Small’ Pupil-Level Error in the KS1 and KS2 Attainment Scores ... 171
Figure 6.1.3g - Estimated Change in School-Level KS1-2 Value-Added Scores after Introducing a ‘Medium’ Pupil-Level Error in the KS1 and KS2 Attainment Scores ... 172
Figure 6.1.3h - Estimated Change in School-Level KS1-2 Value-Added Scores after Introducing a ‘Large’ Pupil-Level Error in the KS1 and KS2 Attainment Scores ... 172
Figure 6.1.3i - Median Error in School-Level Value-Added by Average Key Stage 2 Score ... 173
Figure 6.2.1a - How a Regression Discontinuity Design Separated Maturity from Added-Year Effects, Diagram from (Luyten et al., 2009, p.155), Figure 2a ... 175
Figure 6.3.2a - Distribution of 1 and 2 year Differences in Primary School Value-Added Scores ... 188
Figure 6.3.2b – Distribution of 1 and 2 year Differences in Secondary School Value-Added Scores ... 190
Figure 6.4.1a - School CVA performance for NC Year 5 and Year 6 in 2010 (r=.51) ... 195
Figure 6.4.2a - 2013 Secondary School Value-Added Score Distribution ... 197
Figure 6.4.2b - Secondary School Standard Deviations of Pupil-Level VA Scores 2013 ... 197
Figure 6.4.2c - Pupil-Level VA Distribution for a Typical Secondary School (School-Level VA score of -15.3) ... 198
Figure 6.4.2e - Primary School Standard Deviations of Pupil-Level VA Scores 2013 ... 199 Figure 6.4.2f - Pupil-Level VA Distribution for a Typical Primary School
(School-Level VA score of -2.9) ... 200 Figure 6.4.3a - Pupil-Level VA Distributions for Selected Secondary Schools across the
Performance Range ... 202 Figure 6.4.3b - Pupil-Level VA Distributions for Selected Primary Schools across the
Performance Range ... 204 Figure 7.3.2a - Overview of Process for the Use of Value-Added Evidence ... 216
List of Tables
Table 1.4.1a - Chapter Content Summary ... 11
Table 3.2.1a - Methods used in Educational Effectiveness Research ... 34
Table 3.2.1b - Overview of the Concerns of Empirical Educational Effectiveness Studies ... 36
Table 3.5.2a - Attitudes to the Use of Data, adapted from Saunders (2000, pp.252-253) ... 59
Table 5.2.2a - Primary Research Questions ... 122
Table 5.4.1a - Primary and Secondary Research Questions for Study 1... 131
Table 5.5.1a - Primary and Secondary Research Questions for Study 2... 134
Table 5.5.2a - Year group and number within each cohort by time period ... 136
Table 5.6.1a - Primary and Secondary Research Questions for Study 3... 137
Table 5.7.1a - Primary and Secondary Research Questions for Study 4... 139
Table 6.1.1a - Correlation between KS2-4 value-added measures, prior attainment and final attainment 2004-2014 (School-level Data) ... 142
Table 6.1.1b - Correlation between KS1-2 value-added measures, prior attainment and final attainment 2011-2014 (School-level Data) ... 143
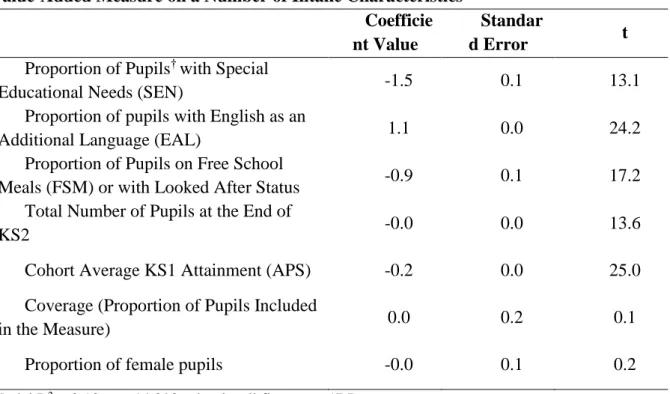
Table 6.1.1c - Results of a School-Level Multiple Regression Analysis of the 2014 KS2-4 Best 8 Value-Added Measure on a Number of Intake Characteristics ... 145
Table 6.1.1d - Number of Schools for each Level of Difference between the Official 2013 KS2-4 Value-Added Measure and a Simulated CVA Measure. ... 150
Table 6.1.1e - Results of a School-Level Multiple Regression Analysis of the 2014 KS1-2 Value-Added Measure on a Number of Intake Characteristics ... 153
Table 6.1.1f - Number of Schools for each Level of Difference between the Official 2012 KS1-2 Value-Added Measure and a Simulated CVA Measure. ... 156
Table 6.1.2a - Levels of missing data for attainment and contextual variables in 2013 National Pupil Database KS4 data ... 157
Table 6.1.2b - Levels of missing data for attainment and contextual variables in 2012 National Pupil Database KS2 data ... 158
Table 6.1.3a - Random error introduced into KS2 and KS4 scores during simulation ... 164
Table 6.1.3b - Random error introduced into KS1 and KS2 scores during simulation ... 171
Table 6.2.1a - Added year effects by national curriculum year ... 178
Table 6.2.1b - Estimated school effects on attainment for each measurement design ... 181
Table 6.2.1c - The correlation between the value-added measure and four regression discontinuity measures for the corresponding study year and national curriculum year ... 182
Table 6.3.1a - Pairwise correlations over time in primary school value-added and unadjusted attainment measures ... 183
Table 6.3.1b - Pairwise correlations over time in secondary school value-added and unadjusted attainment measures ... 184
Table 6.3.1c - Pairwise correlations over time in secondary school value-added and unadjusted GCSE-only attainment measures... 184
Table 6.3.2a - Pairwise correlations over time in primary school value-added and unadjusted attainment measures by performance quintile ... 186
Table 6.3.2b - Pairwise correlations over time in secondary school value-added and unadjusted attainment measures by performance quintile ... 189
Table 6.3.3a - Pairwise correlations over time in cohort CVA performance ... 192
Table 6.4.1a - Pairwise correlations of primary cohort CVA scores 2008-2010 ... 194
Table 6.4.1b - Pairwise correlations of secondary cohort CVA scores 2008-2010 ... 195
Table 6.4.3a - Summary Statistics of the Pupil-Level VA Distributions for Selected Secondary Schools across the Performance Range Shown in Figure 6.4.2a ... 201
Table 6.4.3b - Summary Statistics of the Pupil-Level VA Distributions for Selected Primary Schools across the Performance Range Shown in Figure 6.4.2b ... 203
Table 7.3.2a – Factors Impacting on Validity by Stage (see Figure 7.3.2a) ... 217
Table 7.3.3a - Example of an alternative to presenting mean scores in light of high levels of inconsistency ... 227
List of Appendices
Appendix A ...1
A1 Technical Details: School-Level Value-Added Models ... 1
A2 Technical Details: Pupil-Level Value-Added Models ... 3
A3 Technical Details: Multi-level Value-Added Models ... 5
Appendix B ...7
B1 Methodological Survey Papers and their Categorisation ... 7
B2 Secondary Reference List for Appendix B, Table B.1a ... 8
Appendix C ...12
C1 Details of National Pupil Database variables used during analysis ... 12
C2 Model Specifications and Raw Output RQ 1.1.3 ... 12
C3 Model Specifications and Raw Output RQ 1.1.3 ... 13
C4 Model Specifications and Raw Output RQ 1.1.4 ... 16
C5 Model Specification and Output for RQ 1.3.1 ... 18
C6 Model Specification and Output for RQ 1.3.2 ... 20
Appendix D ...21
D1 Model Specification and Selected Output: CVA Measure, Study 2 ... 21
D2 Model Specification and Selected Output: RD1 Measure, Study 2 ... 23
D3 Model Specification and Selected Output: RD2 Measure, Study 2 ... 25
Appendix E ...28
E1 Model Specification and Selected Output: CVA Measure, Study 3-4 ... 28
Appendix F ...30
1.
Introduction and Summary
1.1
Chapter Introduction
This chapter introduces the core problem examined in this thesis, the issues surrounding it, how this thesis aims to contribute to understanding in these areas and the organisation of the thesis.
1.2
Thesis Introduction
1.2.1 Summary of Thesis Topic and Contribution
This research concerns the validity of value-added measures of school effectiveness. Value-added models are used extensively in educational research, accountability systems and policy-making to estimate school performance. Value-added evidence is used to inform and underpin myriad research findings, policy decisions and high-stakes school performance judgements. It is cause for concern then that there are theoretical and empirical grounds to doubt whether school value-added scores provide valid and unbiased measures of the causal effect of schools on their pupils (Coe and Fitz‐Gibbon, 1998, Gorard, 2010, Marsh et al., 2011). Moreover, there are difficulties even specifying what would constitute measurement validity in relation to value-added measures given that school effectiveness is operationalised as a latent, unobservable property of schools which is ‘revealed’ by the value-added statistical procedure itself (Gorard et al., 2012, p.3). Interpretations of the evidence generated using a value-added method are underpinned by many assumptions about what constitutes error, bias and effect within the data and the extant evidence base does not provide a definitive test of these assumptions. It is within this context of undetermined validity that this study submits its core research question: Are school value-added measures valid measures of school effectiveness? Currently, researchers have strikingly different views on this question and there are numerous points of contention within debates about the validity of school value-added measures and the value-added method more generally.
There are two fundamental arguments running through this thesis which provide an answer to this core research question: First, in the absence of a definitive test of these assumptions, examining the validity of value-added involves drawing on numerous sources
of evidence pertaining to bias, error, stability and consistency within the measure. By examining these sources of evidence it is possible to identify specific validity problems and create approximate bounds on what is reasonable to conclude about the validity of particular value-added measures and value-added measures in general. This thesis presents original evidence organised within four empirical studies which update, extend and advance what is known about the properties and validity of value-added measures. The findings have a number of serious implications for the use of value-added in general and the English official school value-added measure in particular and form part of the answer to the core research question.
Even with the best available evidence, such as that reviewed and presented, there is still considerable scope for differing interpretations of the available evidence. As a result, and drawing on recent work in measurement validity (notably Kane, 2013), the second fundamental argument in this thesis is that it is valuable for debates about the validity of value-added to take place in relation to specific interpretations and uses, in addition to drawing on more general validity evidence. Drawing conclusions about the validity of value-added in general ignores important distinctions which are needed about the specific data, value-added measure, its interpretation and its use. To this end, Chapter 3 reviews the current use of value-added across educational effectiveness research, English policy and English practice. This allows the final chapters to discuss results and reach conclusions about the validity of school value-added in relation to various applications and the relevant differences between them.
The key contribution of this thesis to this debate - its ‘value-added’ – is that it brings together, updates, advances, synthesises and evaluates a large range of evidence and many fundamental methodological ideas within what is a large area of enquiry. This is an ambitious undertaking which involves applying the recent methodological advances in the field as well as scrutinising its most basic foundations. This range and depth of study is what is held to be required to advance what is a complex, longstanding and unresolved issue.
1.3 Introduction to the Area of Study
1.3.1 Scope and Focus
This section specifies and justifies the focus and scope which has been chosen for this particular study within the broader topic of value-added.
The most important distinction concerns the level of analysis. Value-added is a methodological approach to isolating and estimating the effect of one factor independently of other known influences. Its initial applications to education were to estimate the effectiveness of schools (Saunders, 1999). The methodology, however, can be adapted to estimate the effect of other levels within the education system such as classes, teachers, departments and local area authorities. In different national and policy contexts, the unit of analysis which is emphasised varies. The UK government, for example, has historically seen the school as the key level at which performance is judged publically, using school ‘league tables’ and school value-added measures (Acquah, 2013). In contrast, the USA has seen numerous states take teachers as the key unit of analysis, creating a demand for teacher-level value-added measures (Harris, 2009). Use of value-added in research tends to place less emphasis on school level variation due to the prevailing view that teacher effects outweigh school effects (Muijs et al., 2014).
This study focuses on school-level value-added measures. This decision was taken primarily because, in the English system, the school is often taken as the key organisational unit at which many decisions are taken by policy-makers, parents and schools themselves (Chapman et al., 2011). The use of value-added in the English accountability context and the use of the official value-added measures by school leaders and governors is arguably the most consequential application of value-added measures in England. There are also more pragmatic reasons for focusing on the school level. Secondary data sources at pupil and school levels are more readily available in the UK through the National Pupil Database (NPD) as well as other sources. This allows the use of relatively high-quality data which are used by policy makers and by schools themselves.
The second decision made regarding the scope and focus of the research is where to situate the research on a continuum from technical-theoretical properties of school value-added all the way to the practical-empirical aspects. This study aims for some interim position with sufficient scope to address fundamental theoretical questions but to do so in
relation to empirical evidence and specific practical contexts. Despite its breadth, this interim position excludes concerns at either end of this spectrum. Specifically, while all key mathematical models are formally specified and discussed, this thesis does not attempt an extended treatment of the theoretical mathematical foundations of the statistics involved in value-added measurement. At the more practical end, this study does not present new evidence on the public or professional usage of value-added and the wider consequences of its use. Yet, as described above, this thesis argues that it is of value to consider the validity arguments for the interpretation and use (Kane, 2013) of value-added all the way from consideration of the specific dataset and model to the interpretations and uses made on the basis of value-added evidence. Without further study of how value-added measures are used and interpreted by users in practice some of the details of how and if appropriate interpretation and use is achieved in practice cannot be addressed here.
A third and final factor focusing this research is the countries from which evidence is drawn. In relation to policy, the focus is predominately on the English education system. While international evidence is brought in during the review of the literature and many of findings and issues which are discussed have international relevance, as only English data are used, there will be some limit to the degree with which the findings can be directly applied to a more international context. With regards to the use of value-added in research, the focus is not confined to the English context and instead uses two journals as a reference point for educational effectiveness research: namely, School Effectiveness and School Improvement and Journal of Research on Educational Effectiveness. While extensive literature searches encompassed relevant publications from other sources, these journals are held to be indicative of the research use of value-added and are therefore a point of reference for this study.
1.3.2 Value-Added and the Question of its Validity
School effects are not a readily-observable, manifest quality of schools. Schools work to achieve numerous broad educational aims in a diverse range of contexts, dealing with particular circumstances, varying resources and with vastly differing pupil intakes. Differences between schools’ intakes such as their prior attainment levels or in contextual factors such as economic disadvantage are problematic due to the strong association between these and pupils’ subsequent achievement (Teddlie and Reynolds, 2000). Faced with this
complexity, drawing conclusions about school performance from ‘raw’ attainment scores is highly problematic and is likely to reveal more about intakes than school performance. Early school effectiveness researchers set out to discover whether some schools could be shown to be ‘better’ than others. This apparently modest task is in fact surprisingly difficult to achieve. The general approach was to identify apparently similar pupils attending different schools and then compare their outcomes. If pupils with the same baseline results and similar characteristics were found to have markedly different outcomes, this would suggest that there are differences between how effective schools are. Early school effectiveness studies such as Rutter (1983) found that appreciable differences between schools remained even after taking major differences in intake into account and so concluded that there were differences between the effectiveness of schools.
The approach taken by studies to produce estimates is to construct a statistical expectation for each pupil depending on their previous performance and measured characteristics. Through this expectation, the actual pupil performance can be compared to statistically-similar pupils. A (positive or negative) value-added score is then created from the difference between this expectation and the pupil’s actual performance. The school mean of these pupil scores is calculated (subsequently or concurrently within a multi-level model) in order to create a measure of school performance (Ray, 2006). This captures the average difference in performance between the pupils at the school and that of statistically-similar pupils nationally. The assumption is generally made that this unexplained difference is causally attributable to the performance of the school because other known extraneous factors have been controlled when creating the statistically expected performance (Teddlie and Reynolds, 2000). Moreover, as the unexplained difference is thought to be attributable to the school (subject to measurement error), it is considered possible to learn about the properties of the school effect from studying this residual variation, as is discussed below.
The validity of the value-added measure as a measure of school performance, to a large extent, hinges on how valid this causal assumption is (Coe and Fitz‐Gibbon, 1998). As Marsh et al. (2011, p.283) comment, the most basic assumption behind the prevailing approaches in the field is that statistical “models appropriately control for pre-existing differences so that [value-added] estimates reflect the effects of the teacher or school being evaluated and not the effects of prior schools, prior teachers or other pre-existing differences". Without this assumption, much of the existing evidence base can only be
considered descriptive (with no attribution of causation) and practical conclusions become more unclear and uncertain as a result (Marsh et al., 2011). Without experimental evidence it is difficult to reach a strong position on the question of causality (Fitz-Gibbon, 1997). This problem has long been recognised by educational effectiveness researchers. For instance, Rutter (1983, p.12) noted the limitations of non-experimental evidence, but argued that research comparing pupil intakes, school characteristics and pupil outcomes across schools and over time provided ‘strong circumstantial evidence’ of differing school effectiveness.
This brings us to a key issue addressed in this thesis: that of justification. If value-added measures and associated estimates of school effects were valid (or meaningless), how would we know? Is this a question that can be resolved through ‘circumstantial evidence’? In large part, the difficulty resolving this question stems from the nature of the value-added method: the school effect is cast as a latent property which is ‘revealed’ through the value-added analysis itself (Gorard et al., 2012). Key threats to validity such as the confounding effects of unobserved variables and measurement error are, by their nature, difficult to rule out. Many non-school factors which influence learning go unmeasured (Dearden et al., 2011b) and may even be unmeasurable, at least in a practical context (Tymms, 1996). All this means that it is very difficult to know the true causes for the differences captured in value-added evidence and, crucially, to what extent these differences are causally attributable to schools.
The problem of misplaced causal attribution (i.e. mistaking error or bias for school effect) is one educational effectiveness researchers have guarded against by stressing the need to consider the stability, consistency and statistical significance of effects. For instance, in response to criticism of the field in Gorard (2010), Muijs et al. (2011, pp.3-4) make the following points:
Similarly, Teddlie and Reynolds (2000, p.116) state that ‘if the results from difference measures of school effectiveness are consistent, then the researcher may conclude that the school is effective (or ineffective) with some confidence… [Otherwise] the researcher faces a dilemma in interpretation of the overall effectiveness status of the school.’
Yet, a large area of school effectiveness research into ‘methodological issues’ (Teddlie and Reynolds, 2000, p.49) examines such variation, not as a way of establishing confidence, but in order to further understand the properties of the school effect itself. So, for example, one can examine whether schools are differentially effective with different groups of pupils, or across different subject areas (Sammons et al., 1996). By the turn of the century, such study had led to the consensus that school effectiveness should be considered ‘multi-faceted’ with Thomas (2001, p.285) suggesting at least 4 dimensions are apparent: outcomes, pupil groups, cohorts and curriculum stages. More recent research continues to emphasise the inherent complexity of educational effects (Chapman et al., 2015). But returning to the problem of justification, at what point does instability or inconsistency reduce confidence (a word not used in its statistical sense) in the effect rather than merely revealing its properties? Critics point out that ascribing such ‘complexity’ (Sammons, 1996, p.143) to the school effect and accommodating this within similarly complex multi-level models is ‘to assume from the outset that which the modelling is supposed to be seeking or testing’ (Gorard, 2010, p.756). A common justification supporting the assumption that
“...it is only possible to distinguish groups of schools where pupil progress is significantly better or worse than predicted on a given outcome measure.
Researchers have repeatedly emphasised that school effectiveness is a relative and retrospective concept that is both outcome- and time-dependent, and that as a consequence there is a need to study consistency, stability and differential effectiveness covering variations in different outcomes, including departmental effects for secondary schools, and trends over time and for different groups of pupils (Luyten and Sammons, 2010, Creemers et al., 2010)”
differences reflect effect rather than error given by prominent educational effectiveness researchers it that ‘there is so much independent agreement on the size of school effects, their scientific properties, the factors responsible for them, and the ways they can be utilised for school improvement’ (Reynolds et al., 2012, p.12). This response essentially appeals to the consistency of findings and their face validity (Isaacs et al., 2013) as justification for their validity, or what Rutter (1983, p.12) called ‘circumstantial evidence’ (see above).
Although the face validity justification is weak, in the absence of more robust tests (see below), it is entertained in this thesis which presents empirical evidence examining the stability and consistency of value-added measures, in addition to evidence on bias and error. Maintaining that inconsistency between pupil performances within a school is effect rather than error inevitably leads to a shift in our understanding of the nature of the school effect itself: Inconsistency must either stem from error or from differential school effectiveness. Similarly, instability must stem from changes in school performance or from error. So if one is to maintain the assumption that what is observed is effect rather than error, it is also necessary to accept the properties of the school effect which are suggested through examination of its stability and consistency. If these cannot be accepted, the face validity justification does not hold. In this way, the presentation of stability and consistency evidence in this thesis must either contribute to our understanding of school effects or give a better position from which to judge whether value-added methods are valid at face.
What can be concluded, however, if the face validity justification is upheld or underdetermined by the evidence? Unfortunately, there are no direct alternatives to value-added to address the particular problem it seeks to solve (context-independent comparison of school performances) and so it is difficult to validate value-added scores using an alternative approach (Gorard et al., 2012). There are few options: it is unfeasible to estimate school effects experimentally due to the ethical aspect of random allocation of pupils to schools (Goldstein and Spiegelhalter, 1996), although relevant studies in teacher-level randomisation (e.g. Nye et al., 2004) are considered in Chapter 3. Design-based approaches to tackling these confounding variables and estimating their significance and impact (such as those created by ‘natural experiments’ like policy changes) are rare and are not workable more widely as policy tools. It is difficult to even find suitable alternative measures which can be used as a source of comparison. Other sources of school performance information
(e.g. school inspection reports), for instance, have severe limitations as sources of confirmation that value-added is capturing differences in school performance as is claimed. The lack of a definitive test of validity and differing methodological assumptions have led researchers and users to reach markedly different conclusions regarding the robustness and validity of value added evidence and the conclusions warranted from it. As Gorard (2010, p.746) points out, profound differences in interpretation arise even on the most fundamental issues despite interpretations being ‘based on pretty much the same evidence’. To understand the problem examined in this thesis, it is essential to recognise that it is partly a problem of interpretation of evidence. On the one hand, researchers are using value-added measures to identify more or less effective schools in order to better understand the (school and non-school) factors which influence rates of pupil progress (e.g. Strand, 2014a, Sammons, 2014, Chapman and Muijs, 2013). On the other hand, on the basis of numerous methodological studies and papers, Gorard (2011c, p.26) concludes that (contextualised) value-added is ‘meaningless for any practical purpose’ and Marsh et al. (2011, p.286) describe value-added as being ‘based on some problematic statistical assumptions’, having large standard errors, as ‘not particularly reliable or stable over time’, ‘not particularly useful for formative purposes of improving effectiveness’ and yielding ‘fragile’ causal inferences.
An important part of the task of evaluating the validity of value-added, therefore, is to understand how these profound differences of view arise. Do these highly conflicting positions reflect differences in the nature of value-added evidence considered, differences in use, differences in interpretations, methodological assumptions or some other factor? It is remarkable that, despite engaging in a series of debates - in person and through numerous publications - Gorard and prominent educational effectiveness researchers have essentially agreed to disagree and mutually accuse one another of making basic statistical errors (Reynolds et al., 2012). As has been noted, these differences arise from inspection of the same evidence. It does not seem likely that further empirical evidence (such as that presented in this thesis) will be sufficient to resolve these differences to any significant degree. As a result, part of the answer to the question of validity is held to be theoretical and philosophical in nature. It is therefore of great value to examine and evaluate the methodological assumptions surrounding the use of value-added and explore the source of these differences. This philosophical aspect of the problem is reflected in chapters such as Chapter 2, which
considers the development and design of value-added measures, and Chapter 4 which scrutinises the logic of value-added through reviewing and evaluating how different researchers have interpreted value-added evidence. These aspects of the thesis complement the empirical evidence which is reviewed in Chapter 4 and the original evidence presented in Chapter 6. This empirical evidence advances understanding of the properties and threats to validity in value-added evidence but it requires a thorough consideration of the difficulties of interpretation in order to make use of it to enhance our understanding of the validity of value-added.
In summary, the debates outlined above suggest that the validity of value-added measures is a current, valuable and open question for study. Much of the available evidence reviewed has been evidence of reliability or consistency rather than direct validity evidence. This advances our understanding but is not sufficient to address the question of validity. As a result, as well as presenting new empirical evidence, this research brings both philosophical and technical understanding to bear on the question of the validity of value-added and in doing so is able to offer an original and productive contribution to the debate.
1.4 Summary of Chapters
1.4.1 Chapter Aims and Overview
A summary of the main purpose of each chapter, the key points covered and the key content is given in Table 1.4.1a, below:
Table 1.4.1a – Chapter Content Summary
Chapter 2 – The Aims and Designs of Value-Added Measures
Chapter 2 examines the motivations for the development of value-added measures. It serves as an introduction to the value-added method and the distinctions between value-added measures and value-added evidence drawn on in Chapter 3 and 4.
Introduces what value-added measures are in general terms, detailing the origins of the term value-added in education and distinguishes this from other uses.
Describes a range of statistical approaches which could be characterised as using the value-added method, giving details of various outputs which can be obtained to produce what is referred to in the thesis as ‘value-added evidence’.
Highlights several variations on and extensions to the value-added models introduced. Chapter 3 – Value-Added in Research, Policy and Practice
This section reviews the current use of value-added in educational effectiveness research, English policy and English practice. This draws on the technical details presented in Chapter 2 to discuss the application of the value-added method in each area of use. The chapter provides the foundations for future chapters such as the discussion chapter which explores the implications of the results presented in this thesis in relation to how it is currently used. Conducts a survey of the use of the value-added method between January 2013 and
mid-April 2015 in two educational effectiveness journals.
Gives examples of the research use of value-added, drawing on the information given in Chapter 2 and the methodological survey of educational effectiveness research (above). Describes the development of an English value-added measure as a national performance measure and the political climate in which this took place. Including an introduction to the forthcoming English ‘Progress’ value-added measures.
Describes the use of value-added in school practice in England, considering attitudes to data and its use and what is considered to be best practice for using value-added evidence.
Chapter 4 – The Validity of School Value-Added Measures
This chapter is the key thesis literature review. It reviews the existing evidence base to which the results presented in this thesis are designed to contribute. This is organised into two main sections:
First, a review of methodological study of school value-added, organised around a number of threats to validity and methodological issues which impinge on validity. Second, a section which examines the interpretation of value-added evidence. Key
debates around interpretation and uncertainty are reviewed and evaluated.
There is a final section in this chapter which is somewhat separate to main review sections before it and relates to alternative measures of school effectiveness. This section introduces the regression discontinuity design and reviews its use for estimating school effects. This section provides the groundwork for one of the empirical studies in this thesis which compares estimates of school effectiveness produced using a value-added design with estimates from the quasi-experimental regression discontinuity design
Chapter 5 – Methods
The methods chapter provides crucial information for the empirical results in the next chapter. It is designed as an overview for the four studies rather than a detailed description of the analyses to follow. Detailed description of the analytical approaches are contained within the results chapter along with the actual results; descriptive statistics and equations for the statistical models used are placed in an appendix unless these are the main object of analysis. The key content within the methods chapter is as follows:
A statement of the core research question, followed by the primary research questions in each study (see below) designed to address it.
Description of the analytical approach taken within and across the four studies An introduction to the key data sources used in this thesis.
An overview of each of the four empirical studies, further details of the research questions and of the specific data and sample used to address them.
Chapter 6 – Results
The results chapter follows a question and answer format. The research questions are organised into four studies (see below). Each research question is presented along with a) an explanation of how the question relates to existing evidence (Chapter 4) and the core research question, b) details of the analytical steps taken to address the question and c) the results of the empirical analysis undertaken to address the research question. The four studies are as follows:
Study 1 - Bias and Error, which examines sources of observable bias and error, primarily using the official English value-added measure;
Study 2 - Inter-Method Reliability, which compares estimates produced using value-added with estimates produced using a regression discontinuity design;
Study 3 - Stability over Time, where the stability of English value-added measures over a number of years is examined; and
Study 4 - Cohort Consistency, which examines the consistency of estimates for different cohorts within a school at a single point in time.
Each of these studies is designed to update, extend and/or advance what is known about the properties and validity of value-added measures. Some of these analyses replicate previous results, some address specific issues raised in the review of validity evidence by extending or adapting previous studies and others adopt a relatively novel approach, conducting original analyses or examining issues where there is very little existing evidence.
All the results are all based on analysis of two sources of data:
First, extracts from the National Pupil Database. These extracts cover 2004 to 2014 and contain data at pupil-level and school-level across the pupil age range for most but not all of these years.
The second source of data is from a large Department for Education commissioned study known as ‘Making Good Progress’. This nationally representative dataset contains teacher-assessed data for pupils aged 7 to 13. This second dataset is used where measures of pupil performance between English Key Stage years are required.
Chapter 7 – Discussion
The discussion chapter has two main parts, each addressing a specific aim. The first aim is to discuss evidence pertaining to the core research question: ‘Are school value-added measures valid measures of school effectiveness?’ This involves synthesising the results presented in the Chapter 6 and discussing how the findings fit within the pre-existing evidence that was reviewed in Chapter 4.
The second aim of the discussion chapter is to consider the results alongside the various areas of use reviewed in Chapter 3. This draws on a conception of measurement validity in relation to interpretation and use (Kane, 2013); this conception is adapted to the specific context of value-added by outlining a theoretical framework of important considerations for interpreting value-added evidence. Then, a series of sections discuss specific uses within policy, practice and research, according to the extent to which the findings have implications for these. In each area, specific issues are discussed, drawing on the theoretical framework advanced in the chapter. This section also draws on the discussions of interpretation and uncertainty in Chapter 4, considering their implications for various areas of use.
Chapter 8 – Summary and Conclusions
This final chapter summarises the problems examined and the contribution of the thesis to the issues and questions identified. This includes the following:
A summary of the main question addressed in the thesis and the approach taken to addressing it.
Discussion of the limitations of the study and the questions which remain unanswered. This considers limitations stemming from the scope and focus of the study as well as limitations of the methods and data used.
A list of the ‘headline’ empirical results from the 4 empirical studies and a summary answer to the core research question on the validity of school value-added measures. A number of recommendations and comments, first in general and then for the specific
areas of use which have been reviewed.
2.
The Aims and Designs of
Value-Added Measures
2.1 Chapter Introduction
This chapter describes how value-added measures came about, the motivations for their development and what they are in in both conceptual and technical terms. In doing this, the chapter provides foundational material for the following two review chapters.
The first section, Value-Added and the School Effect (Section 2.2), describes the essential logic of value-added and the origins and problems associated with its particular operational interpretation and the term itself. This serves as a non-technical introduction to the concept and an initial exploration of the issues raised by this particular construal of school performance. The final section, Value-Added Model Designs (Section 2.3), introduces a range of statistical approaches based on the added method which can produce value-added measures and other outputs which are referred to here as ‘value-value-added evidence’.
2.2 Value-Added and the School Effect
2.2.1 The Value and Problems of Educational Measurement
Measurement is a cornerstone of physical science. The ability to measure temperature, length, weight, volume and many other physical phenomena are some of the most important achievements in human scientific progress (see for example Chang, 2004). Similarly, social scientists, politicians, managers and employees of social institutions have sought to measure important aspects of the social world. There is a widespread view that measurement has an important role in the operation and improvement of social institutions and programmes:
"...in the past year I have been struck again and again by how important measurement is to improving the human condition. You can achieve amazing progress if you set a clear goal and find a measure that will drive progress toward that goal..."
Social measurement is not without its difficulties. Social phenomena of interest are often social or psychological constructs and may not be directly observable in the way many objects of study in physical science are. Some of the most significant concerns of social policy – poverty, academic achievement, wellbeing – are difficult to define and capture in a verifiable, objective measure. A common difficulty is that social data almost invariably have some degree of measurement error, missing cases, unobserved influences, unexplained variation and issues with defining and observing the object of measurement. Educational data are no exception to this (Gorard, 2010, Koretz, 2008) and the value and use of external tests of achievement has been a longstanding and contentious issue (Stobart, 2008).
Despite these difficulties, measures and indicators are key to the functioning of many organisations, allowing resources to be directed where needed and progress towards goals evaluated. Data are generally held to be of value to individual professionals to inform and improve their practice and are widely used in England (Kelly et al., 2010).
2.2.2 The Aim of Value-Added
A problem with the use of unadjusted examination scores – ‘raw scores’ - as a measure of school performance is that examination results are thought to be the joint outcome of numerous, interacting factors, of which the school is just one. The main ‘inputs’ into the ‘production’ of learning, the pupils themselves, are shaped by many factors which the school cannot, or can only partially, influence such as socio-economic background (e.g. Easen and Bolden, 2005), family effects (Rasbash et al., 2010), prior attainment (Ray, 2006), genetic influences (Haworth et al., 2011), pupil relative age (Crawford et al., 2007), parental engagement (Harris and Goodall, 2008), pupil motivations and self-beliefs (Stankov and Lee, 2014) and myriad other factors impacting on life experiences of pupils (see for examples Sammons, 2014).
When considering school effectiveness, these factors are commonly known as ‘school factors’ (e.g. Saunders, 1999) or as ‘external’ factors (e.g. Meyer, 1997). These non-school factors bias raw examination results for use as a measure of non-school performance. The question is whether the effect of the school can be isolated in some way from these non-school factors. If achieved, the result could be considered a measure of non-school performance, independent of the intake and the external circumstances of the school and therefore a fair basis for comparison of school performance. If the influences of non-school factors are not
sufficiently eliminated from the measure, however, scores are likely to reflect differences in intake (Morris, 2015) rather than school performance.
Value-added measures are a particular approach to solving this problem. Their primary aim is to compare school performance independently of context and so identify more or less effective schools and practices despite differences in pupil intake (Teddlie and Reynolds, 2000). In other words, the aim of value-added is to ‘level the playing field’ when comparing school performances (Nor, 2014, p.77). This is a difficult task and requires several assumptions and simplifications which many would consider problematic. Nevertheless, the value-added method is a plausible attempt at capturing the independent effect of schools and there is a clear benefit should this be achieved. A measure which manages to isolate the effect of schools from other non-school factors has a special claim to the promotion of educational goals: The measure would be directly linked with measured outcomes (unlike lesson observations) and it would allow fair comparison of the performance of schools (unlike raw examination scores), allowing high and low performers in a given context to be identified and direct resources and actions accordingly. This twofold claim is central to the potential value of school effectiveness measures as policy tools. The value-added measure is also of vital importance for school effectiveness researchers in identifying the policies and characteristics of schools which are associated with higher or lower pupil value-added performance.
2.2.3 Origins of the Term
‘
Value-Added
’
The term ‘value-added’ originates in economics (Goldstein and Spiegelhalter, 1996) where it is used for several purposes such as to refer to the value (sale price) of a product minus the cost of the raw materials and other inputs or as in the value-added tax (VAT), which is the percentage of a good’s base value to be added in tax (Saunders, 1999). Given these economic uses of the term, an intuitive notion of value-added in an educational context would be that it captures the effect of a school on educational outcomes over and above the effect of non-school factors. Unlike the economic examples, however, there is no satisfactory equivalent to the raw material costs which can be used as a baseline and subtracted from the total. Pupils are not rendered homogenous by subtracting their initial level of performance: unlike economic raw materials, pupils have (and continue to have) agency. Pupil’s progress is therefore attributable to the ongoing effects of pupil characteristics, behaviours (e.g. effort)
and other external factors (such as parental involvement) as well as the impact of schools (OECD, 2008).
Levels of attainment are consistently found to be associated with subsequent rates of progress, with pupils with higher initial attainment tending to make more progress (Ready, 2013), a tendency recognised and built into the initial designs for the English National Curriculum (TGAT, 1988). This means that a simple subtraction of baseline attainment will not be sufficient: the association between initial attainment and subsequent progress would predictably disadvantage schools whose pupils had lower average attainment levels on entry. This problem is not so evident in many of the economic uses of the term value-added, where there is clear ordering to and separation of the effects of various factors. This means that subtracting pre- from post-measures can meaningfully capture the effect of later factors. Although, even in the case of economic value-added, changes in external market conditions or factor prices can complicate the analysis.
The independent effect of the school in an absolute, economic sense (henceforth, ‘absolute value-added’) requires 1) a pre- and post-measure of performance on the same scale and 2) a way to separate the effect of the school from all non-school factors. There are many practical difficulties associated with the first requirement of obtaining a measure with sufficient continuity across different school year groups (see Cahan and Elbaz, 2000), especially when the measures span large age ranges. In England, for example, the key measures of performance at Key Stage 2 (age 11) and Key Stage 4 (age 16), while both are suitable measures of academic achievement, they are not on the same continuous scale. Subtracting the former from the latter to measure progress would be meaningless.
Regarding the latter requirement, there are two options: first, a design-based approach which uses a suitable comparison group of pupils who do not attend (any) school against which the performance of the comparable pupils who did attend can be judged. This would allow the absolute value-added of a school to be calculated. Ideally, this would involve a random allocation of pupils to schools. Clearly this is not feasible (Luyten et al., 2005). The second option is the model-based approach using statistical controls, where the gain score between pre- and post-measures of performance is regressed on measures of the differences in pupil intakes, in principle isolating the independent effect of the school. For this analysis to estimate an absolute school effect, comparable pupils not attending school at
all would be required so it is possible to estimate and control the effect of maturity and learning outside of school. Again, this latter requirement is clearly not feasible.
In sum, the absence of estimates from pupils who do not attend school and the lack of performance measures with meaningful continuity across time have meant that, in practice, it has generally proved unfeasible to calculate absolute value-added (but see Chapter 4, Section 4.4). We now move to consider how value-added has been understood and measured in education before commenting on how this departs from the general understanding of the term described above.
2.2.4 Adapting Value-Added to the Problem of School Effectiveness
While there are various understandings and formulations of value-added in education, the underpinning question which all have in common is, “How can pupil/student progress be measured in such a way as to throw light on the performance of institutions?” (Saunders, 1999, p.239). This, Saunders argues, is the “key to understanding the methodological principles of value added.” This aim does not strictly require solutions to the two practical problems in creating absolute value-added above. As a result, value-added in education has come to refer to a measure of relative performance rather than either the absolute value-added of schools or a measure of average absolute progress (Kelly and Downey, 2011b).The aim of the relative value-added measures used in education is to compare pupils’ performances on a statistically ‘like-for-like’ basis (SCAA, 1994, p.6). This comparison almost always takes at least pupils’ level of prior attainment into account as this variable captures large differences between pupils, typically accounting for around half of all variance in pupil performance (Teddlie and Reynolds, 2000, Thomas, 2001). Although the statistical models become more complex, the performance of pupils can be compared in this way to the mean performance for other pupils across a large range of statistical characteristics such as the level of prior attainment, gender, ethnicity, income, maternal educational level and so forth, assuming appropriate measures of these non-school factors can be obtained. The performance of statistically ‘like-for-like’ pupils (as captured within a statistical equation) can be used as a benchmark against which to compare pupils’ actual performances. Calculating the difference between pupils’ actual performances and this expected level of performance creates a measure of relative performance (i.e. performance
relative to other statistically similar pupils). This relative performance is now known as ‘value-added’.
It is important to emphasise that the school effect is not directly measured by value-added. The school effect is conceived as a latent variable revealed by statistically removing the predictable influence of all other explicable non-school factors. Strictly, value-added scores are merely capturing statistically unexplained differences in pupil performance. The causal attribution to the school rests on the assumption that all other appreciable non-school factors (i.e. omitted variable biases) have been ruled out (Marsh et al., 2011). Of course, there will be some level of measurement error and influence from unmeasured factors and so the estimated school effect can only ever be considered an approximation (Visscher, 2001).
It is worth commenting on the confusion caused by the shift in meaning between economic, absolute value-added (above) and this relative value-added measure used in education. Referring to the latter is somewhat a misnomer and a source of confusion for those not familiar with how the measure is produced (Goldstein, 1997, Coe and Fitz‐Gibbon, 1998, Luyten et al., 2005). This confusion continues with the forthcoming English value-added measures (see Chapter 3) as these are named ‘Progress’ measures, which is similarly problematic. What is referred to as value-added in education is relative and has a mean of approximately zero. It is not a measure of either progress or absolute value-added. The more progress a pupil with a given prior attainment makes, the higher his or her relative progress, so, in this sense, the measure can serve as a measure of progress. Nevertheless, this loose terminology combined with low understanding of the value-added method (Kelly and Downey, 2010) is highly likely to lead to misunderstandings. The potential for misunderstanding is implicitly recognised in the practice of the English Department for Education (DfE) of adding an arbitrary amount to the school value-added scores (100 at primary level or 1000 at secondary level). This is done due to concerns that a negative value-added score would imply that pupils have made negative progress (Ray, 2006), rather than performed less well relative to statistically similar pupils, as is the case. Rather than this being entirely superficial, the loose use of the term added to refer to relative value-added is likely to exacerbate the difficulties users have in understanding the measure. The name obscures what the measure is and makes it difficult, even intuitively, to understand, for examples, how one pupil can make more progress than another yet receive a lower