ISSN: 2088-8708, DOI: 10.11591/ijece.v9i6.pp5253-5262 5253
Optimization of discrete wavelet transform features using
artificial bee colony algorithm for texture image classification
Fthi M. Albkosh, Muhammad Suzuri Hitam, Wan Nural Jawahir Hj Wan Yussof, Abdul Aziz K. Abdul Hamid, Rozniza Ali
School of Informatics and Applied Mathematics, Univesiti Malyisa Terengganu, Kuala Nerus, Terengganu, Malaysia
Article Info ABSTRACT
Article history: Received Nov 15, 2018 Revised Apr 18, 2019 Accepted Jun 10, 2019
Selection of appropriate image texture properties is one of the major issues in texture classification. This paper presents an optimization technique for automatic selection of multi-scale discrete wavelet transform features using artificial bee colony algorithm for robust texture classification performance. In this paper, an artificial bee colony algorithm has been used to find the best combination of wavelet filters with the correct number of decomposition level in the discrete wavelet transform. The multi-layered perceptron neural network is employed as an image texture classifier. The proposed method tested on a high-resolution database of UMD texture. The texture classification results show that the proposed method could provide an automated approach for finding the best input parameters combination setting for discrete wavelet transform features that lead to the best classification accuracy performance.
Keywords:
Artificial bee colony algorithm Discrete wavelet transform multi-layer perceptron neural network
Texture classification
Copyright © 2019 Institute of Advanced Engineering and Science. All rights reserved. Corresponding Author:
Muhammad Suzuri Hitam,
School of Informatics and Applied Mathematics, Univesiti Malyisa Terengganu,
Universiti Malaysia, 21030 Kuala Terengganu, Terengganu, Malaysia. Email: suzuri@umt.edu.my
1. INTRODUCTION
Texture pattern plays an important role in image analysis and pattern recognition. Due to its wide variation of pattern, the development of an automated image texture analysis faces some challenges [1]. In general, the image texture analysis composed of three main issues; texture classification, texture segmentation and shape recovery from texture [2]. Texture classification is basically dealt with claasifying an image into any given set of texture classes based on texture pattern presented in the given image.Texture classification has diverse application area including remote sensing, medical image diagnosis and stone type application [3]. Texture analysis and classification technique can be categorized as statistical approaches, signal-processing based approaches and structural approaches. Even though statistical methods is one of the most popular methods for texture analysis and classification, they have a major drawback to address the spatial scale problem [1].Signal processing based method could deal with this problem in a much better form and the wavelets transform (WT) is one of these methods. WT can be categorized into discrete and continuous form. In continuous wavelet transform (CWT), the wavelet transformation changes continuously. Whereas, the discrete wavelet transform (DWT) decomposes the signal into multiresolution coefficients using high pass and low pass filters [4]. The main advantages of wavelets are that are adapted to the transients of each scale and provide a multi-resolution and non-redundant representation of signals [5]. There are many previous research works recommended to solve texture classification problem based on DWT. WT has the ability to decompose complex information into elementary forms and can cover the frequency domain more accurate as compared to other transform methods such as Gabor Filtering (GF) approach [6, 7]. Vidya et al. [8] compared the performance of computer aided diagnosis approach using
DWT features, grey level co-occurrence matrix (GLCM) and higher-order spectra (HOS) texture descriptors while support vector machine (SVM) is used as a texture classifier. Their texture classification results showed that the superiority of DWT based approach as compared to others.
The main problem in this approach is that the researchers have to manually find out the best combination of DWT parameters for optimum image texture classification results, i.e. wavelet decomposition filter and the number of wavelet decomposition [9]. Therefore, to reduce the tedious and time consuming trial and observation method of finding the optimum setting, this paper introduces an automated approach for binary texture classification where the artificial bee colony (ABC) algorithm [10] is employed to find the best combination of wavelet filters and decomposition levels for a given problem.
2. RELATED WORKS
In signal processing based texture analysis methods, the image is typically filtered with a bank of filters of differing scales and orientations in order to capture the changes between specific frequency bands in the analyzed image [11]. The wavelet transform (WT) is performed on the frequency domain of the images that characterizes multiscale frequency content called wavelet coefficients at each spatial location of an image. The discriminative power of texture descriptors can be significantly improved if different scales are considered among the images during the descriptor extraction [1]. The basic idea of multi-resolution analysis is to represent an image on several sub-images, from coarse to fine resolution, and analyze them in the respective domain. DWT have been successfully implemented in many applications in textures classification. A wavelet-based soil texture feature extraction method had been introduced by Zhang et al. [12] and successfully applied to soil texture classification system. A maximum likelihood classifier is used for classification, which shows good results based on the wavelet texture features. Rajpoot and Rajpoot [13] produced promising results of texture classification by using Daubechies filters and a 3 level DWT decomposition with SVM classifier. Sidhu and Raahemifar [14] investigated the wavelet transform and SVM classifier for texture classification. By applying the proposed method, they obtained good classification results based on the Brodatz texture database. Singh et al. [15] used a Haar wavelet transform and multi-layered perceptron neural network (MLPNN) for texture image classification. The experiment results showed that the accuracy of classification is in the range between 86.2% to 99.06% based on the selected samples. Jayasudha and Pugazhenthi [16] applying DWT for color textures classification using K-nearest neighbor (KNN) classifier. The proposed system achieved 85.83% classification accuracy at the first level of decomposition using VisTex database.
Among the main parameters that affect DWT classification performances are the type of wavelet decomposition filter and the number of wavelet decomposition [9, 17]. Mojsilović et al. [17] investigated whether the properties of decomposition wavelet filters play an important role in texture description. They performed classification experiments using Brodatz textures. The experimental results indicated that the selection of the decomposition filter has a significant influence on the result of texture characterization. Busch and Boles [18] compared the response both the Haar and Biorthogonal wavelets using Brodatz album in textures classification. The experimental results indicated that both wavelets produce a similar response in most cases at the first level of detail, however, are generally different at the second level. The results show that the classification accuracies are 88% and 87% by Haar and Biorthogonal wavelets, respectively and producing 95% classification accuracy by the combination of Haar and Biorthogonal wavelets. Hiremath and Shivashankar [9] investigated the effect of using different filters on the textures classification using Brodatz textures and different wavelet filter banks i.e., Haar, Daubechies (db2, db3, db4, db6, db8, db10, db16), biorthogonal (bior2.2, bior3.3, bior4.4, bior5.5) wavelet filters and also the Gabor features. The experimental results demonstrated that the best classification result was at 96.84% classification accuracy achieved by Haar wavelet. Based on these reviews of DWT parameters selection and its importance that affect the total classification accuracy, it can be concluded that some specific wavelet parameters need to be optimally tuned to achieve the best classification performance.
Optimization technique is a way to find the most cost effective, highest performance system under a given constraints. By maximizing desired factors and minimizing the undesired ones. Artificial bee colony algorithm is a stochastic, nature-inspired, swarm intelligent algorithm proposed by Karaboga [19] which mimics the foraging behavior of honeybees and used for solving optimization problems [20]. ABC algorithm is a more recent global optimization algorithm that has been successfully employed to solve various type of optimization problems in various field of study. Atasever et al. [10] compared the performance of a few evolutionary computation algorithms and found out that the ABC algorithms perform better than other artificial intelligence tools. Shanthi and Bhaskaran [21] compared the performance of modified ABC algorithm with particle swarm optimization (PSO) and genetic algorithm (GA) for feature selection technique to select the predominant feature set of breast lesion in mammogram images. They reported that the ABC
algorithm managed to select only 42 features as compared to 50 and 56 features obtained by GA and PSO, respectively while maintains the high accuracy of classification. Li and Li [22] applied multi-objective ABC algorithm to camellia fruit recognition system in a fruit picking robot. Their approach used eight characteristic parameters of the color feature, the morphology feature and the texture feature as the preference region to camellia fruit recognition. In another research, Banerjee et al. [23] proposed to use ABC algorithm to solve the land-cover problem by image classification.
Based on the review of the ABC algorithm and its success to produce impressive results in some of the applications as well as based on the limitations of the DWT method, this paper proposed to use ABC algorithm to optimize the selection of parameters of DWT for binary texture classification.
3. RESEARCH METHOD
The proposed method used in this study consists of three main components; feature extraction using DWT method, classifying texture using MLPNN and ABC algorithm is used to automatically find the most suitable combination of wavelet filters and decomposition level for achieving the most accurate classification results.
3.1. Discrete wavelet transform
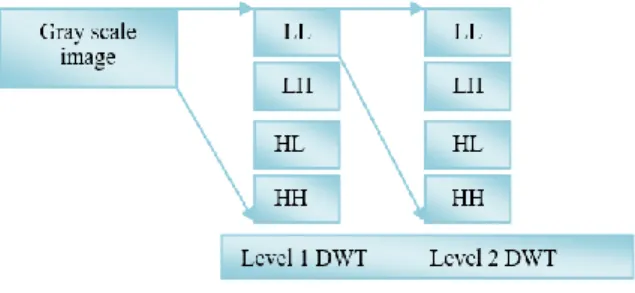
DWT is decomposed an image into four sub-bands. These sub-bands are marked as approximation coefficient (LL) which is the original image at lower resolution and three high frequency sub-bands corresponding to horizontal (HL) which highlights the horizontal edges of the original image, vertical (LH) which highlights the vertical edges and diagonal details (HH) which highlights the diagonal edges [24]. Once the image is divided into sub-band, any number of features can be extracted from the transformed image.The LL image keeps most details and it is used to produce the following level of decomposition as shown in Figure 1.
Figure 1. Wavelet decomposition of an image
The following texture features were then computed for decided resolution level of the wavelet details; mean standard deviation, energy and entropy. The mean value can be mathematically defined as follows: 𝑀𝑒𝑎𝑛 = 1 𝑅𝑆∑ ∑ 𝑥𝑠𝑓(𝑟, 𝑠) 𝑆−1 𝑠=0 𝑅−1 𝑟=0 (1)
While the standard deviation (STD) can be computed by using the following equation:
STD = √∑ ∑ (𝑓(𝑟, 𝑠) − 𝑚𝑒𝑎𝑛) 2 𝑆−1 𝑠=0 𝑅−1 𝑟=0 R × S (2)
where f(r, s) is the value of the pixel in this position for any sub-band of size R × S
On the other hand, the wavelet entropy and energy were computed using the following definition:
Entropy = ∑ ∑ 𝑝(𝑖, 𝑗)𝑙𝑜𝑔(𝑝(𝑖, 𝑗)) 𝑁 𝑗=1 𝑀 𝑖=1 (3)
where M and N are the dimensions of the coefficient matrix. Energy = ∑ ∑ 𝑝(𝑖, 𝑗)2 𝑁𝑔−1 𝑗=0 𝑁𝑔−1 𝑖=0 (4)
and N is the width of the channel and i and j are the rows and columns of the channel. 3.2. Artificial neural network classifier
The Multi-layer Perceptron Neural Network (MLPNN) is perhaps the most popular neural network that has been used for classification requirements [25]. MLPNN is a set of connected input/output units in which each connection has a weight associated with it. During the learning phase, the network learns by adjusting the weights, so as to be able to predict the correct class label of the input tuples. Neural network learning is also referred to as connectionist learning due to the connections between units. It gives the required output for a particular input.
3.3. K-fold cross validation
Cross-validation is a statistical technique which involves partitioning the data into subsets, training the data on a subset and use the other subset to evaluate the model’s performance. One of the common type of cross validation that is widely used is k-fold cross validation technique [26]. In a k-fold cross-validation algorithm, a sample set is divided into k subsets of equal size. The network will be trained k times, each time leaving out one of the subsets from training and consider it for testing. The average of k results from the folds give the test accuracy of the algorithm.
3.4. Artificial bee colony (ABC)
Generally, the artificial bee colony as introduced by by Karaboga [18] can be described as follows: The General Aspects
In the ABC algorithm, each food source position represents a solution to a specific problem and the amount of nectar in a food source represents the objective function (the fitness) of the solution. In the hive, three types of bees are considered: employed bees, onlooker bees and scout bees. The ABC algorithm consists of a number of cycles. During each cycle, there are three main parts: sending the employed bees to the food sources and measuring their nectar quantities; selecting the food sources by the onlookers; determining the scout bees and exploring new possible food sources [27]. A general algorithm for the ABC optimization approach [28] can be expressed as follows:
1. Initialize food source positions Repeat
2. Sending employed bees to food source positions and calculating the probability values. 3. Selection of food source positions by onlooker bees by considering the probability values.
4. Abandoning sources with less probability and producing new food source in neighbourhood of old source. 5. The best food source found so far is registered
Until (requirements are met)
4. TEXTURE CLASSIFICATION
This paper focuses on a binary texture classification and the University of Maryland, College Park image textured database (UMD database) has been employed. The texture classification process consists of three main stages: image texture preparation, feature extraction and classification.
4.1. Image texture preparation
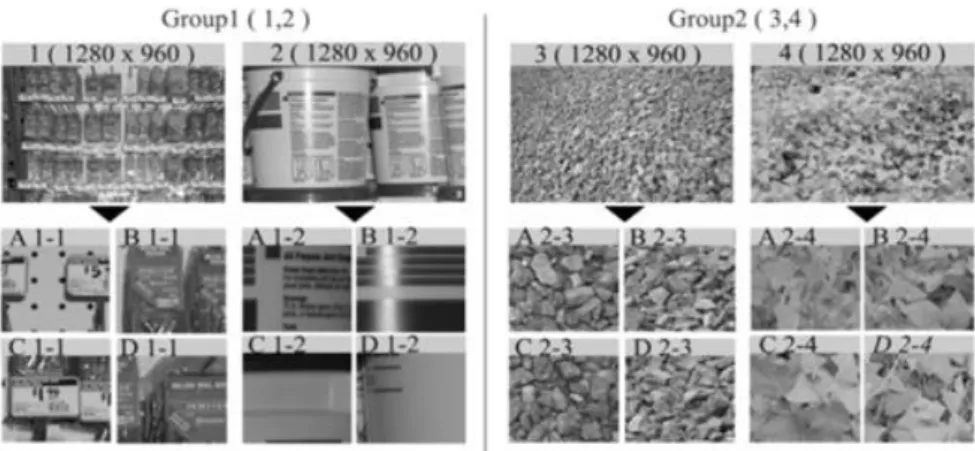
Image texture preparation is the stage where UMD textured image database is prepared, in order to get a sufficient number of image samples with required diversity. UMD textured image database contains 25 groups; each group contains 40 samples with size 1280×960 pixels. Each image sample from the UMD database with size 1280 ×960 pixel were subsequently segmented into 80 samples, where 70 samples with size 128×128 and 10 samples with the size 128×64. In this paper, we use the samples with size 128×128, and ignore the size 128×64. At the end of this step, we obtained 2800 images from the same sample with size 128×128. Thus the total number of test images from 25 samples are 70,000 images.A total of 500 texture images were randomly selected from the 2800 images. Lastly binary image texture group is established from different image group. Each binary group contains 1000 textures images where two samples for each group of 500 images were randomly selected. Some samples of the image texture preparation process of the binary image group is illustrated in Figure 2.
Figure 2. Sample images of different binary image classes
4.2. Features extraction and classification
Feature extraction is the second major stage of this study. At this stage, relevant image features were extracted from the image texture to make it ready for classification process. We use the ABC algorithm to find the suitable combination of DWT decomposition level and the best filter of DWT. The final stage in this study is the classification methods. In this paper, the MLPNN updates its weights through back-propagation learning algorithm. It uses the generalized least mean square (LMS) rule and employs the gradient search learning method to reduce the average difference between the output and the target value on the neural network, 40 neurons in the hidden layers is used. A hyperbolic tangent and linear activation functions were used in the hidden and output layer, respectively. To evaluate the classifier performance, a 5-fold cross validation strategy is applied where 200 images used for testing whereas the remaining 800 images were used for training.
After applying any filter with specific decomposition level, the following texture descriptors were calculated for particular resolution level of the wavelet: mean, standard deviation, energy and entropy. The energy for the approximation sub-band and the mean of energy for the details sub-band are utilized. Entropy, mean and standard deviation are calculated for each sub-band (approximation, detail regions) of best decomposition level. By that it yields a total of 14 descriptors.
4.3. Optimization of DWT parameters
Designing of DWT depends on some parameters such as wavelet decomposition filter for analysis and number of wavelet decomposition. The proposed algorithm is developed for determining the most efficient filter out of 49 different wavelet filters, in addition to choosing the most appropriate wavelet decomposition filter from eight decomposition filter. Table 1 show the filters used.
a. Implementation of ABC Algorithm to Optimize DWT
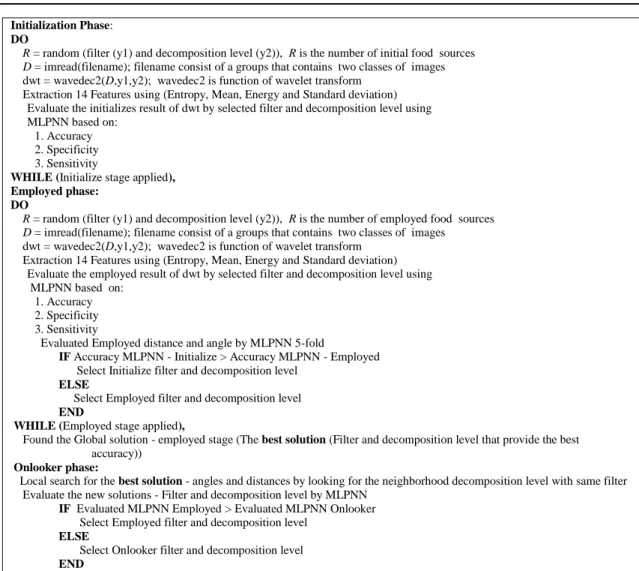
In this work, the positions of foods sources in ABC algorithm are considered as the parameters of DWT that can provide specific solutions. For instance, the parameters that are been considered for the DWT are filter type and its decomposition level. The parameters were modified with the time by finding out some places with high nectars as stated in ABC algorithm. Here, the high amount of the nectar is considered as the high accuracy in binary textures classification. The pseudo code of the ABC algorithm to optimize the DWT parameters to get the maximum accuracy of binary textures classification is illustratedin Figure 3.
Table 1. Different wavelet filters used Wavelet Families Wavelets
Haar wavelet 'haar'
Daubechies ‘db1’, ‘db2’, ‘db3’, ‘db4’, ‘db5’, ‘db6’, ‘db7’, ‘db8’, ‘db9’ Coiflets '‘coif1’, ‘coif2’ , ‘coif3’ , ‘coif4’,‘coif5’
Symlets ‘sym1’, sym2 , sym3, sym4, sym5, sym6, ‘sym7’ Discrete Meyer 'dmey'
Biorthogonal ‘bior1.1’, ‘bior1.3’, ‘bior1.5’,‘bior2.2’, ‘bior2.4’, ‘bior2.6’, ‘bior2.8’,‘bior3.1’, ‘bior3.3’, ‘bior3.5’, ‘ bior3.7’, ‘bior3.9’, ‘bior4.4’
Reverse Biorthogonal 'rbio1.1', 'rbio1.3', 'rbio1.5',
Initialization Phase: DO
R = random (filter (y1) and decomposition level (y2)), R is the number of initial food sources D = imread(filename); filename consist of a groups that contains two classes of images dwt = wavedec2(D,y1,y2); wavedec2 is function of wavelet transform
Extraction 14 Features using (Entropy, Mean, Energy and Standard deviation) Evaluate the initializes result of dwt by selected filter and decomposition level using MLPNN based on:
1. Accuracy 2. Specificity 3. Sensitivity
WHILE (Initialize stage applied), Employed phase:
DO
R = random (filter (y1) and decomposition level (y2)), R is the number of employed food sources D = imread(filename); filename consist of a groups that contains two classes of images
dwt = wavedec2(D,y1,y2); wavedec2 is function of wavelet transform Extraction 14 Features using (Entropy, Mean, Energy and Standard deviation)
Evaluate the employed result of dwt by selected filter and decomposition level using MLPNN based on:
1. Accuracy 2. Specificity 3. Sensitivity
Evaluated Employed distance and angle by MLPNN 5-fold
IF Accuracy MLPNN - Initialize > Accuracy MLPNN - Employed Select Initialize filter and decomposition level
ELSE
Select Employed filter and decomposition level END
WHILE (Employed stage applied),
Found the Global solution - employed stage (The best solution (Filter and decomposition level that provide the best accuracy))
Onlooker phase:
Local search for the best solution - angles and distances by looking for the neighborhood decomposition level with same filter Evaluate the new solutions - Filter and decomposition level by MLPNN
IF Evaluated MLPNN Employed > Evaluated MLPNN Onlooker Select Employed filter and decomposition level
ELSE
Select Onlooker filter and decomposition level END
Memorize the optimal filter and decomposition level
Figure 3. The pseudo code of ADWT
b. Performance Measures
The accuracy is measured using following parameters: Confusion Matrix:
The confusion matrix shows the percentages of correct and incorrect classifications. It includes four classification performance indices: true positive (TP), false positive(FP), false negative(FN), and true negative (TN) [29].
1) Sensitivity and Specificity
Sensitivity and specificity are a measure of texture classification accuracy and probability that a texture classification technique will incorrectly reject or accept an input as a negative or positive class. Sensitivity, SN, it is the proportions of correct classification from first class. SN value is computed as follows:
SN = TruePositive
TruePositive+FalseNegative (9)
Specificity, SP is the proportions of correct classification from the second class. SP is computed as follows: SP= TrueNegative
(FalsePositive+TrueNegative) (10)
2) Accuracy:
Accuracy, Acc is the global representation of classifier performance and is defined as follows: SP= TrueNegative
5. RESULTS AND DISCUSSION
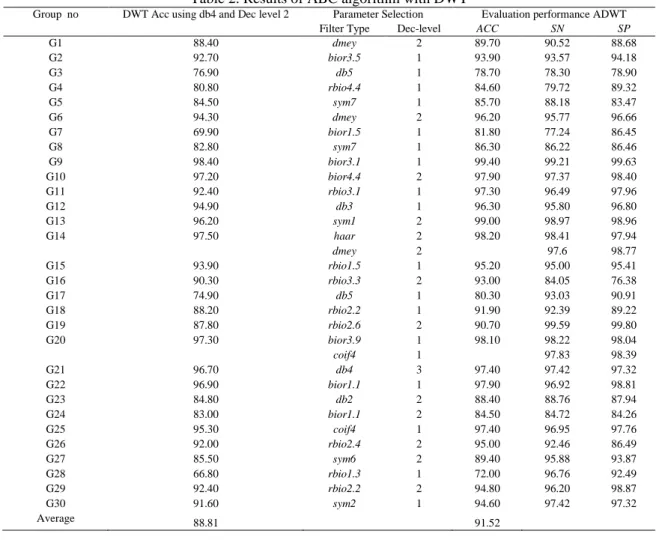
Results of DWT and ADWT methods are shown in Table 2. It shows that the MLPNN classifier achieved different accuracy, sensitivity and specificity. The results obtained clearly shown that different parameters are able to pick up minute changes in the images classification evaluation. The average accuracy of each group is compared with the average accuracy by using DWT with db4 and decomposition of level two.
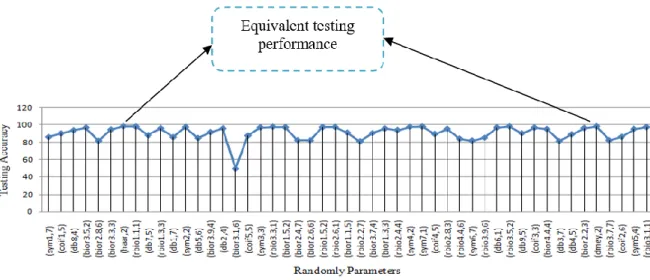
Figure 4 illustrates the relation between parameters which are filter type with decomposition level and the performance for the group number 14. The horinzontal axis, x represents random distribution of parameters and the vertical axis, y represents the performance of each parameter. As can be observed from the graph in Figure 4, almost different filters with different decomposition levels give different testing classification performances. Based on the best testing accuracy and using artificial bee colony, all gradation of testing accuracy from 49.5% for bior3.1 filter with decomposition level 6 until 98.20 % for haar and dmey filters and decomposition level 2 for each
ADWT obtained the highest rate of accuracy recorded with parameter bior3.1 filter and at decomposition level 1 with maximum accuracy of 99.40% for the group number 9. While the other 29 groups databases recorded their highest accuracy variations at different parameters.
The parameter values replaces the accuracy of the output based on the given textures group.
a. For some texture groups, sometimes the algorithm provide multi parameter values with equivalent testing performance similar to G14 to get two parameter values which are haar and dmey and decomposition level 2 for each, with testing performance 98.20% as can observed in Figure 4.
b. Some texture types which get different performance and same parameter values of filter and decomposition level (G1 and G6) obtained the best parameter values (dmey filter and decomposition level 2) with the higher testing performance 89.70% and 96.20%, respectively.
The behavior of the algorithms varies over different groups as the characteristics of the texture images differ. This is also affected by the details included in the images and the clarity in quality and the repeating or random pattern textures distribution.
Table 2. Results of ABC algorithm with DWT
Group no DWT Acc using db4 and Dec level 2 Parameter Selection Evaluation performance ADWT
Filter Type Dec-level ACC SN SP
G1 88.40 dmey 2 89.70 90.52 88.68 G2 92.70 bior3.5 1 93.90 93.57 94.18 G3 76.90 db5 1 78.70 78.30 78.90 G4 80.80 rbio4.4 1 84.60 79.72 89.32 G5 84.50 sym7 1 85.70 88.18 83.47 G6 94.30 dmey 2 96.20 95.77 96.66 G7 69.90 bior1.5 1 81.80 77.24 86.45 G8 82.80 sym7 1 86.30 86.22 86.46 G9 98.40 bior3.1 1 99.40 99.21 99.63 G10 97.20 bior4.4 2 97.90 97.37 98.40 G11 92.40 rbio3.1 1 97.30 96.49 97.96 G12 94.90 db3 1 96.30 95.80 96.80 G13 96.20 sym1 2 99.00 98.97 98.96 G14 97.50 haar 2 98.20 98.41 97.94 dmey 2 97.6 98.77 G15 93.90 rbio1.5 1 95.20 95.00 95.41 G16 90.30 rbio3.3 2 93.00 84.05 76.38 G17 74.90 db5 1 80.30 93.03 90.91 G18 88.20 rbio2.2 1 91.90 92.39 89.22 G19 87.80 rbio2.6 2 90.70 99.59 99.80 G20 97.30 bior3.9 1 98.10 98.22 98.04 coif4 1 97.83 98.39 G21 96.70 db4 3 97.40 97.42 97.32 G22 96.90 bior1.1 1 97.90 96.92 98.81 G23 84.80 db2 2 88.40 88.76 87.94 G24 83.00 bior1.1 2 84.50 84.72 84.26 G25 95.30 coif4 1 97.40 96.95 97.76 G26 92.00 rbio2.4 2 95.00 92.46 86.49 G27 85.50 sym6 2 89.40 95.88 93.87 G28 66.80 rbio1.3 1 72.00 96.76 92.49 G29 92.40 rbio2.2 2 94.80 96.20 98.87 G30 91.60 sym2 1 94.60 97.42 97.32 Average 88.81 91.52
Figure 4. Classification accuracy for image Group 14
Based on the sensitivity and specificity performance measure, it can be concluded as follows:
a. Group 1 (Screws, Buckets). ADWT with parameter dmey filter with decomposition level 2 provides accuracy of 89.70%. At the same time and for the same group, the sensitivity and specificity obtained was 90.52% and 88.68%, respectively. This means the accuracy is increased in class one (Screws) of the group and decreased with the class two (Buckets).
b. Group 6 (Trees and leaves). ADWT with parameter dmey filter and decomposition level 2, give accuracy of 96.20%. The sensitivity and specificity of was 95.77% and 96.66%, respectively.
c. Group 7 (leaves1 and leaves2). ADWT with parameter bior1.5 filter and decomposition level 1 provide accuracy of 81.80%. The sensitivity and specificity of ADWT obtained is 77.24% and 86.45%, respectively.
Lastly, all the graphs of the experiment results showed that a variable curve when accuracy values were plotted against parameter values. It should be highlighted that ADWT automatically select the best combination of parameters to get maximum classification accuracy. From Table 2, it can be seen that the proposed ADWT model, which is an optimization of the DWT parameters using ABC algorithm, has a more accurate calssıfıcatıon performance which achieved an average accuracy of 91.52% when compared against 30 groups from UMD database. It is better than the average accuracy of the same 30 groups with db4 filter and decomposition level 2 when using DWT which obtained 88.81% classification accuracy.
6. CONCLUSION
Classifying the textures classes is one of the recent research issues in the field of image processing. The classification accuracy can be improved if the feature selection is proper. The best DWT performance achieved after a series of optimization on the suitable selection of wavelet filter and decomposition functions involved. This paper shows that automatic selection of DWT parameters could be achieved by using ABC optimization algorithm for binary texture image classification. The tedious trial and error process of parameter selection for finding the best parameter combination has been avoided where ABC optimization algorithm will choose the optimal parameters for the binary texture classification. Future challenges would be implementing the similar process for multiple class image texture classification.
REFERENCES
[1] F. R. de Siqueira, W. R. Schwartz, and H. Pedrini, "Multi-scale gray level co-occurrence matrices for texture description," Neurocomputing, vol. 120, pp. 336-345, 2013.
[2] S. Arivazhagan and L. Ganesan, "Texture segmentation using wavelet transform," Pattern Recognition Letters, vol. 24, pp. 3197-3203, 2003.
[3] G. Murthy and T. Veerraju, "A novel approach based on decreased dimension and reduced gray level range matrix features for stone texture classification," International Journal of Electrical and Computer Engineering, vol. 7, pp. 2502, 2017.
[4] J. Too, A. Abdullah, N. Mohd Saad, N. Mohd Ali, and H. Musa, "A detail study of wavelet families for EMG pattern recognition," International Journal of Electrical and Computer Engineering, vol. 8, pp. 4221-4229, 2018.
[5] E. Avci, I. Turkoglu, and M. Poyraz, "Intelligent target recognition based on wavelet packet neural network," Expert Systems with Applications, vol. 29, pp. 175-182, 2005.
[6] J. A. R. Recio, L. A. R. Fernández, and A. Fernández-Sarriá, "Use of Gabor filters for texture classification of digital images," Física de la Tierra, vol. 17, p. 47, 2005.
[7] S. E. Grigorescu, N. Petkov, and P. Kruizinga, "Comparison of texture features based on Gabor filters," Image Processing, IEEE Transactions on, vol. 11, pp. 1160-1167, 2002.
[8] K. S. Vidya, E. Ng, U. R. Acharya, S. M. Chou, R. San Tan, and D. N. Ghista, "Computer-aided diagnosis of Myocardial Infarction using ultrasound images with DWT, GLCM and HOS methods: A comparative study," Computers in biology and medicine, vol. 62, pp. 86-93, 2015.
[9] P. Hiremath and S. Shivashankar, "Wavelet based co-occurrence histogram features for texture classification with an application to script identification in a document image," Pattern Recognition Letters, vol. 29, pp. 1182-1189, 2008.
[10] Ü. H. Atasever, C. Özkan, and F. Sunar, "The use of artificial intelligence optimization algorithms in unsupervised classification," ed: EARSeL, 2011.
[11] X. Liu and D. Wang, "Texture classification using spectral histograms," IEEE transactions on image processing, vol. 12, pp. 661-670, 2003.
[12] X. Zhang, N. H. Younan, and R. King, "Soil texture classification using wavelet transform and maximum likelihood approach," in Geoscience and Remote Sensing Symposium, 2003. IGARSS'03. Proceedings. 2003 IEEE International, pp. 2888-2890, 2003.
[13] K. M. Rajpoot and N. M. Rajpoot, "Wavelets and support vector machines for texture classification," in Multitopic Conference, 2004. Proceedings of INMIC 2004. 8th International, pp. 328-333, 2004.
[14] S. Sidhu and K. Raahemifar, "Texture classification using wavelet transform and support vector machines," in Electrical and Computer Engineering, Canadian Conference on, 2005, pp. 941-944, 2005.
[15] A. K. Singh, S. Tiwari, and V. Shukla, "Wavelet based multi class image classification using neural network," International Journal of Computer Applications, vol. 37, pp. 21-25, 2012.
[16] A. Jayasudha and D. Pugazhenthi, "Colour texture classification using wavelet transform from its gray scale," in Current Trends in Engineering and Technology (ICCTET), 2014 2nd International Conference on, pp. 376-379, 2014.
[17] A. Mojsilović, M. V. Popović, and D. M. Rackov, "On the selection of an optimal wavelet basis for texture characterization," Image Processing, IEEE Transactions on, vol. 9, pp. 2043-2050, 2000.
[18] A. Busch and W. W. Boles, "Texture classification using multiple wavelet analysis," in Proceedings of the Sixth Digital Image Computing: Techniques and Applications Conference, pp. 341-345, 2002.
[19] D. Karaboga, "An idea based on honey bee swarm for numerical optimization," Technical report-tr06, Erciyes university, engineering faculty, computer engineering department, 2005.
[20] D. Karaboga, B. Gorkemli, C. Ozturk, and N. Karaboga, "A comprehensive survey: artificial bee colony (ABC) algorithm and applications," Artificial Intelligence Review, vol. 42, pp. 21-57, 2014.
[21] S. Shanthi and V. M. Bhaskaran, "Modified artificial bee colony based feature selection: a new method in the application of mammogram image classification," Int. J. Sci. Eng. Technol. Res, vol. 3, pp. 1664-1667, 2014. [22] X. Li and L. Li, "Preference multi-objective artificial bee colony and its application in camellia fruit image
recognition," Application Research of Computers, vol. 12, p. 100, 2012.
[23] S. Banerjee, A. Bharadwaj, D. Gupta, and V. Panchal, "Remote sensing image classification using artificial bee colony algorithm," Int. J. Comput. Sci. Inf, vol. 2, pp. 67-72, 2012.
[24] M. A. Shnan and T. H. Rassem, "Facial Image Retrieval on Semantic Features Using Adaptive Genetic Algorithm," Informatica Economica, vol. 22, 2018.
[25] D. Kriesel, "A brief Introduction on Neural Networks," 2007.
[26] A. Monadjemi, "Towards efficient texture classification and abnormality detection," University of Bristol, 2004. [27] O. Salima, A. Taleb-Ahmed, and B. Mohamed, "Spatial information based image clustering with a swarm
approach," Iaes Int. J. Artif. Intell.(Ij-Ai), vol. 1, pp. 149-160, 2012.
[28] S. Banerjee, A. Bharadwaj, D. Gupta, and V. Panchal, "Remote sensing image classification using artificial bee colony algorithm," International Journal of Computer Science and Informatics, vol. 2, pp. 67-72, 2012.
[29] M. S. Uzer, N. Yilmaz, and O. Inan, "Feature selection method based on artificial bee colony algorithm and support vector machines for medical datasets classification," The Scientific World Journal, vol. 2013, 2013.
BIOGRAPHIES OF AUTHORS
Fthi M. Albkosh obtained his Bachelor of Computer Engineering from the High Institute of Industry, Libya, and Master degree in the Communication and Computer Engineering from Universiti Kebangsaan Malaysia. He is currently a Ph.D student at the School of Informatics and Applied Mathematics, Universiti Malaysia Terengganu. His research interests in the area of image processing and pattern recognition.
Muhammad Suzuri Hitam obtained his Bachelor of Industrial Technology (B.Tech (Hons.) from Universiti Sains Malaysia and Ph.D degree from University of Leeds, United Kingdom. He is currently a Profesor at the School of Informatics and Applied Mathematics, Universiti Malaysia Terengganu. His research interests are focused on image processing, computational intelligence and robotics.
Wan Nural Jawahir Hj Wan Yussof received her B.IT in Software Engineering and M.Sc. in Artificial Intelligence from Kolej Universiti Sains dan Teknologi Malaysia. In 2014, she obtained her Ph.D. from Universiti Malaysia Terengganu. She is currently a senior lecturer at School of Informatics and Applied Mathematics, Universiti Malaysia Terengganu. Her research interests are in 2D/3D image analysis and underwater video processing.
Abdul Aziz K Abdul Hamid is a senior lecturer at the School of Informatics and Applied Mathematics, Universiti Malaysia Terengganu. He received his Ph.D in computer science from Universiti Kebangsaan Malaysia in 2014 and he is actively involved in a multitude of technical projects across a broad range of sectors, including financial, manufacturing, port management and education. His research interest include image processing, pattern recognition and data science.
Rozniza Ali obtained B.Sc from Kolej Universiti Sultan Zainal Abidin, MSc. from Universiti Teknologi MARA and Ph.D in Computer Science from Stirling University, United Kingdom. Now she served at Universiti Malaysia Terengganu as senior lecturer at the School of Informatics and Applied Mathematics. Her research area of interest is on image processing and pattern recognition.