The Farm Level Impacts of Replacing Current Farm Programs with a Whole Farm Revenue Program J. Marc Raulston James W. Richardson Joe L. Outlaw George M. Knapek
Agricultural & Food Policy Center
Texas A&M University Department of Agricultural Economics College Station, Texas 77843-2124
(979) 845-5913
Selected Paper prepared for presentation at the SAEA Annual Meeting Corpus Christi, Texas
February 5-8, 2011
Copyright 2011 by Raulston, Richardson, Outlaw, and Knapek. All rights reserved. Readers may make verbatim copies for non-commercial purposes by any means, provided that this
The Farm Level Impacts of Replacing Current Farm Programs with a Whole Farm Revenue Program
Background:
As discussion surrounding the 2012 farm bill picks up, the inclusion of a whole farm insurance program is receiving serious consideration, especially from House Ag Committee Ranking Minority Leader Collin Peterson. Although no specific details are available as to the nature of the Congressman’s proposal, a whole farm revenue program certainly provides a different type of safety net from current government programs. One benefit of this type of program from a government expenditure standpoint is potential budget savings, a notable bonus when government program cuts loom in this recessionary environment. Bruce Babcock, director of the Center for Agricultural and Rural Development at Iowa State University testified before Congress on May 13, 2010 that a whole farm revenue insurance program could be developed for crop and livestock producers for less than federal expenditures on the direct payment program alone. The Budget of the U.S. Government for fiscal year 2011 projects the 2011 budget deficit at just under $1.27 Trillion. The fiscal year 2011 federal budget also documents projected expenditures on agricultural commodity programs and crop insurance at approximately $20.2 Billion, so total elimination of these program expenditures would reduce the projected budget deficit by only 1.6 percent. Although augmenting expenses through a whole farm revenue coverage program may have no substantial impact on reducing the U.S. budget deficit, this type of program certainly has more positive connotations with the American public and in the popular press and media than the direct payment program. Perceived budgetary savings and the political popularity of revenue safety nets versus fixed payment programs make these types of policy tools popular with policymakers in the current economic and political situation. The real
question is what the financial impacts of these potential policy adjustments are on agricultural producers at the farm level. That is, would a revenue coverage program provide an equal or better safety net for agricultural producers as the current government programs?
Objective:
The objective of this study is to evaluate the farm level economic impacts of
implementing a whole farm revenue insurance program in lieu of current government program payments on agricultural producers in major production areas of the United States. Although no details are available on Congressman Peterson’s proposal and a multitude of options are viable, this study demonstrates how a whole farm revenue coverage program could work at the farm level. Furthermore, the economic impacts of surrendering current government program
payments for enrollment in this new revenue program are illustrated by comparing the potential economic impacts on agricultural producers’ bottom lines through changes in costs and expected indemnities.
Data and Methods:
This study utilizes primary representative farm data in conjunction with a whole farm simulation model to examine the effects of replacing current government payment programs with two levels of whole farm revenue insurance. The representative farms were created through a focus group interview process and are maintained and updated through return visits every three years. Ten representative farms located in major production regions throughout the United States are analyzed assuming each of the alternative whole farm revenue coverage levels. The representative farms are classified by commodity, indicating the primary source of income for
each farm. This study analyzes impacts on two representative cotton farms (Texas and Georgia), three feedgrain and oilseed farms (Iowa, Nebraska, and North Dakota), three rice farms
(Arkansas, California, and Texas), and two wheat farms (Kansas and Washington). A farm level simulation model (FLIPSIM) developed by Richardson and Nixon (1986) at Texas A&M
University is used to analyze the representative farms under various whole farm revenue
insurance programs. The FLIPSIM model uses a multivariate empirical probability distribution for simulating stochastic yields and prices, thus allowing projections to incorporate production and price risk. Deterministic price projections, rates of change for input prices, and interest rates utilized in this study are from the FAPRI January 2010 Baseline. Other key assumptions for the representative crop farms are as follows:
• Long-term and intermediate debt beginning in 2008 is 20% of beginning asset value • Continuation of 2008 Farm Bill provisions throughout projection period (for the Base
situation in this study)
• Total farm size, crop mixes, and land tenure remain constant throughout study period Base revenue for the revenue insurance program was calculated using a 5-year Olympic moving average for receipts generated from program crops. For example, 2010 base revenue was estimated using program crop receipts (national season average prices and actual farm yields) for 2005-2009. Actual revenues utilize local prices and yields while base revenues utilize local yields and national prices. The revenue program was enabled for three coverage levels (75 percent, 85 percent, and 95 percent), and the ten farms were stochastically simulated with no premium. The average of the stochastic indemnities/payouts of the whole farm revenue
insurance program for 2010-2017 (8 projected years) was calculated. A federal premium subsidy of 59 percent is assumed across all coverage levels. This figure was derived from current federal
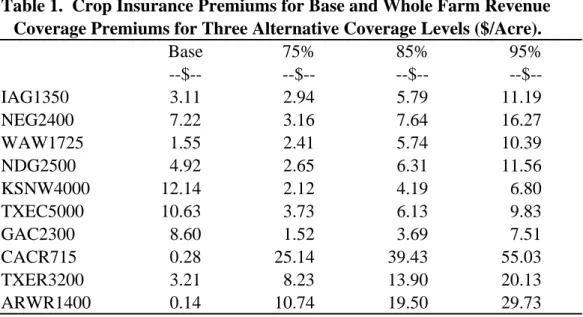
crop insurance subsidies across program crops for typical coverage levels of MPCI (65 percent yield coverage) and CRC (70 percent coverage) products. Table 1 displays the net crop
insurance premiums for the Base situation and the whole farm revenue coverage premiums for the three alternative levels of the new program. As expected, premiums increase
correspondingly with rising coverage levels. This calculated premium was charged to each respective farm at each respective coverage level, and the farms were again stochastically simulated. Attributes of each scenario analyzed are described below.
• Base – Farms are enrolled in 2008 farm bill government payments programs and farm purchases crop insurance product in which it is currently enrolled through 2017 • 75 Percent Revenue Coverage – Assumes 75 percent whole farm revenue coverage
replaces government payments and crop insurance for 2010-2017 projection period • 85 Percent Revenue Coverage – Assumes 85 percent whole farm revenue coverage replaces government payments and crop insurance for 2010-2017 projection period • 95 Percent Revenue Coverage – Assumes 95 percent whole farm revenue coverage replaces government payments and crop insurance for 2010-2017 projection period
Results:
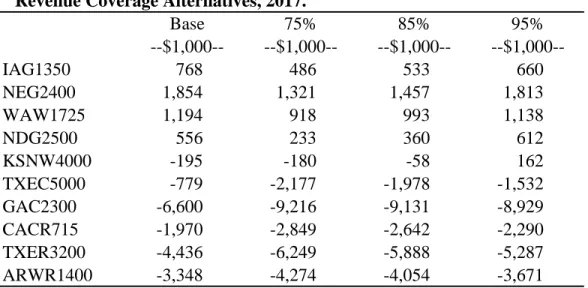
Average ending cash reserves in the final year of the study period were collected from the stochastic outcomes and evaluated to rank preferences for the base situation and alternatives (Table 2). Based on ending cash reserves in 2017, eight of ten farms prefer the Base scenario to all three alternative levels of whole farm revenue coverage. For each of these farms, increasing coverage levels results in corresponding increases in ending cash; however, even at the highest level of coverage, the whole farm revenue coverage program does not bring ending cash reserves
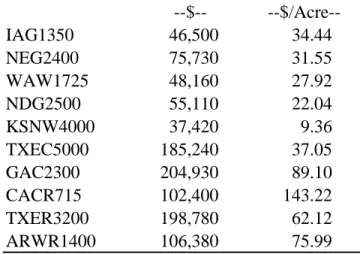
back to Base situation levels. The 2,500 acre North Dakota feedgrain and oilseed farm (NDG2500) prefers the 95 Percent Revenue Coverage coverage level of the whole farm revenue program to the Base and to the 75 Percent Revenue Coverage and 85 Percent Revenue Coverage alternatives. The 4,000 acre Northwest Kansas representative wheat farm (KSNW4000) prefers the 75 Percent Revenue Coverage alternative, the lowest level of the new program analyzed, to the Base situation. For the KSNW4000 wheat farm, increasing levels of coverage result in higher ending cash reserve levels; therefore, this farm prefers the 95 Percent Revenue Coverage alternative to the Base and two lower coverage level alternatives. These two farms that prefer the new program at some coverage level have at least one common attribute. The Kansas wheat farm has 38 percent of its government program acres in wheat base, and the North Dakota, a farm historically classified as a representative wheat farm, has 52 percent of its base acres in wheat. Table 3 displays the differences in government payments among the ten farms included in this study. These are the payments forfeited to enroll in the whole farm revenue coverage program, so these two farms are relinquishing relatively low government payments on a dollar per acre basis ($22.04 for North Dakota and $9.36 for Kansas).
Summary and Conclusions:
Preferences and impacts of trading current government payment programs for enrollment in whole farm revenue insurance follow some regional trends. Study results indicate producers with significant farm program acres in wheat, a crop with relatively low government program payments per acre, will likely either be less negatively impacted by trading government payments for whole farm revenue coverage or may even prefer enrollment in this replacement program. Conversely, farms with traditionally high government program payments such as rice,
cotton, and peanuts are likely to be more adversely impacted by forfeiture of current government programs for enrollment in whole farm revenue coverage. Similarly, rice producers generally face lower production risk than producers of other commodities, thus they may not prefer giving up a fixed direct payment for revenue coverage that may be marginally beneficial to them, at best. Finally, an important note is the results of this analysis are heavily influenced by
assumptions on premium calculation and on federal subsidization of these premiums. If federal expenditures allow for higher premium subsidies, this program could potentially be more favorable for a greater cross section of agricultural producers.
References
Agricultural & Food Policy Center. Representative Farms Economic Outlook for the January 2010 FAPRI/AFPC Baseline. AFPC Working Paper 10-1. Texas A&M University, March 2010.
Babcock, B.A. Costs and Benefits of Moving to a County ACRE Program. CARD Policy Brief 10-PB-2. Ames, IA: Center for Agricultural and Rural Development, Iowa State
University, May 2010. Available at
http://www.card.iastate.edu/publications/show_policy_brief.aspx?id=1128 Office of Management and Budget. Budget of the U.S. Government: Fiscal Year 2011.
Washington, DC: US Government Printing Office, 2010. Available at http://www.gpoaccess.gov/usbudget/fy11/pdf/budget.pdf
Richardson, J. W. and C. J. Nixon. “Description of FLIPSIM V: A General Firm Level Policy Simulation Model.” Texas Agricultural Experiment Station, Bulletin B- 1528, July 1986.
Richardson, J.W., S.L. Klose, and A.W. Gray. “An Applied Procedure for Estimating and Simulating Multivariate Empirical (MVE) Probability Distributions in Farm- Level Risk Assessment and Policy Analysis.” Journal of Agricultural and
Table 1. Crop Insurance Premiums for Base and Whole Farm Revenue Coverage Premiums for Three Alternative Coverage Levels ($/Acre).
Base 75% 85% 95% --$-- --$-- --$-- --$--IAG1350 3.11 2.94 5.79 11.19 NEG2400 7.22 3.16 7.64 16.27 WAW1725 1.55 2.41 5.74 10.39 NDG2500 4.92 2.65 6.31 11.56 KSNW4000 12.14 2.12 4.19 6.80 TXEC5000 10.63 3.73 6.13 9.83 GAC2300 8.60 1.52 3.69 7.51 CACR715 0.28 25.14 39.43 55.03 TXER3200 3.21 8.23 13.90 20.13 ARWR1400 0.14 10.74 19.50 29.73
Table 2. Ending Cash Reserves for Base and Three Whole Farm Revenue Coverage Alternatives, 2017.
Base 75% 85% 95% --$1,000-- --$1,000-- --$1,000-- --$1,000--IAG1350 768 486 533 660 NEG2400 1,854 1,321 1,457 1,813 WAW1725 1,194 918 993 1,138 NDG2500 556 233 360 612 KSNW4000 -195 -180 -58 162 TXEC5000 -779 -2,177 -1,978 -1,532 GAC2300 -6,600 -9,216 -9,131 -8,929 CACR715 -1,970 -2,849 -2,642 -2,290 TXER3200 -4,436 -6,249 -5,888 -5,287 ARWR1400 -3,348 -4,274 -4,054 -3,671
Table 3. Average Government Program Payments for Base Situation, 2010-2017.
--$-- --$/Acre--IAG1350 46,500 34.44 NEG2400 75,730 31.55 WAW1725 48,160 27.92 NDG2500 55,110 22.04 KSNW4000 37,420 9.36 TXEC5000 185,240 37.05 GAC2300 204,930 89.10 CACR715 102,400 143.22 TXER3200 198,780 62.12 ARWR1400 106,380 75.99