DOI 10.1007/s13209-014-0107-9
O R I G I NA L A RT I C L E
ATM withdrawals, debit card transactions at the point
of sale and the demand for currency
Santiago Carbó-Valverde · Francisco Rodríguez-Fernández
Received: 16 September 2012 / Accepted: 18 March 2014 / Published online: 4 April 2014 © The Author(s) 2014. This article is published with open access at SpringerLink.com
Abstract Debit cards are employed for cash withdrawals at automated teller machines (ATMs) and for purchasing transactions at point-of-sale (POS). In this paper, we explore, for the first time to our knowledge, the determinants of debit card transaction volumes at ATM and POS, the relationship between these two alternative usages of cards and its impact on the demand for currency. We employ a unique database that considers the two-sided nature of debit cards to explore these issues. The results suggest that the intensity of the use of ATMs and POS have a large economic impact one on another. We also find a net negative effect of transactions with debit cards on the demand for currency since the positive impact of ATM usage is lower in absolute terms than the negative effect of POS volumes.
Keywords Payment instruments·Banks·ATMs·POS·Demand for currency JEL Classification G21·O33; L11
1 Introduction
A common feature in payment systems all over the world is the deployment, in parallel, of both automated teller machine (ATM) and point of sale (POS) devices. The coexis-tence of both mechanisms responds to different bank strategies which may overlap over
S. Carbó-Valverde (
B
)Bangor Business School and Funcas, Hen Goleg, College Road, Bangor, Gwynedd LL57 2DG, UK
e-mail: s.carbo-valverde@bangor.ac.uk F. Rodríguez-Fernández
University of Granada and Funcas, Granada, Spain e-mail: franrod@ugr.es
time. In this paper we focus on the use of bank debit cards. Recent data suggest that both ATM withdrawals and POS transactions with debit cards are increasing signifi-cantly in developed countries.1However, the relationships and interactions between these two technologies remain largely unexplored. These relationships may pose dif-ferent implications for the substitution of cash for electronic payments. In particular, banks typically expand ATM networks to allow debit cardholders to easily withdraw cash. At the same time, they also spread out their POS devices to offer cardholders a cashless method of payment at the point of sale.2
Card payments stand for around 22.1 billion transactions per year, of which 10.2 billion are transactions with debit cards.3 For some time, cash and card pay-ments inevitably have to coexist. However, it has been recognized that handling dual processes—such as the development of cash usage and card usage— for a long period would be expensive for both the payments industry, and its customers (
Tumpel-Gugerell 2009; citealtEuropean12). Some empirical studies have shown the potential
benefits of shifting from paper-based to electronic payments. Particularly illustrative are the results ofHumphrey et al.(2006), who estimate that this shift could generate a total cost saving close to 1 % of GDP for a sample of 12 EU countries.
The aim of this paper is to analyze the evolution of the use of debit cards at ATMs and POS and to estimate the effects that both trends may have on the demand for currency. We first focus on transaction volumes and employ a rich bank-level database for Spain that allows us to identify specific features of the bilateral (two-sided) market structure of debit card markets, including network effects. We then transform our database into a regional database—which provide richness in the variation of the use of different payment methods and related consumer habits- that allows us to estimate the determinants of the demand for currency and to identify the effects of ATMs and POS debit card transactions. We strictly focus on debit cards as an (immediate) alternative to cash. Our study does not include credit cards since their usage incorporates other decisions of cardholders related to debt (differed debit and revolving transactions) which are beyond the scope of this paper.
The paper is structured as follows: Sect.2analyzes the relevant literature in order to benchmark our study with previous contributions in this field. The empirical method-ology is presented in Sect.3. The results are shown in Sect.4. The paper ends with a brief summary of results and conclusions in Sect.5.
1 According to the data of the Bank for International Settlements, the growth rate of the real value of
transactions at POS in the member countries of the Committee for Payment and Settlement Systems (CPSS) was 26 % in 2010. However, the real value of cash withdrawals at ATMs was growing at an annual rate of 17.0 % in the same year. The CPSS members are Brazil, Belgium, Canada, China, France, Germany, Hong Kong, India, Italy, Japan, Korea, Mexico, Netherlands, Russia, Saudi Arabia, Singapore, Sweden, Switzerland, Turkey, United Kingdom and United States.
2 Banks play a key role in the payment card markets for various reasons. Firstly, banks are the main card
issuers in most financial markets. Secondly, card services are usually offered as part of a set of banking products. Finally, the majority of transactions take place at ATMs and POS machines which are principally provided by banks.
3 According to the data provided by the European Central bank as of 2011. These data do not permit to
2 Literature background
2.1 The deployment of ATMs and POS devices
In many developed countries, consumers added debit cards to their wallets during the 1980s as devices to access cash at ATMs. At that time, banks aimed to move some front-desk customer services away from branches in order to increase efficiency and service. During 1990s banks also aimed to foster the use of cards at the point of sale for purchase transactions as a source of fee income, installing POS card payment devices. As noted byAmromin and Chakravorti(2009), in most economies debit cards are first added—for the most part unknowingly—to consumers’ wallets as a device to access cash at ATMs. With the adoption of POS machines by merchants, debit cards can be alternatively used to make purchases. Hence, the final usage of debit cards will depend on consumers’ attitudes as well as on the availability of POS and ATMs.
In the related literature, to our knowledge, the impact of transactions at POS ter-minals on the substitution of cash for electronic payment has not yet been specif-ically explored and its relationship with ATM adoption remains largely unknown. The consumer adoption and merchant acceptance patterns of cards have been rel-atively slow in many countries and the usage and diffusion of cards at the ATM and at the POS have somehow overlapped.Humphrey et al.(1996) estimated a sys-tem of demand equations for five payment instruments (check, electronic or paper giro, credit card, and debit card) for 14 countries between 1987 and 1993 and found that although all payment instruments except debit cards substitute for cash. This result suggests that the use of debit cards for ATM withdrawals and POS transac-tions may impose some restrictransac-tions on the substitution of cash for cards. Similarly,
Amromin and Chakravorti(2009) study changes in transactional demand for cash
in 13 OECD countries from 1988 to 2007, showing that ATM withdrawals decrease with greater debit card usage at the POS. Studies byHumphrey and Berger(1990)
orHumphrey et al.(2000) have also shown that efficient payment instrument pricing
induces greater use of electronic payments, as it is cheaper than paper-based alterna-tives.
2.2 Debit cards, two-sided markets and network externalities
As our first empirical aim is to analyze the determinants of ATMs and POS transactions volumes and its interactions, it is critical to consider that debit card payment markets function as networks and, therefore, the value of a network increases with every new consumer who uses cards at their own ATM or POS terminals and any other bank that accepts them at their ATMs or POS terminals. These networks are commonly organized as two-sided markets. In these markets, two (or more) parties interact on a “platform”, and the interaction involves network externalities. There are various parties involved including consumers, the banks that issue the cards (known as issuers), merchants, the banks that provide merchants with POS devices (known as acquirers) and a network operator or platform. A consumer makes a purchase from a merchant. Generally, the
merchant charges the same price regardless of the type of payment instrument used to make the purchase (no surcharge rule). Consumers often pay annual membership fees to their financial institutions for cards and may pay service charges for a bundle of services associated with transactions accounts. Merchants pay fees known as merchant discounts. Acquirers pay interchange fees to issuers. In this type of market, the value of a network increases with every new consumer who uses cards, every merchant that accepts them at their point of sale and any other bank that accepts them at their ATMs.4
Given the complexity of price structure, the debit card market is two-sided since prices and transactions on either side of the market (cardholders or merchants) sig-nificantly affect prices and transactions on both sides and not merely one of them
(Rochet and Tirole 2006). Typically, pricing is asymmetric, one side paying a price
substantially below the other. In any event, although conventional wisdom and theo-retical contributions hold that payment cards display properties of two-sided markets, there is scarce empirical evidence on this issue. Two exceptions areRysman(2007) —who uses consumer panel data and finds a regional correlation between consumer usage and merchant acceptance within the four major networks of the US- andCarbó
et al.(2009)—who show that that consumer and merchant acceptance and transaction
volumes are related and increased in Spain when interchange fees were reduced by several regulatory interventions between 1999 and 2005. However, they also acknowl-edge that “it is not possible to clearly identify such potential effect (of regulation)” and “the results do not change significantly—neither in the signs of the coefficients nor in their magnitude—when these regulation dummies are introduced”.
2.3 The demand for currency: related approaches
Given that the second empirical goal in our study to estimate the impact of the usage of debit cards at ATMs and POS devices on the demand for currency, it is worth noting that most previous studies have focused on the impact of currency holdings for monetary control purposes and, in particular, the distortions related to the efficient management of cash balances for consumers’ transaction purposes when a (nominal) interest-bearing asset is available, using a Baumol-Tobin model of the demand for currency.5(e.g.Avery et al. 1986;Mulligan 1997;Mulligan and Sala-i-Martin 2000).
However, there is a paucity of studies assessing the impact of the use of debit cards at ATMs and at POS. An exception isAttanasio et al.(2002) who study the effects of ATM transactions on the demand for currency. In particular, they estimate the elasticities of the demand for currency including the impact of ATM transactions and find that these elasticities are close to the theoretical values implied by standard inventory models, although they find statistically significant differences between individuals with an ATM card and those without.
4 See, as a reference,Rochet and Tirole(2002, 2003, 2006);Armstrong(2006),Bolt and Chakravorti
(2008);Rysman(2009); orWeyl(2010). Interestingly a recent contribution byChun-Yu Ho(2012) for the Chinese case, suggests that the card network reduces price to attract more merchants to join the network when consumer card usage is high, and adjusts the price structure according to demand and cost factors.
3 Empirical methodology 3.1 Data
The data corresponds to proprietary bank-level information from a sample of 45 Span-ish banks and contains quarterly bank-level (acquirer and issuer) information on pay-ment cards, ATMs and POS terminals as well as prices for debit card transactions (interchange fees, merchant fees and annual fees). Our database also includes infor-mation on merchant acceptance which is useful for identification purposes as it is critical to define the network effects affecting ATMs and POS transaction volumes. The analysis covers the period 1997:1 to 2007:4, and the total number of panel obser-vations is 1,980.
The bank-level data permits us to identify both the issuer (consumer) and acquirer (merchant) sides of the two-sided market. As we will describe in the following section, this distinction between issuer and acquirer sides is also important to identify the network effects for merchant and consumers that affect their respective transaction volumes.
Spain is, in our opinion, an interesting laboratory for empirical purposes. Some excerpts of the payment system statistics provided by the European Central Bank as of 2010 (last year available) are illustrative on the relevance of the Spanish case. Spain is the third EU country with the largest number of ATMs per million inhabitants standing at 1,286, following Portugal (1,644) and Belgium (1,413). Spain is also the third EU country with the largest number of POS devices per million inhabitants with 30,148, following Finland (37,476) and Greece (36,523).
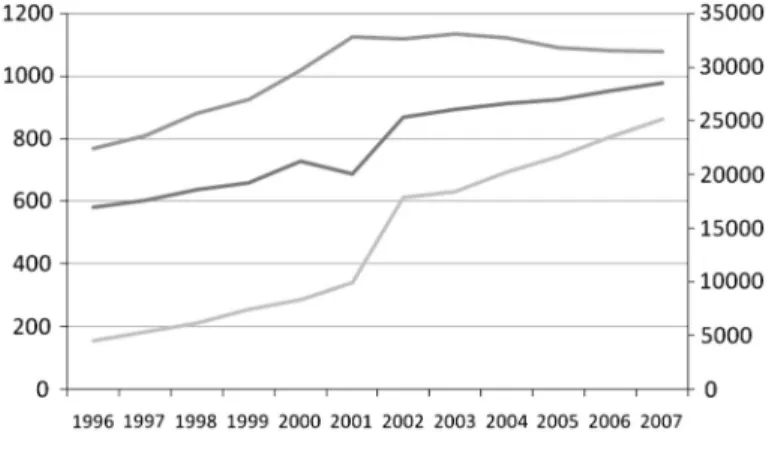
To provide an idea of the evolution of the main variables of our study in Spain, Fig.1
shows ATM and POS transaction volumes and the number of debit cards using Bank of Spain data, which is only available from 1996. The number of ATM transactions
increased from 582 million in 1996 to 979 million in 2007 and the average annual growth rate was 5.1 %. During the same period, POS transactions increased from 156 to 863 million with the average annual growth rate being 18.2 %. As for the number of debit cards they were 22.4 million in 1996 and grew to 31.4 million in 2007 with an average annual growth rate of 3.2 %.
3.2 The change in POS and ATM transactions volumes: a simultaneous equation approach
In order to analyze the determinants of ATM and POS transaction volumes we focus on the quarterly change in transactions per POS terminal by acquirer, transactions per card by issuer and withdrawal transactions per ATM by issuer. By studying transactions volumes by issuer and acquirer, we proxy transactions per card by cardholder and per merchant, since there is no information available on those variables.
As the motivation of our study is to infer to what extent the use of debit cards at ATM and POS interact and their effects on currency holdings, we focus on the change in transaction volumes rather than the number of devices as we are interested in the intensity of usage and not in the adoption patterns. In any event, our empirical specification acknowledges that network effects affecting transaction volumes are expected to be determined by the levels of adoption. In particular, we estimate a three-equation system expressed as follows:
AC T V P O S = f(I C AT M DC, X R1,C V 1) (1)
I C T V DC = f(I C AT M DC, X R2, C V 2) (2)
I C AT M W = f(AC T V P O S, I C T V DC, X R3, C V 3) (3) In Eq. (1), the acquirer change in transaction volume per POS terminal with debit cards (ACTVPOS) is explained by the issuer change in ATM withdrawals per debit card (ICATMW), a vector of exclusions restrictions (XR1) that identify Eq. (1) and a vector of control variables for that equation (CV1). Equation (2), where the dependent variable is the issuer change in transaction volume per debit card (ICTVDC) follows the same structure. The rationale for this specification is that both ACTVPOS and
ICTVDC account for the use of cards by consumers and merchants as a purchasing
device at the POS, as opposed to ICATMDC, which shows the alternative use of debit cards for cash withdrawal purposes. By the same token, the issuer change in ATM withdrawals with debit cards is expected to be negatively affected by ACTVPOS and
ICTVDC.
As the relationships shown in Eqs. (1), (2), (3) are not necessarily contemporaneous— for example, consumers and merchant may react to changes in prices and network effects after observing these changes—all the right-hand-side variables enter the equa-tions with one lag. There are various prices that may potentially affect acquirer and issuer transaction volumes as well as ATM withdrawals. Commonly to all equations, debit cards’ annual fees are relevant in all cases as they represent the cost assumed simply for holding the cards. There are also merchant discount fees involved. These fees particularly affect acquirer volumes—as they are charged by acquirer banks on
merchants for each transaction at the POS and, therefore, may affect acceptance- and, indirectly, issuer volumes—as they depend on the number of merchants accepting the issuers’ cards. Finally, in the case of ATM withdrawals, the annual fee of the card and the cost incurred in every withdrawal (the ATM fee) are both relevant prices.
The exclusion restrictions that identify Eq. (1)—where the acquirer change in transaction volume per POS terminal with debit cards (ACTVPOS) is the dependent variable—are the merchant debit card discount fee and the debit card annual fee— which are expected to be negatively related to merchant transaction volumes- and an interaction term of the merchant acceptance and the total number of debit cards in that network. This interaction captures the network effects as ACTVPOS is expected to increase when the number of merchants served by the acquirer increases or the number of total debit cards increases. The exclusion restriction for ICTVDC corresponds to the annual debit card fee and the network effects shown by the interaction term of the merchant acceptance in the network and the number of cards issued by the bank. It is important to note that only 6 % of banks in the sample charge an annual fee for debit cards.6 Even so, we exploit such variation to infer the impact of debit card fees on acquirer (Eq.1) and issuer (Eq.2) volumes. As for Eq. (3) the exclusion restrictions also include a price for that side of the market—the debit card ATM fees- and the interaction of the number of debit cards in the network and the number of ATMs by issuer, which is expected to show ATM network effects.
The control variables are common to the three equations. The density of rival ATMs in the transaction volume equation is used a proxy for the benefit of using debit cards in terms of access to the ATM. The largest the rivals’ ATM density is, the higher is the probability that acquirer (merchant side) and issuer (consumer side) POS transaction volumes increase. However, as the rivals’ ATM density increases, the issuer ATM transaction volumes decrease since ATM owners impose surcharges for cards issued by competitor banks. We also include the total number of POS devices in the regions where the bank operates and the expected signs are again expected to be positive, positive and negative, respectively, for Eqs. (1), (2) and (3). As for population density, we include this control variable as we expect that those banks operating in territories (regions in our case) with a higher number of inhabitants per square kilometer will enjoy a higher usage of both ATM and POS devices. Bank size is included to control for the potential benefits that larger market participants may have. As for the crime rate, one of the theoretical benefits of the use of payment cards is security and, therefore, we would expect a lower usage on those territories where the crime rate is higher. In order to control for learning and technology-improving effects we include a linear time trend in all the equations.7 As during the period of analysis there have been various regulatory interventions affecting merchant discount fees we followCarbó et al.(2009) and introduce (not shown for simplicity) four dummy variables that take
6 As noted above, banks promote debit card use for reasons that reduce the usage of bank branches and,
therefore, may increase efficiency (cash withdrawals, payments at the point of sale,...). In trying to get more debit cardholders on board, prices have been typically reduced to a minimum or zero as a competitive strategy in Spain.
7 The sign and significance of the trend variable do not change if we include a quadratic trend instead of
the value 0 before the intervention and 1 afterwards (1999, 2002, 2003 and 2005). All the variables are defined in Table1.
The identification of Eqs. (1), (2) and (3) has potential cross-equation restrictions as well as endogeneity concerns. As for cross-equation restrictions, the error terms of consumer and merchant transactions volumes for POS and ATMs are expected to be correlated across the equations. This correlation implies that even if a sepa-rate equation-by-equation estimation would be consistent, it would not be as effi-cient a simultaneous equation method. The simultaneous equations are estimated using a general method of moments (GMM) routine with acquirer and issuer spe-cific fixed effects. The GMM estimation relies on a set of orthogonality conditions which are the products of equations and instruments. Initial conditions for estimation are obtained using three-stage least squares (3SLS), which is a restricted version of the simultaneous equation GMM model. Unlike the standard 3SLS, the GMM estima-tor allows for heteroskedasticity in addition to cross-equation correlation where some variables (as merchant acceptance in our case) may appear both as exogenous and (lagged) endogenous variables in the different equations (Hansen 1982;Wooldridge
2002).
As for the endogeneity concerns, although it is not possible to eliminate all sources of potential endogeneity, we introduce instruments to attempt to minimize this prob-lem. The main endogeneity concern refers to relate prices to transactions volumes. In particular, the level of merchant discount fees may be affected by the optimal choice of this price by payment networks or by changes in demand conditions on the two sides of the market. As inCarbó et al.(2009), we assume that the costs associated with bank-specific efficiency levels partially drive prices charged to merchants and cardholders, but they are uncorrelated with the error terms of the demand equations. Hence, we use the cost/income ratio (operating costs/net income) as instrument for merchant discount fees and ATM fees. We also include the regional market share of deposits of the acquirer bank as instrument for these prices.8Additionally, the natural logarithm of the growth in loans and deposits managed by that network is included as an instrument for the network level variables. We use both current and lagged values of all the instruments.
A test for orthogonality of the instruments with the residuals is employed where the null hypothesis of the orthogonality of the instruments cannot be rejected at the 5 percent level in all cases. We also cluster standard errors at the bank level (Petersen
2009).
3.3 ATMs, POS and the demand for currency: empirical approach
The second empirical goal in this paper is analyzing the effects of ATM and POS transaction volumes on the demand for currency. In most of these models, the demand for deposits—in terms of both amounts held and interest rates paid—represents the
8 As noted byCarbó et al.(2009), a bank may build an ongoing relationship with a merchant due, for
example, to long-standing relationships or cross-selling of products. These contractual relationships may affect prices offered to these merchants but, again, they are uncorrelated with the demand equations.
Table 1 Variable definition and data sources
Variable definition Variables for the estimation of the change in transaction volumes at ATM and POS
Dependent variables
Acquirer change in transaction volume per POS terminal
Percentage change in debit card transactions per POS terminal by an acquirer
Issuer change in transaction volume per debit card
Percentage change in debit card transactions per card by issuer
Issuer change ins ATM withdrawals per debit card
Percentage change in the number of debit card withdrawals per ATM by issuer
ATM and POS density and prices
Rival ATM density Number of an issuer’s rival bank ATMs per km2 in the regions where the bank operates Total POS density Number of an POS per km2in the regions where
the bank operates
Merchant debit card discount fee Average (transaction-weighted) debit card merchant discount fee charged by the bank computed as the (transaction-weighted) average discount fee charged to the merchants accepting the bank POS device
Debit card annual fees Average (transaction-weighted) debit card annual fee charged by the bank computed as the (transaction-weighted) average annual fee charged by the bank
Debit card ATM fees Average (transaction-weighted) ATM fee charged by the bank computed as the (transaction-weighted) average ATM fee charged by the bank
Network effects
Merchant acceptance by acquirer×Number of debit cards in the network
Merchant acceptance by acquirer is computed as a (branch-weighted) average of the percentage of merchants accepting debit cards for purchase transactions in the regions where the bank operates over the total number of merchants in those regions. The number of debit cards in the network is the total number of debit cards issued by the network Merchant acceptance in the network×
Number of debit cards by issuer
Merchant acceptance in the network is the percentage of merchants accepting debit cards where the network operates. The number of debit cards by issuer is the total number of debit cards issued by a bank
Total number of debit cards×Number of ATMs by issuer
The total number of debit cards is the number of debit cards issued in the regions where the bank operates. The number of ATMs by issuer is the stock of ATMs of a bank issuing debit cards
Control variables
Population density Number of inhabitants per km2in the regions where the bank operates
Table 1 continued
Variable definition
Bank size Log (bank assets)
Crime rate The (asset-weighted) ratio of robbery and assaults per 1,000 inhabitants in the regions where the acquirer or issuer operates Variables for the cross-regional analysis of the demand for currency
Dependent variable
Demand for currency Computed in each region as the sum of three consumer-level variables: demand deposits, ATM withdrawals and one half of the consumption divided by the average number of deposit withdrawals
Depositor level
Deposits interest rates (R) Computed as the average ratio of interest expenses to total customers’ deposits of banks operating in the region
Non-durable consumption (c) Regional consumption in nondurable goods Average ATM transactions Average number of ATM transactions in the
region
Average POS transactions Average number of POS transactions in the region
Regional level controls
Log(ATMs) Log of total ATMs in a given region Log(POS) Log of total POS terminals in a given region Log(bank branches) Log of total bank branches in a given region Log(regional GDP) Log of regional GDP in constant terms Data sources: all bank variables were obtained from reports provided by the Spanish Savings Banks Con-federation. GDP and non-durable consumption were obtained from the Spanish Statistical Office
natural interest bearing asset to be considered alternative to currency. The general econometric specification of the demand for currency in the Baumol-Tobin framework is:
In(m)=α−βt+χ(t2)+δln(R)+γIn(c)+ε (4) where m is the demand for currency, t is a time trend, R are the deposit interest rates and c is the consumption in nondurable goods. In these models, the effects of new technologies is based on comparisons between users and non-users of the technology or simply introduced as a control variable. Some studies have used aggregated data
(Avery et al. 1986) to estimate the demand for currency while some other used
sur-vey household or firm-level information (Mulligan 1997). We follow the aggregate approach for two main reasons. First of all, the Survey of Consumer Finance con-ducted by the Bank of Spain incorporates a number of interesting features related to the demand for currency and payment instruments but it does not allow as to compare the effects of debit cards ATM and POS transactions. Secondly, we can exploit the
richness of the regional variation in our data to explore the determinants of the demand for currency.
The main line of inquiry, in this context, is the analysis of the elasticity of the demand for currency to nominal interest rates. As noted by Attanasio et al.(2002) interest rates on deposits and the demand for currency overall display a remarkable degree of regional variation that can be exploited to estimate the relevant elasticity of currency. To our knowledge, these studies have not considered either the effects of debit and/or credit POS transactions or the interaction between ATM and POS transactions in the demand for currency.9 In order to achieve this goal, our dataset is transformed into a regional dataset. In particular, in a first step, the demand for currency, deposit interest rates and nondurable consumption in Eq. (4) are computed as weighted averages of the different banks in that region using the distribution of assets as a weighting factor. In a second stage, these variables are re-computed at the consumer level as ratios of the number of depositors of the banks operating in these ter-ritories.10Since the available data only permit to analyze consumers holding deposits accounts at each bank, our estimations of the demand for currency are restricted to depositors while non-depositors are not considered.11Additionally, when averaging the variables we assume that, on average, all depositors make both ATM and debit and credit POS transactions. As we are analyzing the effects of ATM and POS trans-action volumes at the regional level, we do not distinguish between the issuer and the acquirer sides as we are focusing on the aggregate effect. The variables are computed on an annual basis for the 17 administrative regions in Spain which yields 187 panel observations.
The demand for currency is computed in each region as the sum of three consumer-level variables: demand deposits, ATM withdrawals and one half of the consumption divided by the average number of deposit withdrawals.12 The sum of demand deposits proxies the minimum amount of currency for cash with-drawals while cash withwith-drawals are represented by the consumption ratio and ATM withdrawals.13 The mean and over time evolution of the different variables is shown in Table 3. All variables shown in Table 3 are annual averages excepting (demand for) currency which reflects the average currency holdings per person.
9 We assume that cash is the main alternative to cards while the role of checks is negligible. According to
the Blue Book of Payments of the European Central Bank only 4.4 % of total retail payment transactions in Spain were made by checks in 2007, and mainly for real estate purchases.
10 Consumer-level variables are computed from savings bank data only. This may be a limitation that
overstates the results of the demand for currency since savings banks’ depositors are likely to make higher withdrawals than commercial banks’ depositors. However, the regional variability in the demand for cur-rency is likely to be better captured from savings banks data since most of savings bank information can be clearly identified at the regional level while most commercial banks operate nationwide and it is difficult to identify the source of regional variation from commercial banks data.
11 According to the Eurobarometer published by the European Commission in 2004, 10 % of Spanish
households do not have a deposit account.
12 This is an assumption in this type of studies, following the standard inventory model of cash management
in which the determination of the optimal level of cash holdings involves a trade-off between the cost of a cash shortage and the cost of holding non-interest bearing cash.
13 Data on consumption is obtained from the Spanish Statistical Office while the average number of deposit
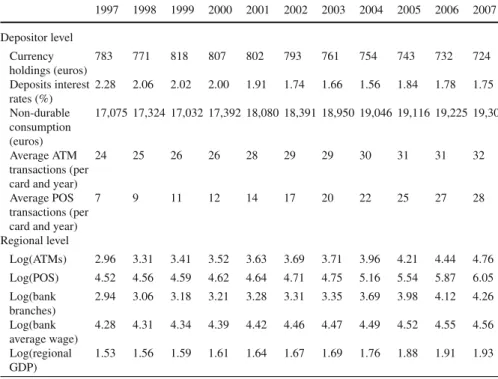
All the monetary variables are deflated using the regional consumer price index. Overall, the main trends show a decrease in currency holdings. Table 4 shows that currency holdings (724 euros in 2007) are similar to international standards
(Humphrey et al. 1996; Carbó and Humphrey 2003) and it decreases over time.
Deposit interest rates also decrease while consumption increases during the sample period.
4 Results
4.1 Transaction volumes
Table2shows the main results regarding transaction volumes. The results are shown both with and without regulatory dummies. No substantial differences are found in both specifications, a result in line withCarbó et al.(2009).
As for the acquirer volume per POS terminal—Eq. (1)—the issuer change in ATM withdrawals per debit card shows a negative and significant sign, as expected. In particular, a 1 % increase in ATM withdrawals per issuer reduces transaction volumes at POS by acquirer by .39 %. Similarly, a 1 % increase in debit card merchants’ discount fees is expected to affect transaction volumes at POS by acquirer by .52 % and a 1 % increase in annual fees acquirer transaction volumes by .020 %. As for the network effect shown by the interaction term “Merchant acceptance by acquirer X Number of debit cards in the network” its effect is positive and significant with the coefficient being .038.
In Eq. (2)—where the issuer change in transaction volume per debit card is the dependent variable- a1 % increase in the issuer change in ATM withdrawals has a negative and significant effect of−.41 % in issuer transaction volume per debit card. A 1 % increase in annual fees is found to reduce issuer transaction volumes by .022 % and the (negative) effect of a 1 % increase in merchant fees is 0.016 %. As for the network effect—the interaction term “Merchant acceptance in the network×Number of debit cards by issuer”—, it has a positive and significant effect (with an estimated coefficient .030).
Combining these main results for Eqs. (1) and (2) we find that ATM and POS transaction volumes are negatively and significantly related. This result is confirmed in Eq. (3) where a 1 % increase in acquirer transaction volume per POS and issuer transaction volume per card are found to have a negative and significant effect of .33 and .70 %, respectively in issuer ATM withdrawals per card. ATM fees are also negatively and significantly related to ATM withdrawals with a 1 % increase in fees having a negative effect of .55 % on the withdrawals. A 1 % increase in debit card annual fees is estimated to have a negative impact of .019 % on ATM withdrawals. The ATM network effects—shown by the interaction term “Number of debit cards in the network×Number of ATMs by issuer”—also have a positive and significant effect (with an estimated coefficient .048).
All the control variables achieve their expected signs and are found to be statistically significant with the exception of the crime rate, which is only found to affect negatively and significantly the issuer change in ATM withdrawals per debit card.
Ta b le 2 Debit card u sage at A T Ms and POS Acquirer change in transaction v olume per POS terminal w ith debit cards (A CTVPOS) Issuer change in transaction v olume per d ebit card (ICTVDC) Issuer change in A T M withdra w als per d ebit card (ICA T MW) Acquirer change in transaction v olume per POS terminal w ith debit cards (A CTVPOS) Issuer change in transaction v olume per d ebit card (ICTVDC) Issuer change in A T M withdra w als per d ebit card (ICA T MW) Constant .07E-11** (.001) − .05E-10** (.001) .02E-10** (.001) .07E-11** (.001) − .04E-10** (.001) .02E-10** (.001) Acquirer change in transaction v olume per POS terminal with debit cards −− − .0329* (.017) −− − .0316* (.016) Issuer change in transaction v olume per d ebit card −− − .0702** (.021) −− − .0718** (.023) Issuer change in A T M withdra w als per debit card − .0397* (.019) − .0414 (.030) −− .0361* (.018) − .0397 (.028) − Merchant debit card discount fee − .0521** (.004) − 0.016* (0.008) −− .0517** (.004) − 0.018 (0.009) − Debit card annual fees − .0020* (.001) − .0022* (.001) − .0019* (.001) − .0021* (.001) − .0023* (.001) − .0020* (.001) Debit card A TM fees −− − .0549* (.027) −− − .0531* (.028) Merchant acceptance by acquirer × Number of debit cards in the n etw ork .0364* (.017) −− .0353* (.018) −− Merchant acceptance in the n etw ork × Number of debit cards by issuer − .0328* (.015) −− .0322* (.016) − Number of debit cards in the n etw ork × Number of A T Ms by issuer −− .0480** (.008) −− .0461* (.010)
Ta b le 2 continued Acquirer change in transaction v olume per POS terminal w ith debit cards (A CTVPOS) Issuer change in transaction v olume per d ebit card (ICTVDC) Issuer change in A T M withdra w als per d ebit card (ICA T MW) Acquirer change in transaction v olume per POS terminal w ith debit cards (A CTVPOS) Issuer change in transaction v olume per d ebit card (ICTVDC) Issuer change in A T M withdra w als per d ebit card (ICA T MW) Ri v al A TM density .0226* (.011) .0586* (.026) − .0629* (.032) .0218* (.010) .0531* (.025) − .0527* (.026) T o tal POS density .0672** (.009) .0543** (.011) − .0875** (.012) .0526** (.010) .0483** (.011) − .0626** (.012) Population d ensity .0164* (.008) .0204** (.005) .0181* (.009) .0153* (.007) .0188** (.005) .0135* (.007) Bank size .0213* (.011) .0185* (.009) .0297 (.025) .0201* (.010) .0181* (.008) .0261 (.020) Crime rate .1211 (.289) .1013 (.376) − .0120* (.006) .0947 (.263) .0823 (.227) − .0116* (.006) Linear time trend .0197* (.010) .0170* (.008) − .0039* (.002) −− − Adjusted R 2 .94 .91 .84 .92 .90 .83 Re gulatory dummies No No No Y es Y es Y es Sar g an test o f o v eridentifying restrictions (p v alue in parentheses) 147.13 (.001) 145.25 (.001) AR(1) (p v alue in parentheses) − 1.559 − 1.536 AR(2) (p v alue in parentheses) − 1.401 − 1.385 Change in transaction v olumes. S imultaneous equation estimation (GMM w ith fix ed ef fects) (clustered standard errors by bank in parentheses) (1,980 observ ations). All the right-hand side v ariables are expressed w ith one lag. * Statistically significant at 5 percent le v el. ** Statistically significant at 1 percent le v el
Table 3 Evolution of main variables of the model of the demand for currency 1997 1998 1999 2000 2001 2002 2003 2004 2005 2006 2007 Depositor level Currency holdings (euros) 783 771 818 807 802 793 761 754 743 732 724 Deposits interest rates (%) 2.28 2.06 2.02 2.00 1.91 1.74 1.66 1.56 1.84 1.78 1.75 Non-durable consumption (euros) 17,075 17,324 17,032 17,392 18,080 18,391 18,950 19,046 19,116 19,225 19,306 Average ATM transactions (per card and year)
24 25 26 26 28 29 29 30 31 31 32
Average POS transactions (per card and year)
7 9 11 12 14 17 20 22 25 27 28 Regional level Log(ATMs) 2.96 3.31 3.41 3.52 3.63 3.69 3.71 3.96 4.21 4.44 4.76 Log(POS) 4.52 4.56 4.59 4.62 4.64 4.71 4.75 5.16 5.54 5.87 6.05 Log(bank branches) 2.94 3.06 3.18 3.21 3.28 3.31 3.35 3.69 3.98 4.12 4.26 Log(bank average wage) 4.28 4.31 4.34 4.39 4.42 4.46 4.47 4.49 4.52 4.55 4.56 Log(regional GDP) 1.53 1.56 1.59 1.61 1.64 1.67 1.69 1.76 1.88 1.91 1.93 All variables are shown as annual averages excepting currency which reflects the “amount of currency usually held at home”. The table reports averages values from sample information. Nondurable consumption and currency are deflated by the consumer price index and then converted to euros
4.2 Impact on the demand for currency
The mean values of the variables of the model of the demand for currency are shown in Table 3. The main estimations of Eq. (4) are shown in Table4. The logarithm of ATMs, POS devices, bank branches14 and regional GDP are included as control variables. ATM and POS transactions are included in a second specification while debit and credit POS transactions are considered separately in a third specification. Additionally, a fourth specification controls for the intensity of cash (or alternative, cards) usage across sectors. The latter distinction is relevant since there is significant variability in the use of cash and cards across merchants sectors. For example, the average share of cash payments in grocery stores is 92.3 % while the average share of card payments in department stores is 7.9 %.
The equations are estimated using a random effects panel data routine, where the regional unobservable effects are considered to be part of a composite error term and are not necessarily fixed over time. This specification also includes time dummies. The choice of the random effects model is made following the pretest estimator based on
14 As in Amromin and Chakravorti (forthcoming), bank branches is a proxy for cash access, in particular
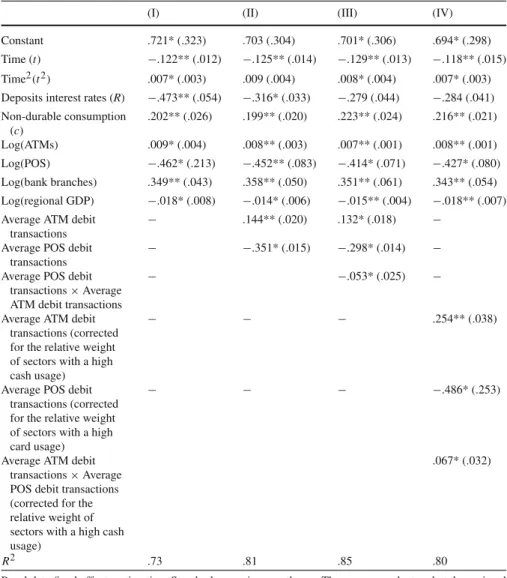
Table 4 Determinants of the demand for currency
(I) (II) (III) (IV)
Constant .721* (.323) .703 (.304) .701* (.306) .694* (.298) Time (t) −.122** (.012) −.125** (.014) −.129** (.013) −.118** (.015) Time2(t2) .007* (.003) .009 (.004) .008* (.004) .007* (.003) Deposits interest rates (R) −.473** (.054) −.316* (.033) −.279 (.044) −.284 (.041) Non-durable consumption (c) .202** (.026) .199** (.020) .223** (.024) .216** (.021) Log(ATMs) .009* (.004) .008** (.003) .007** (.001) .008** (.001) Log(POS) −.462* (.213) −.452** (.083) −.414* (.071) −.427* (.080) Log(bank branches) .349** (.043) .358** (.050) .351** (.061) .343** (.054) Log(regional GDP) −.018* (.008) −.014* (.006) −.015** (.004) −.018** (.007) Average ATM debit
transactions
− .144** (.020) .132* (.018) −
Average POS debit transactions
− −.351* (.015) −.298* (.014) − Average POS debit
transactions×Average ATM debit transactions
− −.053* (.025) −
Average ATM debit transactions (corrected for the relative weight of sectors with a high cash usage)
− − − .254** (.038)
Average POS debit transactions (corrected for the relative weight of sectors with a high card usage)
− − − −.486* (.253)
Average ATM debit transactions×Average POS debit transactions (corrected for the relative weight of sectors with a high cash usage)
.067* (.032)
R2 .73 .81 .85 .80
Panel data fixed effects estimation. Standard errors in parentheses. The errors are clustered at the regional level (187 observations). * Statistically significant at 5 percent level. ** Statistically significant at 1 percent level
the Hausman and Taylor model.15This pretest estimator reverts to the random effects estimator if the standard Hausman test based on the FE versus the RE estimators is not rejected, as it is the case in our model.
Additionally, the structure of Eq. (4) requires an intercept which the random effects model offers while the fixed effects model eliminates. In the first specification (column I), the elasticity of currency to deposit interest rates (−.473) and consumption (.202) are significant and their values are in line with the theoretical and empirical results
of previous studies based on inventory models of cash management. Importantly, the deployment of ATM devices seems to increase the use of currency, although the estimated elasticity (.009) is significantly lower compared to the negative elasticity of the deployment of POS devices (−.462). The opening of bank branches also affects the demand for currency positively and significantly (.349). The average number of ATM and POS transactions is included in a second specification in Table4(column II). The elasticity of interest rates (−.316) and the elasticity of consumption (.199), decrease in absolute terms. Importantly, average ATM transactions affect positively and significantly the demand for currency (.144) while POS transactions exhibit a negative and significant effect (−.351) that almost triple that of ATM transactions. However, the results suggest that as long as banks continue to deploy ATMs and POS terminals, the substitution rate of cash by cards will be diminished. As for the combined impact of ATM and POS transactions, column III shows that interaction POS and ATM transactions appear to have a net negative effect on the demand for currency (−.053).
Finally, column IV shows the results where the intensity of the use of cards and cash across merchant sectors are controlled for. As noted, inter alia, by Whitesell
(1992) andAmromin and Chakravorti (2009), the choice of a payment instrument for consumption purposes (and, hence, the demand for currency) is highly dependent on merchant’s acceptance. In particular, the effects of card payments on the demand for cash (for purchases) in certain merchant sectors may per se be invariably condi-tional on merchant’s acceptance (related, for example, to idiosyncratic reasons and the size of payments) in that sector. In order to analyze these effects, the variables showing average ATM and POS transactions are redefined. In particular, the “the average POS transactions” variable for a certain region is computed as a weighted average of the POS transactions, using the relative weight of sectors with a high card usage as a weighting factor. Similarly, average ATM transactions are computed using the reciprocal of the same weighting factor in order to show the likelihood of cash usage in sectors where cash is expected, per se, to show a higher usage.16The sectors where cards are found to be used to a significant larger extent than cash17are hotels, restaurants & travel agencies; department stores and boutiques; and entertainment. The results when these variables are applied are shown in column (IV) in Table4. All the results hold and the positive combined effect of ATM and POS transactions shown by the interaction term is found to increase to .67. These results suggest that the margin to reduce the demand for currency is limited in certain sectors where the use of cash is expected to be higher. Similarly, POS transactions may help reduce the demand for currency to a larger extent in those sectors where the average transaction size or the characteristics of the sector themselves make card payments more willing to occur. This may also explain why many card issuers are trying to develop
spe-16 The sector information is obtained from the regional consumption expenditure database of the Spanish
Statistical Office.
17 According to a supplementary database also provided by the Spanish Savings Banks Confederation
the use of cards in these sectors is above 65 % while the median value of all sectors is 39 % (not shown, available upon request).
cific card products for small value payments (e.g. store-value-cards or pay-as-you-go cards).
5 Conclusions
This paper analyses the determinants of POS and ATM debit card transactions volumes in Spain, their interactions and their overall impact on the demand for currency. To our knowledge, this is the first paper simultaneously exploring both usages of debit cards and the effects on the demand for money. From a policy point of view, the use of debit cards has been identified as one of the main examples of the transition from paper-based to electronic-based systems.18However, ATM transactions and POS transactions have opposite effects since the use of debit cards at ATMs increases cash withdrawals while the use of debit cards at POS reduces cash holdings for purchasing purposes. In this paper, we use a unique bank-level database for Spain that allows us to identify the issuer (consumer) and acquirer (merchant) sides of the use of debit cards at POS as well as the number of debit card withdrawals at a bank.
Our main findings are twofold. First of all, using a simultaneous equation setting and considering network effects and cross-equation restrictions we show that ATM transactions and POS transactions are significantly and negatively related and have a large economic impact one on another. Secondly, we transform the banks’ dataset into a regional dataset that permit us to explore the impact of ATM and POS transactions on the demand for currency using a wide range of explanatory factors. As in previ-ous studies, the results show that ATM transactions have a positive and significant impact on the demand for currency but we show for the first time that POS transac-tions have a negative and significant effect that offsets the (positive) impact of ATM transactions.
Acknowledgments Financial support from the “Ayuda a la investigación en Ciencias Sociales” of the Fundación BBVA is acknowledged and appreciated. We also thank financial support from the project of the Spanish Ministry of Science and Innovation ECO2011-27954. We thank an anonymous referee for the valuable comments made on this paper. We also thank our discussant Bijorn Imbierowicz and other participants in the 2008 Australasian Finance and Banking Conference for the comments on an earlier version of the paper entitled “ATM vs. POS terminals: a horse race?”. We also thank comments from our discussant John Krainer and from Bob Chakravorti, Jean-Charles Rochet, James McAndrews, Charles Khan, Gautam Gowrisankaran and other participants in the 2009 American Economic Association Meeting held in San Francisco in January 2009. Additionally, comments from our discussant, Martin Goetz, Ahmet Aysan, Marianne Verdier, Jozsef Molnar and other participants in the 7th International Industrial Organization Conference held in Boston in April 2009 are appreciated.
Open Access This article is distributed under the terms of the Creative Commons Attribution License which permits any use, distribution, and reproduction in any medium, provided the original author(s) and the source are credited.
18 More choice and transparency for consumers—with a broader range of competitive services, payment
users could choose the payment instruments and providers that best serve their needs. Today, the cost implications of the choice they make are often not visible to consumers. The Green Paper 11.1.2012 of the EC (European Commission 2012) specifies that the role of debit cards is not only relevant as a “cheaper substitute for cash” but also as it provides “more payment security and customer trust”.
References
Amromin G, Chakravorti S (2009) Whither loose change? The diminishing demand for small denomination currency. J Money Credit Bank 41:315–335
Attanasio OP, Guiso L (2002) The demand for money, financial innovation, and the welfare cost of inflation: an analysis of household data. J Polit Econ 110:317–351
Armstrong M (2006) Competition in two-sided markets. Rand J Econ 37(3):668–691
Avery RV, Elliehausen GE, Kennickell AB (1986) The use of cash and transaction accounts by American families. Federal Res Bull 72:87–108
Baumol WJ (1952) The transactions demand for cash: an inventory theoretic approach. Q J Econ 66:545–546 Baltagi BH, Bresson G, Pirotte A (2003) Fixed effects, random effects or HausmanTaylor: a pretest estimator.
Econ Lett 79(3):361–369
Bolt W, Chakravorti S (2008) Economics of payment cards: a status report. Economic perspectives, Federal Reserve Bank of Chicago, 4th Quarter, pp 15–27
Carbó S, Humphrey DB (2003) The falling share of cash payments in Spain. Moneda y Crédito 217:167–169 Carbó S, Chakravorti S, Rodriguez F (2009) Regulating two-sided markets: an empirical investigation.
Chicago Fed Working Paper, No. 2009–11
Chun-Yu Ho LX (2012) Credit risk, penetration rate and payment card pricing, mimeo
European Commission (2012) Green paper: towards an integrated European market for card, internet and mobile payments. European Commission, 1 Nov 2012
Hansen LP (1982) Large sample properties of generalized method of moments estimator. Econometrica 50(4):1029–1054
Hausman JA, Taylor WE (1981) Panel data and unobservable individual effects. Econometrica 49(6):1377– 1398
Humphrey D, Berger A (1990) Market failure and resource use: economic incentives to use different payment instruments. In: Humphrey D (ed) The US payments system: efficiency, risk, and the role of the Federal reserve. Kluwer Academic Publishing, Norwell, pp 45–86
Humphrey D, David B, Pulley L, Vesala J (1996) Cash, paper, and electronic payments: a cross-country analysis. J Money Credit Bank 28:914–939
Humphrey D, Pulley L (2000) The check’s in the mail: why the United States lags in the adoption of cost-saving electronic payments. J Financ Serv Res 17:17–39
Humphrey DB, Willesson M, Bergendahl G (2006) Benefits from a changing payment technology in Euro-pean banking. J Bank Financ 30:1631–1652
Mulligan CB (1997) Scale economies, the value of time, and the demand for money: longitudinal evidence from firms. J Polit Econ 105:1061–1079
Mulligan CB, Sala-i-Martin X (2000) Extensive margins and the demand for money at low interest rates. J Polit Econ 108:961–991
Petersen MA (2009) Estimating standard errors in finance panel data sets: comparing approaches. Rev Financ Stud 22(1):435–480
Rochet JC, Tirole J (2002) Cooperation among competitors: some economics of payment card Associations. RAND J Econ 33:1–22
Rochet JC, Tirole J (2003) Platform competition in two-sided markets. J Eur Econ Assoc 1:990–1029 Rochet JC, Tirole J (2006) Two-sided markets: a progress report. Rand J Econ 37(3):645–667 Rysman M (2007) An empirical analysis of credit card usage. J Ind Econ 55:1–36
Rysman M (2009) The economics of two-sided markets. J Econ Perspect 23(3):125–143
Tobin J (1956) The interest-elasticity of transactions demand for money. Review of Economic Studies, pp 241–247
Tumpel-Gugerell G (2009) The progress of migration to SEPA. Keynote address at the British Bankers’ Association, 7th Annual Payments Conference, London, 23 Nov 2009
Weyl EG (2010) A price theory of multi-sided platforms. Am Econ Rev 100(4):1642–1672
Whitesell W (1992) Deposit banks and the market for payment media. J Money Credit Bank 24:483–498 Wooldridge J (2002) Econometric analysis of cross section and panel data. MIT Press, Cambridge