Resource estimation of upper layer
network traffic analysis
Birgir Haraldsson
Supervisor: Adam BridgenFaculty of Information Technology, University of Akureyri
Submitted April 2005, in partial fulfilment of the conditions of the award of the degree BSc.
I hereby declare that this dissertation is all my own work, except as indicated in the text:
Signature
Abstract
This paper describes an experiment to create estimates of how much resources are needed to analyze network traffic at the upper network layers. The paper shows that upper layer analysis requires significantly more resources than a lower layer analysis. Upper layer analysis introduces many issues including concerns for privacy. A prototype software to filter at the upper layers was implemented using multi-threaded pipeline of filters. The prototype was further used in a sequence of experiments, with varying loads and searches, to generate resource estimates.
Contents
1 Introduction 3 2 Preliminary information 4 3 The Project 9 3.1 Description of project . . . 9 3.1.1 Requirements of Netvaki . . . 9 3.1.2 Prototype decisions . . . 10 3.2 Issues . . . 10 3.2.1 Performance . . . 10 3.2.2 Segmentation . . . 11 3.2.3 Compression . . . 11 3.2.4 Encryption . . . 11 3.2.5 IPv6 . . . 12 3.2.6 Privacy . . . 12 3.2.7 Proxy . . . 12 3.2.8 HTTP . . . 12 3.3 Related work . . . 134 Design & implementation 14 4.1 Sampling the traffic . . . 14
4.2 Solutions . . . 14 4.3 Architecture . . . 16 4.4 Implementation . . . 19 5 Experimentation 21 5.1 The method . . . 21 5.2 Results . . . 22 5.2.1 Data . . . 22 5.2.2 Correlation . . . 23 5.3 Conclusion . . . 24
5.4 Reflection and improvements . . . 25
References 29
Chapter 1
Introduction
Network traffic analysis tools are one of the many things that are evolving quite fast due to increased request for such tools. These tools are being used for scanning for viruses, attacks and even if employees are doing anything other then what they are supposed to do. These tools are expected to deliver greater accuracy without loosing performance. To achieve more accuracy in the analysis, the tools need to look into the content of the traffic, instead of just the transport data. Looking into the content of the traffic increases the resource need of the tool extensively and despite more and more powerful machines coming on the market, the amount of traffic to analyze increases as well.
A company in Akureyri, Iceland by the name of Stefna ehf. is working on a network traffic analyzing tool, Netvaki 1, that examines the material of traffic, and generates lists to filter out
traffic coming from servers that serve illegal material. The first step of Netvaki’s way of analyzing the network traffic, is to filter out non-interesting and non-important traffic according to the content of the traffic.
This project deals with estimating resource requirements for this filtering process and therefore a prototype of such filtering system was built.
This paper starts off by delivering some preliminary background material in chapter 2 including information about HTTP and the OSI reference model. The project is presented in chapter 3, where a description of the project is given, main requirements are cited and how they effect some decisions. Then in chapter 4 the design and implementation of the prototype is presented and thereafter, I describe the evaluation of the project along with the results from evaluation in chapter 5, and finally I will go over the key points together with a discussion on further research. Appendix A includes all the source code of the prototype.
Chapter 2
Preliminary background information
This chapter introduces preliminary material on several items that are discussed in this paper. Ba-sics of network layers, the HTTP protocol and web caches are briefly described herein. Information about network sampling is given and the difference between content and transport traffic discussed. In the end a summary of what computing resources are is presented.The OSI seven-layer model
In order to aid discussions of networks and their components we use the traditional OSI reference model. The Open Systems Interconnection Reference Model (OSI model) has seven layers, where each layer has a special function to carry out, which it does by some protocols. Following is a brief description of each layer in this model[10]:
• Layer 1: Physical layer: The physical layer defines all electrical and physical specifications for devices. Wires, fiber optic cables, hubs, modems, etc. are parts of this layer, and they communicate by sending bits or signals.
• Layer 2: Data link layer: The data link layer is responsible for transferring data (frames) between network items and to detect and correct errors from the physical layer. Here the Maximum Transfer Unit (MTU) is very important, and stands for the maximum byte size that is allowed enter this layer. The MTU plays a big part of this paper.
• Layer 3: Network layer: The network layer is responsible for transferring data items called datagrams or packets from a source to a destination. Addresses in this layer are chosen by the network administrator and are arranged in a hierarchical manner which allows for network routing. This layer also handles flow control, segmentation/desegmentation of packets from the transport layer, and error control.
• Layer 4: Transport layer: The transport layer deals with transporting segments from the upper layers to the network. This service is reliable and transparent.
• Layer 5: Session layer: The session layer handles the dialog between end-user application processes. Adjournment, termination and establishment of checkpoints are among the things that this layer does.
• Layer 6: Presentation layer: The presentation layer allows the application layer to forget about how data is represented. This includes MIME encoding, encryption, etc.
• Layer 7: Application layer: The application layer handles communication with the application process itself and delivers it onto the next layer.
Network traffic flows from layer 7 of the sender down to the 1. layer, over the physical link arriving at the 1. layer of the receiver, where the traffic flows up into the application layer. Figure 2.1 displays this movement of traffic.
Figure 2.1: The flow of network traffic through the OSI 7-layer model[8]
HTTP
HyperText Transfer Protocol is the most used protocol of the Application layer protocols. It is the primary item in the World Wide Web. HTTP needs a client and a server. A client sends a request to the server who will respond in some manner. A Request can be of one of the following: GET, POST, DELETE, HEAD, TRACE and CONNECT. Each as a purpose but GET is the mot common one, and the only one that concerns this paper. A get request from a Firefox browser on a GNU/Linux machine looks like this:
GET / HTTP/1.1 Host: www.stefna.is
Accept: text/xml,application/xml,application/xhtml+xml,text/html;q=0.9,text/plain;q=0.8,image/png,*/*;q=0.5 Accept-Language: en-us,en;q=0.5 Accept-Encoding: gzip,deflate Accept-Charset: ISO-8859-1,utf-8;q=0.7,*;q=0.7 Keep-Alive: 300 Connection: keep-alive
The responses have a numerical code, followed by an header and then the file. In this header there are several items that have a meaning to the client, like what kind of file it is, date, server information, etc. The corresponding response to the request above (stopping after encountering the beginning of the HTML document):
HTTP/1.1 200 OK
Date: Sat, 09 Apr 2005 13:10:54 GMT
Server: Apache/2.0.52 (Gentoo/Linux) PHP/4.3.9 X-Powered-By: PHP/4.3.9
Set-Cookie: PHPSESSID=a8e11039ba77219bf0bf3a092385fd49; path=/ Expires: Thu, 19 Nov 1981 08:52:00 GMT
Cache-Control: no-store, no-cache, must-revalidate, post-check=0, pre-check=0 Pragma: no-cache
Keep-Alive: timeout=15, max=100 Connection: Keep-Alive
Transfer-Encoding: chunked
Content-Type: text/html; charset=ISO-8859-1 <!DOCTYPE html
PUBLIC "-//W3C//DTD XHTML 1.0 Transitional//EN"
"http://www.w3.org/TR/xhtml1/DTD/xhtml1-transitional.dtd"> <html>
...
A HTML document can include links to other files, that the browser will then fetch, the same way it did the HTML, by a GET request. In the HTTP header there is a mandatory item describing the type of file was fetched. This is the Content-Type item. The Content-Type as two parts, the general category it is in and the type itself. In the above sample, the file is a text document of HTML type. This is in fact the most common file type for text documents, and is referred to as the HTML document.
Proxy
A web cache or a Proxy, is a service that runs on a server and caches web pages and files attained from web servers. The client is configured to use one, and from there on, the client sends all requests to the proxy, who does is own request to the web server, get the response, and sends it back to the client. This way, the client never accesses the web server by itself. This is useful for protecting the client, and is often used also to filter out unwanted material. Note that by using a proxy, the server never knows exactly who is getting the information, and the client really does not know anything about the server it is getting the information from.
Network Sampling
Network sampling is the process of taking a sample of network traffic. This process is done at the physical layer, so the sampling device must be physically connected to the line being sampled. Sampling is primarily done in network debugging, analysis and criminal intent.
There are two things to consider while sampling: obtaining copies of the traffic, and filtering the traffic to obtain the relevant information. Following are the four most common ways to obtain the traffic:
• HUB: A hub is placed on the line being taped so that it can broadcast all traffic to the analysis machine.
• SPAN: Switched Port ANalysis is a special way of having a switch broadcast a copy of traffic to and from a port to another port
• TAP: Test Access Port is the preferred way of tapping a line. It is a designated device that replicates network traffic on a line and sends it to a special monitoring port
• Gateway: If a all traffic flows through a single server, called the gateway, this machine can run the analyzing tool.
Each technique has its pros and cons. HUBs are inexpensive but they can only handle half-duplex traffic and therefore can not handle extensive traffic loads. The SPAN method can be done easily on most manageable switches today, so setup time and planning is to a minimum. However, the switch can be flooded with traffic if the traffic load is up, since it is cloning the traffic. SPAN can also monitor multiple ports. TAPs have many advantages such as that if they go down, the traffic can still flow through, this is a very small device, and it can easily handle whatever traffic load it gets. The big disadvantage of this equipment is the price. Cost of TAPs range from the price of small server up to ten times that. Gateways servers can easily be used for obtaining traffic. They require no extra cost, since they are already there, but need to allocate resources for the analysis. Thus, might need more hardware, and are not able to perform their other function if they are there. When filtering for data, the OSI model must be considered along with the idea of the two different types of traffic. Filtering can be done at any of the layers in the OSI model, but the outputs of the layers are different between the layers. Table 2.1 gives a brief description of what to filter for each layer.
Layer Data unit Purpose
Physical layer signals debugging of lines and devices
Data link layer frames debugging device drivers
Network layer packets debugging network stack of operating systems
Transport layer segments analysis of meta-traffic
Session layer and above data analysis of meta- and content-based traffic
Table 2.1: OSI layers and filtering
Content vs. Traffic data
There are two types of network traffic to consider: content-based traffic and descriptive traffic. Descriptive traffic is the network traffic that deals with making the all the different protocols work, and can be thought of as meta-traffic. Most of this type of traffic is based on the lower layers of the
OSI model, such as the network, transport and session layer, although that is not always the case. Examples of meta-traffic that reside in the upper layers are the DNS lookups, ARP lookups, HTTP requests, FTP control commands, etc. Content-based traffic is the collection of all network traffic that contains data regular users are after. This kind of traffic can only be in the upper layers, or the layers above the TCP/IP model, but the real problem is when the meta-traffic is in the same layer as the content. Using the same example as above: the HTTP data response containing the HTML and the images gotten from IMG HTML tags are all content-based. Things get even more uncertain when thinking about HTML itself. There the content is tangled with the HTML tags, which do not have a specific meaning to a user as content, and therefore should be considered as descriptive traffic.
Resources
Computers need resources to function. These resources can be memory, CPU cycles, disk space and more. The memory is needed to store information and programs that are being worked on, CPU cycles are used to perform actions, disk space is used to store static data that is currently not being worked on, and network access is needed to communicate with networks. The network load of the network is also very important, especially when performing analysis of network traffic.
Resource requirements of machines are dependent on the purpose of the machine. Some ma-chines are built to focus on the users (the higher layers of the OSI model), while others are focusing on handling high network loads and perform actions on the lower levels of OSI model. A machine focusing on most or all the network layers will need more resources than others that focus on fewer layers.
CPU load in GNU/Linux is measured in jiffies, which is 1/100 ms, and is the way GNU/Linux is set out to measure loading information for processes and the whole system. Network load is normally measured in bits per second, or even bytes per second, usually in kilo- or mega-bits per second. Memory is measured in bytes, usually in MBs.
Chapter 3
The Project
This chapter gives the motivation for the project, details the requirements and itemizes many decisions made regarding the project.
3.1
Description of project
The Netvaki project deals with helping firewalls filtering out unwanted material by using methods of data mining and machine learning. Using methods like data mining and machine learning requires much computations, so to help improving the performance of these methods the data that is to be mined or learned must be stripped of everything that does not have effect on the outcome of these techniques. This means that packets such as normal TCP control packets can be discarded, because they do not contain any information about the material of interest. Packets containing sounds or any other material that is not content related text are also discarded because they most likely are only used for making the experience a little better.
While using HTTP as an example, the only document type that really contains information about the content of the web page, is the HTML document. The HTML document itself might be non-important because it might not contain the material in question.
Non-relevant traffic should be filtered out before the real analysis tools begin their work. The problem with filtering these things out, however, is that the packet must be dissected all the way up to the application layer (7. layer). This introduces many issues that are described in chapter 3.2.
To create meaningful estimates, a prototype filter was built. Other currently existing programs are not good enough for our purposes, as it is described in chapter 3.3.
3.1.1 Requirements of Netvaki
In addition to which layer to filter at, the Netvaki project put forward two requirements that effect the design of the prototype.
First of all, the placement of Netvaki will effect what can and will be filtered out. Netvaki will reside at the ISP level, where users cannot turn it off, or in any way get around it. By doing this, the total number of instances of the tool is lowered, and also allows for doing the analysis using a tool built to run on a multi-processor machine. Further, Netvaki is kept on theInternet side of
the ISP, meaning that it is the first unit a network packet goes through on its way to the user. This is in part due to privacy issues. By taking out the address of the user of the ISP, personal identification is impossible and many potential legal issues are avoided.
The second requirement has to do with performance. Analyzing network traffic for an ISP obviously needs quite a lot of power, and therefore, the Netvaki project will require a multi-processor machine to work on. Hence, for performance reasons, the prototype was designed to take full advantage of using more than one processor.
3.1.2 Prototype decisions
The purpose of building the prototype was to gaining some knowledge of the resource requirements for this kind of a program, several decisions were made regarding the magnitude of the project.
In this project, only HTTP traffic will be examined. Thus, all other upper layer protocols are discarded. HTTP is very common way of using the Internet, and is probably the most used way of getting information today. All exceptions from the normal network traffic will be discarded to minimize the time spent on the HTTP protocol itself.
The analysis will be confined to textual searches; meaning that only text is examined. The prototype will try to find IP addresses of servers that contain information about a given topic. The topic used will be concerning java and its API. Note, that it really does not matter what topic is chosen, it only has to do some searching.
3.2
Issues
There are plenty of issues involving upper layer network traffic analysis, specifically HTTP. Solutions to the issues raised here are considered in section 4.
3.2.1 Performance
Analyzing traffic at the ISP level requires that the software should at least be able to analyze traffic up to 1Gb/sec for a normal sized ISP. Even the biggest ones in Iceland are using that amount of traffic. Examination of Cisco PIX data sheets [4] suggests that a PIX that can handle traffic of 1.7Gb/sec is merely a 1GHz machine. The PIX however, only looks at headers of the traffic and does not deal with compression and segmentation is not an issue there because they do not examine the payload itself. Also, the PIX firewall is uses a specially built operating system that is built for this purpose only. That way they keep the hardware requirements down. By looking at these numbers, one can assume that analyzing the payload will cost more CPU power.
One way to solve the performance issue is to have separate processes doing separate jobs. This suggests a concurrent solution (as will be described in section 4), a solution in which a process that does desegmentation, while another is decompressing the document, while yet another one is searching full uncompressed documents for special keywords. This concurrent solution will be more effective than having one processor trying to do all of this sequentially for all packets.
Another way of solving this problem is to have multiple machines. Each machine could perform a task such as the separate processes before. This however has much more cost associated with it, and creates several problems with management.
3.2.2 Segmentation
Segmentation of network traffic is when a packet is split into segments in order to fit the maximum transfer unit (MTU) of a network. Normal Ethernet MTU is 1500 bytes. Most upper layer content related packets are much more than that, so most of this kind of traffic will be segmented. Since the analysis is done at upper layers, the analysis tool will most likely need to have the whole packet to analyze it, though some analysis can be performed on the segments themselves. The process of putting the whole packet together is called desegmentation.
In order to reconstruct the whole packet, all the segments of an incomplete packet must be kept in memory. This should not be a big problem for most HTTP HTML traffic, since normal HTML document rarely exceeds 2 MB. However, this could be a very big problem for protocols that deal with large files such as FTP. Focusing on HTML documents, another problem emerges, HTTP traffic is stateless; meaning that HTTP connections do not have to close, and therefore, it is difficult to determine the last segment of a packet. To accommodate this situation, the HTTP/1.0 specification [6] introduces a header itemContent-Length. This item allows web servers to include the length of the responded message if the server knows that it will not close the TCP connection. Unfortunately, the Content-Length is not required by the HTTP/1.1 specification [5] even though the connection is not terminated.
3.2.3 Compression
Compression was a very crucial part of network traffic a few years ago. It still remains much used, but because of increasing speeds of networks, this feature is beginning to be less used. Compressing packets before they are sent usually does not take much time because normal packets are not so big. Protocols typically have an upper limit of the size that should be compressed, due to CPU power and memory that is needed to compress and decompress.
Many web servers, including Apache, have a option of compressing material before it is sent. The methods of compression allowed in HTTP are gzip, deflate and compress [6]. These are public/open methods of compression, and most browsers include support for them.
Decompressing an HTML document requires the whole document to be used, so decompression will take place after desegmentation. Despite the obvious disadvantage of this, there is a good side to it. Since web servers need to compress the document as a whole, the Content-Length of it is available.
3.2.4 Encryption
Today, privacy and other security measures require much of network traffic to be encrypted. This is of course a problem when analyzing the traffic. There is no way it would be computationally acceptable to try to decrypt all encrypted packets. Though it might be possible, it would just take too much time.
The way around the need to decrypt all packets in order to analyze the network traffic, we could look at the transport data instead, and perhaps create a profile of use, by, for example, calculating the percentage of traffic that is encrypted. However, even this can be difficult, since tunneling encrypts some or all traffic data. With IPSec, this is not possible, unless the transport data of the IPSec traffic itself is used.
3.2.5 IPv6
IP version 6 (IPv6), has a few problems and they exist in the security part of the protocol. In the future, some sort of IPSec will be built in it, which will introduce the same problems as mentioned in the encryption section. Today, IPv6 is not in general use and there are no intentions of usage in near future.
3.2.6 Privacy
For legal reasons, we need to ask: Are network analysis tools allowed to look at content related traffic? The quick answer is no. However, ISPs do it all the time, they scan your emails for viruses and SPAM. There is a general acceptance of using virus and SPAM scan engines to browse through content related email. The big question is: will the same acceptance be associated with overall network traffic?
3.2.7 Proxy
Proxy servers are a very popular for local area networks, especially in big corporate environments. Proxy servers are used to control the access of the employees as well as lessen the network load of the Internet connection. ISPs are using proxies for the same purpose. Due to the nature of proxies, some traffic data is altered and depending on which side of the proxy you are on, you are denied access to either the client or the server.
In a traffic analysis where addresses of both the client and the server is needed, having a proxy makes things more complex. There are different ways to implement a solution to this type of proxy problem. Building an extension for straight communication between the proxy and the analysis tool, is one way to go, while another solution include installing the monitoring tool on both sides of the proxy, and do the connection matching itself. Yet another solution is to have the analysis tool sit on the client side of the proxy, and dig into the HTTP proxy requests for URLs and host names, and use those to change the incoming packet accordingly.
If the analysis does not need either client or server addresses, the tool can be placed appropri-ately on the right side of the proxy, and discard the information that is not needed.
3.2.8 HTTP
Aside from the issues mentioned above, the HTTP protocol as described in 2 effects many possibil-ities for shortcuts in the analysis. First of all only responses with code 200 are basically important, along with the request itself. Secondly, unless you need to try to analyze image, videos, or even stylesheets, the content document1 is the most important part of the analysis. If you are able to skip all except the content document then most of the traffic load can be dropped.
1Here the content document is though of as text/html, text/plain, and text/xml. All the text files that contain
3.3
Related work
There are quite a few network analysis tools being used today and some are better than others. After considerable amount of time spent on searching for good tools to do the job, I found that the most likely ones would be Snort, tcpdump and Ethereal. These tools are open source, so they could be modified if needed. However, these tools do not take any steps towards utilizing multi-processing, and filtering at the upper layers needs to be specially built. Therefore, these tools cannot help this project in any other way, than just giving ideas of how to do certain specific things like decompressing HTML documents and general TCP connection tracking.
This project is unique because it specializes in using multi-processing machines to increase performance, thus creating different results from the rest of the tools. According to my study no one has tried to build estimates that deal with upper layer network traffic analysis.
Chapter 4
Design & implementation
Herein the design and implementation of the prototype is described. The techniques for obtaining network traffic are enumerated, and the architecture and code implementation of the prototype is described in detail.
4.1
Sampling the traffic
The Netvaki project team does not have a preferred placement for the tool itself. Therefore, any method of getting the traffic as described in section 2 can be used. I choose to use a Gateway. (see section5.1 for details on why this particular method was selected). By using this method, no extra hardware or software is required and there is no need to change anything in the environment.
4.2
Solutions
In section 3.2 the issues related to network traffic analysis at the upper network layers were pre-sented. In this section each of these issues is discussed separately, and designed solutions are presented.
Performance
The performance issue really influences the architecture of the prototype software. The requirement for multi-processing is met by using threaded pipeline of filters. Each thread will be able to be run on separate processor if possible, and work on its part of the filtering process. Using a pipeline helps distinguish between the tasks, and delivers a simple but powerful way of exchanging data. The pipeline was chosen because each thread has to finish its job, before the next one continues filtering (if needed).
Segmentation
The process of desegmentation in the prototype is as follows: If a segment contains an HTTP header but not Content-Length, then that segment will be regarded as the only segment in the packet, and therefore, the whole packet. Note that there is no attempt to look for closing connections. The
reason for that is that if a FIN packet is expected, and it does not arrive, then there is perhaps a large portion of memory that will never be used again. The way around that problem can be implemented by using periodic checking for packets that have been there for too long.
If the segment contains an HTTP header and the Content-Length, the following segments will be appended to the previous segment, until that segment has reached a similar size as the content-length value designated. Note, that after quite a bit of HTTP traffic analysis using Ethereal, I noticed that some packets did not have the exact length, so there is a leeway for packets to be 10 bytes more or less that the content-length proposed.
If a segment does not contain header data, then it will try to find a match in the segmentation table described in section 4.3, and if there is no match the segment is deleted. Note, that this leads to some traffic data not being analyzed. The reason for deleting instead of trying to analyze, is that the segment might lead to misjudgment because the context is not right. Also, unpacking cannot be done on incomplete data.
Compression
The check for compression, just checks the HTTP header for Content-Encoding to equal compress, deflate or gzip. From there the data is uncompressed into a big buffer, and from there the newly uncompressed data is used to generate a new packet containing all the headers from the compressed packet, and then the compressed packet is deleted.
If there are any errors while trying to decompress, the packet is deleted. There is no reason for trying analyze compressed data in the same way as uncompressed because compressed data is in binary form, and cannot be analyzed textually without decompress it first.
Encryption
This prototype does not solve the encryption issue. Since its general goal is to perform textual analysis of the HTML documents, there is no need for the transport traffic data that follows the encryption, and as said in section 3.2.4 it is computationally too hard to decrypt packets.
Privacy
By following the Netvaki requirements and architecture, there is no need to address this issue. Proxy
By following the Netvaki requirements and architecture, there is no need to address this issue. HTTP
The prototype will only focus on HTTP response 200 and text files of type HTML. Plain text, XML files and other content documents could be a part of this, but since the analysis of those files is identical to the HTML one, and that these files are not as common as the HTML files, they are not used.
4.3
Architecture
The architecture of the program is a multi-threaded pipe-lined filter. Each filter is a thread that gets a input and delivers output. The pipe itself is created from scratch using a thread-safe first in first out queue. Following are the main parts and the classes of the program as well as descriptions of each part. Figure 4.1 shows the relationship between the threads of the prototype.
Figure 4.1: The overall architecture of the prototype
Main
The main thread serves as the coordinator. The main thread starts everything up, initializes all threads and variables, and fetches counting data from the other threads. The main thread also contains code to handle all signals, including the reconfigure signal (SIGHUP) and termination signals. When a termination signal is found, the thread tries to stop all the other threads, by calling their stop method.
Once all threads are started, the main thread fetches the newest counts from the threads every 1 second. Method calls from the main thread get the counts, that are then outputted to the screen1. The counters include: number of packets coming in, total size of the packets, user and sys-tem CPU usage in jiffies, current number of isys-tems along with maximum number of isys-tems for the segmentation table, and also the number of items in the last filter’s answer table.
NetworkReader
The NetworkReader is the thread that does the actual traffic sampling by getting the packets of the network interface, and creates Packets. The reader discards all traffic not coming from TCP port 80, i.e. HTTP responses. Furthermore, it checks to see if the payload of the packet is more than 10, because 10 is the number of bytes that can be used as a leeway in the desegmentation
process. This removes all control messages, such as the TCP three-way handshake, and others that do not contain any content.
Packet
The Packet is created each time a valid packet destined for Filter2 from the NetworkReader. The packet is a class that contains a string of bytes, i.e. the packet itself, also has pointers to the Ethernet, IP and TCP headers with the possibility of referencing those with the right semantics. Meaning that to get the TCP source port, we do packet.tcp.src portand it automatically find the reference to TCP in the packet, and find the source port from there2. The packet also contains
sizes of all headers in the packet along with the payload size.
There are two constructors for Packet, one for the NetworkReader, where only the string of bytes from the network interface is copied, and the other for the Segmentation table to recreate on Packet from two others. Other than the constructors and the destructor, Packet does not have any functions, all done to minimize the extra memory needed to create a Packet. Remember, Packet is create every time the reader reads a valid packet.
Filter
The Filter class is the super-class of all the Filter classes (segFilter, HTTPFilter and IPList filter). This class contains methods that are common to all of them, such as the interaction methods that are called from the Main thread for counters. Semaphores are used to ensure mutual exclusion of the counters.
segFilter
The segmentation filter thread gets the Packet from the reader, and tries to create a Header object from the Packet. If the Packet does not contain a HTTP header, the header return an error, else it creates a Header object that will be associated with the Packet by creating a HTTPPacket. From the Header object, the response code and the file type is read, and HTTPackets with the wrong code or file type are discarded. The packets that get through carry on and next the Content-Length is read, and if it is valid, and needs more bytes, the HTTPPacket is put in the segmentation table. HTTPPackets that have the whole content are sent directly to Filter3.
Packets not containing an header, are sent to the segmentation table in order to search for parents. If no parents are found, the Packet is deleted. (See following section for detail on the segmentation table). If a parent was found and the HTTPPacket has all its bytes, it is sent to Filter3.
Segmentation table
The SegTable object resides inside the Filter2 object. It contains a static table of 1000 items of type segitem. Segitems are a struct with HTTPPacket, length of that packet, and a flag whether the item is free or not. A static table was chose to lessen the load of the machine due to memory allocation.
When the first segment is sent to the table, it finds a free item, and the HTTPPacket is placed there, and the length of the item is set to the length of the total payload size. For each segment that follows the table is searched for a prior segment that has the same TCP destination port, TCP ack number and IP source address. If found, a new Packet is created from the parent and the new packet. The reference to the Packet in the HTTPPacket object is then updated to the new Packet. When the full length of a HTTPPacket is found, it is removed by only setting the segitem free flag to true and that packet is returned.
Header
The header class is used to get and maintain the HTTP header of a packet. Its constructor takes in a reference to the Packet, and checks if the packet is a header by checking if the first 4 bytes are “HTTP”. If that fails, no other actions are taken and the error flag is set for the header. However, if it works, then the HTTP header items are read sequentially into a static array of headers.
Methods such as getResponse and getValue search the array for matching item, and return the corresponding value.
HTTPFilter
This filter gets HTTPPackets from the segFilter. First task is to check if the encoding matches some of the compression types. If the answer is yes, then an attempt to unzip the packet is made. (The unzipping process is discussed in section 4.4).
The next task is the textual analysis. Regular expressions are used for the search. The regular expressions are read in through the configuration file and then compiled. There can be up to 15 regular expressions, all with the maximum length of 100. These regular expressions are associated with points that are given when a pattern is found. By using this method, one can both expand and narrow searches, and use this to control the searching in any way.
If a document is scored at 70 points or more, an HTTPItem is created and sent to Filter4. The documents that do not reach the threshold are deleted.
HTTPItem
HTTPItem is a small class that contains the packet number, points given, IP source address and the size of the Packet. Note, that it does not contain any reference to any Packet or HTTPPacket. IPList filter
This is the last filter thread. This filter maintains the IP table of the matched sources. HTTPItems coming from Filter3 are put into an array of HTTPItem only if the total points of an item does not exceed a certain threshold of 500 points. This is done to minimize the memory usage of the program.
BQueue
The BQueue class is used as the thread-safe FIFO queue between the filters. It uses a producer consumer in a bounded buffer paradigm. Use of signal and wait ensures mutual exclusion on the
data buffer. The buffer can contain 16384 items, and each item is a pure pointer to an object using Cs void pointer and casting it to the right type after the pointer has been fetched from the queue.
4.4
Implementation
This section contains a description of the prototype implementation, comments on particular lan-guages and libraries used in the implementation are given.
• Language: The prototype was implemented in C and C++, mainly for performance reasons. Although most code is in C, C++ classes are used to utilize the constructor and destructor features for objects instantiated therefrom. I chose C and C++ for programming languages, since they are known to produce very fast code. I mainly use C style of coding, except for I am using C++ classes, because of the convenience of constructors and destructors and also because I have experience in that language.
• Operating System: I choose GNU/Linux for the operating system to be used, because devices are presented in an uniform way of block and character devices. This uniform way allows a program to listen on ANY network interface, and therefore, allows the programmer to listen to more than one device at a time. Further, GNU/Linux is a very stable and secure operating system that makes the programmer’s life a little easier by including source, header and instruction files where they need them.
• Libraries:
– pthread: Since Linux was chosen, the pthread library is the best step for threading. Linux maintains the threads in the kernel, and therefore, can schedule the threads onto multiple processors easily and effectively. Note, in Linux kernel headers 2.6 these threads are not split onto separate CPUs, but rather processed as one process. To use the pthread effectively on a 2.6 kernel, the following command is needed before running the program:
export LD ASSUME KERNEL=2.4.1.
I also found a very interesting class POSIXThread[22] that creates a virtual thread class that uses the pthread library. This allows for creating an Object Oriented thread class. Inside the pthread library, are also routines that are called conditions, where the pro-grammer can tell a thread to wait until it get a signal. The signal can then be signaled to the next thread waiting, or even a broadcast to all. This is used in the BQueue class to ensure that the buffer is not accessed by two threads at the same time.
– libpcap: PCAP library[23] is the most used packet capturing library in the UNIX envi-ronment. This hides all the issues with actually sniffing a network interface, and allows the programmer to simply capture packets.
– zlib: The zlib library includes functionality to compress and decompress data in deflate and gzip format all in the same inflate function. The actual unzipping method is derived from the tvb uncompress of the tvbuff.c file in the epan directory of the Ethereal source code[24].
– regex: I use the POSIX regular expression library for regular expressions (RE). This is the most common RE library used in GNU/Linux. They are really easy to use, and for programmers that have to deal with REs this is a must have library.
• Process and machine loads: In GNU/Linux every process has a directory in the/proc direc-tory containing a file statthat holds the number of jiffies that the process has had the CPU for, both user and system time. There is also a file/proc/stat that holds information about the total amount of jiffies the CPUs have performed for, along with the total number for all processors.
I found the best way of getting this information was to keep the process ID for all threads and read from the corresponding/proc/¡pid¿/stat file and the total CPU file. This is done each time the Main thread gathers the counters and prints out.
• Compiler: I use the standard GNU C++ compiler, g++, which is a part of the known gcc compiler. In GNU/Linux, using this compiler is the easiest and most common. I also use their debugger gdb for most of the debugging, along with the ddd[25] helper tool.
Chapter 5
Experimentation
To evaluate the prototype and to be able to derive some conclusion about the estimation, some testing was performed. This chapter discusses how the experiment was designed and how the results are to be interpreted.
5.1
The method
This section describes the methods used to test and evaluate the prototype. Included are methods to build statistics of the program’s CPU usage, and observations on how network traffic loads effect CPU usage.
The test site was the computer science computer lab of University of Akureyri (R316). It has around 30 Linux client machines and all traffic flows through one server (viti). Viti has 4 Intel XEON processors of 2.2GHz each, all supporting hyper-threading. Thus, the Linux operating system treats the server as if it has 8 CPUs when running a threaded program.
One of the biggest problems encountered in this project was the problem of generating network traffic for testing purposes. The traffic must at least include HTTP packets, so the program can do some work. It should be possible to generate traffic up to 80Mb/sec, so that it is easier to see what happens at extreme loads. I created a small shell script that utilizes the wget utility. Wget has options of recursively crawling through web sites, following all links they encounter. By using wget I can manually pick a website, and make wget generate the traffic itself, also by using wget, no hits will be detected as cached. The script spawns 6 wget processes for separate web sites.
I used a remote connection to the client computers of the lab to run the robot crawler. At most I was using 14 computers at one time. The traffic load was controlled by the number of clients running the robot. I had problems with generating a steady stream of packets coming in. There were gaps in the flow, which lead to non-normal distribution that makes deriving statistics much harder. These outliers are usually at the upper boundaries of the network load, so to fix this I had to generate more load, and just simply cut out the outliers afterwards.
Besides testing the network load versus the processor load, I took a look at how different regular expressions had an effect on the CPU load. I tested with 1, 5 and 10 regular expressions. I structured the REs as such that they narrow the search down with each RE. This can give results that show how much output can decrease with each pattern, and maybe find a limit of how many
REs one should use, before CPU load starts to get effected.
All the output from the prototype, i.e. all the information about the network load and the cpu load is saved into a file, and then later processed using statistical analysis tool such as Open Office Spreadsheet and SPSS. The statistics are then used to generate predictions about the state of a machine when under certain network traffic load. This statistic can also be used to show what part of the process is most demanding, and what is the least demanding.
The execution of the experiment had 6 parts; for all three pattern numbers 1,5 and 10, the experiment ran with both 2 client and 7. The single pattern was simply the word java. Thus, it performs a basic word search. The 5 patterns were aimed at trying to find java APIs by including several words contained in the official API for each of the 5 patterns. The last one was designed to bring more accuracy to the 5 pattern search, by holding more patterns but an equal number of items in the pattern. There was also a test run with 14 clients and 1 pattern, to help seeing how accurate the predictions are. Each test ran for 2 minutes, producing 120 cases of data. The filter began execution after the robots had been started and the filter was stopped before the robots were stopped.
5.2
Results
This section describes and discusses the results from the testing. I will go through the statistics that were derived, and make suggestions on what they mean.
5.2.1 Data
By exploring correlations of individual variables of the data, only a few variables were decided to be significant, and the rest of the variables were discarded.
Following is a list of the significant variables. Note that the number of jiffies consumed be a thread in a second is a measure of the how much of a CPUs time the thread takes. Since one processor executes 100 jiffies in a second, the number of jiffies consumed are also the percentage of usage for a single processor. The consumed jiffies represent the load of a thread.
• Load of reader thread.
• Load of segmentation thread.
• Load of the search thread.
• Total load of the program.
• Network traffic load, in kilobits per second.
Variables such as the load of the unzipping thread and the IP list thread not significant because they did not consume any considerable amount of jiffies. The main thread however is discarded here because its load was generated when creating this data.
From hereon, the significant data is referred to as data and the discarded data is not considered further.
Kb/sec 20000,0 19500,0 19000,0 18500,0 18000,0 17500,0 17000,0 16500,0 16000,0 15500,0 15000,0 14500,0 14000,0 13500,0 13000,0 12500,0 12000,0 11500,0 11000,0 Kb/sec Frequency 20 10 0 Std. Dev = 1864,10 Mean = 15637,3 N = 120,00
Figure 5.1: Distribution of traffic load. 1 pat-tern and 7 clients used.
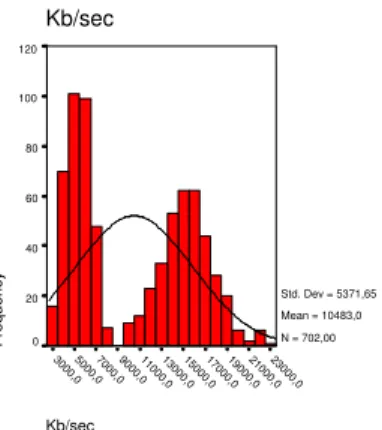
Kb/sec 23000,0 21000,0 19000,0 17000,0 15000,0 13000,0 11000,0 9000,0 7000,0 5000,0 3000,0 Kb/sec Frequency 120 100 80 60 40 20 0 Std. Dev = 5371,65 Mean = 10483,0 N = 702,00
Figure 5.2: Distribution of traffic load. All pattern and clients used.
For each of the 6 individual tests, all the data had a reasonably normal distribution as shown in an example histogram in figure 5.1. However, when all tests are considered the distribution suffers from lack of continuity (figure 5.2), which leads to less descriptive and accurate information.
5.2.2 Correlation
The correlation between the variables is best described in scatter graphs and regression lines. 1 Pattern Search
In figure 5.3 the relation between traffic load and the load of the segmentation thread is shown.
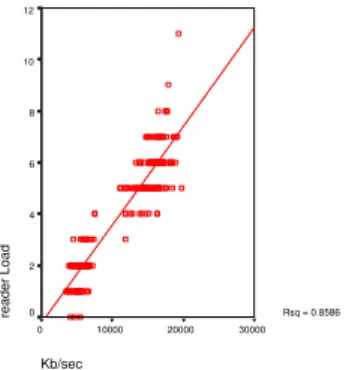
R2 is 0.5931, so there is some relation between the two. This is natural since, there are usually some portion of network traffic that is segmented, and therefore, the segmentation thread needs to work accordingly. As shown in figure 5.4 the reader is also influenced by the traffic load, since the reader is the first thread to encounter the the traffic. The search filter is not showing much traffic in figure 5.5 because there is only one pattern to search for, and the thread seems to handle it easily.
The load balancing of the three major filter is shown in a pie chart in figure 5.6. The search filter does not take up any considerable amount of time, while most of the work is performed by the reader thread.
5 and 10 Pattern Searches
When more patterns are used by the search filter, the balancing of load starts to change. The pie chart in figure 5.7 shows how much the search thread has taken over when it needs to search for 10 patterns.
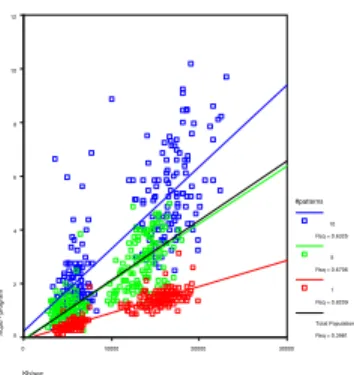
The difference between the patterns is best described in figure 5.8. There is a very clear distinction between the regression lines of each number of patterns group. This filtering effects the overall program load significantly as shown in figure 5.9.
5.3
Conclusion
By extending the regression on the previous covered statistics, the future values of the data can be found according the regression equation. Figures 5.10, 5.11 and 5.12 show the predicted values the reader, segmentation and search threads respectively.
Reader thread
According to the prediction figures, the CPU load of the reader thread will hit the 100% mark at around 150Mb/sec. Many ISPs in Iceland only have a 100Mb/sec link. According to [26] the biggest service providers, Siminn, Lina.net and Islandsimi are able to generate traffic over 150Mb/sec. The Netvaki project is aiming for the biggest ISP in Iceland to begin with, and perhaps later in Europe. These results are bad news for the project, but suggestions on how to improve the performance of the reader are discussed in the following section.
Segmentation thread
The segmentation thread manage a little more network traffic load then the reader, up to 180Mb/sec. According to [26], both Siminn and Lina.net are above that number, and others are near. Again, this is not good for the Netvaki project, although improvements can easily be made to this thread (see next section).
search thread
The search thread however can only handle up to 50Mb/sec using 10 patterns, and 80Mb/sec using 5 patterns. Many ISP and companies are reaching these numbers in their network load, and it is clear that something radical must be done to this thread in order to be able withstand loads of big ISPs. On the other hand using the single pattern, single word search the search thread reaches over the 1000Mb/sec limit, and this is a good sign for Netvaki, who will likely use this to their advantage.
overall
The overall load is related to the number of patterns used, and with more than 1 pattern the overall process will hang before reaching the limit of e.g. Lina.net of approximately 300Mb/sec. Even when considering only one pattern searches (or even no searches), this type of filtering will not work for Lina.net. Major improvements are needed on the whole process, especially if a large European ISP is considered.
Correctness
To see if the statistical analysis was correct, I performed a test of a single pattern using 14 client, generating up to 38Mb/sec. Comparing the actual results from that test with the predicted values, demonstrated that the experiment was a success and the predictions can be trusted.
5.4
Reflection and improvements
Herein, are several suggestions on how the performance of the prototype can be improved. None of the suggestions should involve major change in the program. Further improvements and devel-opment is described in the discussion chapter.
Increasing the performance of the reader can be done by perhaps using multiple readers. Having multiple readers however requires multiple interfaces, or some load balancing between the readers. Reading from multiple interfaces has to do with splitting the traffic at either layer 2 or 3 while using a switch. An extra machine between the network sniffing point and the filtering tool, can also split the traffic according to some routing rules.
Another way to enhance the readers performance is to rewrite or skip the pcap library. The library has several function that are not needed, and therefore, can be skipped. Writing a very simple and fixed solution might allow for significant increase of traffic load being read before CPU load hits critical levels.
The segmentation thread is only using a simple array, and will go through the whole array if needed to find a match. Using a tree structure should be very easy to implement, and will bring the segmentation search to O(logn) from O(n). There is also a choice of having more than one segmentation thread, but still use the same data structure.
Improving the search thread is not needed when using the single word pattern, and by creating a pipeline of such filters, the search can be executed on more than one CPU. By creating several copies of the current search thread, and load balance between them, the searches can include more patterns and they can be more complex. There are also other methods of searching than can improve both the performance and accuracy of the search.
Kb/sec 30000 20000 10000 0 seqFilter Load 20 15 10 5 0 Rsq = 0.5931
Figure 5.3: Relationship between segFilter load and network traffic load. 1 pattern used
Kb/sec 30000 20000 10000 0 reader Load 12 10 8 6 4 2 0 Rsq = 0.8586
Figure 5.4: Relationship between reader load and network traffic load. 1 pattern used
Kb/sec 30000 20000 10000 0 searchFilter Load 3,5 3,0 2,5 2,0 1,5 1,0 ,5 Rsq = 0.2512
Figure 5.5: Relationship between search
thread load and network traffic load. 1 pat-tern used 9,3% 41,3% 49,4% search segFilter reader
Figure 5.6: Distribution of load using 1 pat-tern 75,5% 11,1% 13,4% search segFilter reader
Figure 5.7: Distribution of load using 10 pat-terns
Kb/sec 30000 20000 10000 0 searchFilter Load 70 60 50 40 30 20 10 0 #patterns 10 Rsq = 0.5073 5 Rsq = 0.5331 1 Rsq = 0.2512 Total Population Rsq = 0.2113
Figure 5.8: Relationship between search
thread load and network traffic load
Kb/sec 30000 20000 10000 0 %cpu - program 12 10 8 6 4 2 0 #patterns 10 Rsq = 0.6325 5 Rsq = 0.6706 1 Rsq = 0.8209 Total Population Rsq = 0.3981
Figure 5.9: Relationship between program load and network traffic load.
Kb/sec 1000000 800000 600000 400000 200000 0
reader - %of 1 cpu
100 80 60 40 20 0 #patterns 10 Rsq = 0.8601 5 Rsq = 0.8032 1 Rsq = 0.8586 Total Population Rsq = 0.8477
Figure 5.10: Prediction for the load of the reader thread according to traffic load
Kb/sec 1000000 800000 600000 400000 200000 0 segFilter - % of 1 cpu 100 90 80 70 60 50 40 30 20 10 0 #patterns 10 Rsq = 0.6550 5 Rsq = 0.5321 1 Rsq = 0.5931 Total Population Rsq = 0.6019
Figure 5.11: Prediction for the load of the seg-mentation thread according to traffic load
Kb/sec 100000 80000 60000 40000 20000 0 searchFilter Load 100 90 80 70 60 50 40 30 20 10 0 #patterns 10 Rsq = 0.5073 5 Rsq = 0.5331 1 Rsq = 0.2512 Total Population Rsq = 0.2113
Figure 5.12: Prediction for the load of the search thread according to traffic load
Chapter 6
Discussion
The project described herein, was designed to help the Netvaki project team estimating needed resources for network traffic analysis that analysis at layers above the transport layer. The project also makes the first steps of building the primary sniffer and filter for Netvaki easier by creating a prototype of such tool. Further, the project discusses ideas for improving the prototype for increased performance.
Aside from helping the Netvaki project, this project contributes to interested parties resource estimation along with bringing out issues with network traffic analysis at the higher layers and how they can be solved in a multi-processor environment. Research on this specific topic has not been available, and now that machines are becoming more powerful, companies will begin creating devices that work on the higher levels. This paper should benefit those companies.
As with all things, this is not a complete study. This is merely the beginning. Further studies include improving the efficiency of this project’s prototype described in section 5.4, altering the prototype to allow for the filter to reside on different machines and thus, creating a distributive analyzing tool, and since this project decided to discard issues like proxy, missing content-length and file types other than text/html, solutions for these issues is need for the general analyzing tool. Even further research on the data and its statistics can be performed without making extensive changes to the prototype. Creating more conclusive and extensive data sets to work out statistics and estimates with more accuracy is very important, as well as extending the experiment to include data on IO and memory usage. To gain a better estimation of the actual computing power needed, the experiment can be performed using different types of machines, single processor, more than 8 processor machines, slower and faster machines, etc.
There are plenty of possibilities for studies in this field, and hopefully there will be many more. At least I will continue to develop and improve this prototype even further along with helping the Netvaki team create their solution.
I would like to say that this project was a partial success. A prototype was created and used to create estimates of resources. However, the time it took to design and build the prototype exceeded all time-plan by a big margin. I would have liked to use the time for more data building, and perhaps some of the improvements described in section 5.4. Nevertheless, many issues were found and some solved, some ideas of the resources needed was proposed and ways to improve the performance of the prototype were introduced. So, all in all, the project was a success.
Bibliography
[1] A. Escudero-Pascual, I. Hosein, Questioning Lawful Access to Traffic Data, ACM, 2004. [2] Andrews, Gregory R. 2000.Multithreaded, Parallel, and Distributed Programming. United States
of America. Addison-Wesley.
[3] Moore, David S. and McCape, Gregory P. 2003. Introduction to the Practice of Statistics. New York. W. H. Freeman and Company.
[4] http://www.cisco.com/go/pix, last accessed April 15, 2005
[5] http://www.ietf.org/rfc/rfc2616.txt, last accessed April 15, 2005
[6] http://www.ietf.org/rfc/rfc1945.txt, last accessed April 15, 2005
[7] http://www.erg.abdn.ac.uk/users/gorry/course/intro-pages/osi-example.html, last accessed April 15, 2005
[8] www.webopedia.com/ quick ref/OSI Layers.asp, last accessed April 15, 2005
[9] http://www.usenix.org/publications/library/proceedings/bsdcon02/ full papers/lemon/lemon html/node2.html,
last accessed April 15, 2005 [10] http://en.wikipedia.org,
last accessed April 15, 2005
[11] http://markun.cs.shinshu-u.ac.jp/learn/osi/, last accessed April 15, 2005
[12] http://freespace.virgin.net/glynn.etherington/data encapsulation.htm, last accessed April 15, 2005
[13] http://www.wilsonmar.com/1isotp.htm, last accessed April 15, 2005
[14] http://www.rabbitsemiconductor.com/documentation/docs/manuals/TCPIP/Introduction, last accessed April 15, 2005
[15] http://www.ciscopress.com/articles/article.asp?p=98156&seqNum=2, last accessed April 15, 2005
[16] http://navigators.com/internet architecture.html, last accessed April 15, 2005
[17] http://www.cs.columbia.edu/ hgs/internet/, last accessed April 15, 2005
[18] http://www.helsinki.fi/ ksiazkie/nerd/internet/infrastructure.html, last accessed April 15, 2005
[19] http://www.cisco.com/univercd/cc/td/doc/cisintwk/ito doc/ip.htm, last accessed April 15, 2005
[20] http://www.tcpipguide.com/free/, last accessed April 15, 2005
[21] http://telecom.tbi.net/how-dial.htm, last accessed April 15, 2005
[22] http://www.partow.net/programming/POSIXsynchwrapper/index.html, last accessed April 15, 2005
[23] http://www.tcpdump.org/, last accessed April 15, 2005 [24] http://www.ethereal.com,
last accessed April 15, 2005
[25] http://www.gnu.org/software/ddd/, last accessed April 15, 2005
[26] http://www.rix.is/statistics.html, last accessed April 15, 2005
Appendix A
Appendix A includes the whole source code of the prototype. Files are displayed in alphabetical order, and are separated with the header of the next file.
/*
Project: Final year project in CS in UNAK
Author: biggistefna.is
File: biggisfilter.cpp
Summary: Main methods for the project along with coordinator and logging thread.
*/
#include "funcs.h" // get hwaddr, debug 10
#include "networkreader.h" // the network reader #include "bqueue.h" // queues
#include "segfilter.h" // segmentation filter #include "search.h" // search filter
#include "filtz.h" // filter zip #include "iplist.h" // ip list filter #include <stdio.h>
#include <iostream>
#include <pthread.h> 20
#include <unistd.h>
#include <signal.h>
#include <sys/types.h>
#include <time.h>
#include <fcntl.h>
#include <sys/resource.h>
#include <stdarg.h>
FILE *fdebug; 30
char debugfile[ ] = "main.debug";
BQueue q1("queue1"),q2("queue2"),q3("queue3"),qZ("queueZ");
NetworkReader reader(&q1);
IPList iplist(&q3);
Search search(&q2,&q3);
FiltZ filtz(&qZ,&q2);
SegFilter segfilter(&q1,&q2,&qZ); 40
int mainpid;
char configFile[100];
char *configFile;
// array of pids
#define NUM PS 6 //main+reader+filt*4
int pids[NUM PS];
#define PID MAIN 0 50
#define PID READER 1
#define PID FILTZ 2
#define PID FILT2 3
#define PID FILT3 4
#define PID FILT4 5
void debug(int d, char *name, char *str, . . .)
{
if (DEBUG B>=d) 60
{
va list argp;
va start(argp,str);
fprintf(fdebug,"DEBUG(%s(%d)): ",name,d);
vfprintf(fdebug,str,argp);
fprintf(fdebug,"\n"); fflush(fdebug); va end(argp); } #endif 70 } void stopAll() { reader.stop();
debug(1,"main","Now, asking filters to stop");
//filt1.stop();
segfilter.stop();
search.stop();
filtz.stop();
iplist.stop(); 80
debug(1,"main","Filters have stopped, now for logger");
debug(1,"main","waiting for everybody to finish");
reader.join();
debug(2,"main","joined the reader");
//filt1.join();
segfilter.join(); 90
search.join();
filtz.join();
iplist.join();
debug(2,"main","joined the filters");
debug(2,"main","joined the logger");
exit(0);
};
void terminate(int x) 100
{
int signalpid = getpid();
debug(2,"main","Got a signal(%i). Stopping(pid=%d)\n",x,signalpid);
if (signalpid==mainpid) { stopAll(); } else { 110
debug(2,"main","hmm. . . this is not the main thread mainpid=%i - mypid=%i\n",mainpid,signalpid);
} }
void newFailed()
{
fprintf(stderr,"A function calling new has failed, Failed to allocate storage\n");
stopAll();
};
void reconfigure(int x)
{ 120
if (getpid()!=mainpid)
return;
FILE* f = fopen(configFile,"r");
if (f==NULL)
{
fprintf(stderr,"Could not open %s for reading",configFile);
exit(1);
}
search.flushPatterns();
char line t[150]; 130
char *line = line t;
char *key;
char *value;
u int keylen = 0;
u int strlength = 0;
u int vallen = 0;
while (fgets(line,150,f)!=NULL)
{
debug(2,"main","Got line %s",line);
while(isspace(*line)) 140
*line++;
continue;
debug(2,"main","komst hinga (%i)",*line);
strlength = strlen(line);
key = line;
value = index(line,’ ’);
vallen = strlen(value);
keylen = strlength − vallen;
while (isspace(*value)) 150
*value++;
if (strlen(value)<1)
continue;
debug(2,"main","Value = %s",value);
if (strncasecmp(key,"pattern",keylen)==0)
{
search.addPattern(value);
}
else if (strncasecmp(key,"maxpackets",keylen)==0)
{ 160
int c = atoi(value);
reader.setPacketsCount(c);
}
else if (strncasecmp(key,"filter",keylen)==0)
{
reader.addFilter(value);
} }
search.compileREs();
fclose(f); 170
}
void usage(char *s)
{
fprintf(stderr,"Usage: %s [-d dev] [-c configFile]\n\n",s);
exit(1);
}
void readPIDStat(int pid, unsigned long long *user, unsigned long long *sys)
{
char filename[80]; 180
char s[1024];
char *S = s;
int fd;
int num read;
sprintf(filename,"/proc/%d/stat",pid);
fd = open(filename, O RDONLY, 0);
if (fd==−1)
{
fprintf(stderr,"Could not open %s\n",filename); 190
*user = *sys = 0;
terminate(19);
return;
}
num read = read(fd,S,1023);
close(fd);
if (num read<=0)
{
fprintf(stderr,"Could not read from %s\n",filename);
*user = *sys = 0; 200 terminate(19); return; } S[num read] = ’\0’; S = strchr(S, ’)’) + 1; *S =+ 2; // skip “) ”
unsigned long long utime,stime,cutime,cstime;
int i; 210
for (i=0;i<11;i++)
S = strchr(S,’ ’) +1;
//printf(“S=%s”,S);
int num,n;
num = sscanf(S,"%Lu %Lu %Lu %Lu %n", &utime, &stime, &cutime, &cstime,&n);
//printf(“%d - %Lu %Lu %Lu %Lu\n”,num,utime,stime,cutime,cstime);
*user = utime; 220
*sys = stime;
};
void readCmdLine(int argc, char *argv[ ])
{
{
printf("Checking %s\n",argv[i]);
if (argv[i][0]==’-’) { switch(argv[i][1]) 230 { case ’d’: //device i++;
if (i==argc) usage(argv[0]);
reader.setDev(argv[i]);
break;
case ’D’: //debug
break; // not implemented
case ’c’: //configfile
i++; 240
if (i==argc) usage(argv[0]);
configFile = argv[i]; break; default: usage(argv[0]); } } else { usage(argv[0]); 250 } } }
void segfault(int x)
{
fprintf(stderr,"Got SIGSEGV. My pid=%i\n",getpid());
sleep(2);
exit(100);
};
void getCPUUsage(unsigned long long *user, unsigned long long *total) 260
{
static int f;
char buff[1024];
if (f)
{
lseek(f,0L,SEEK SET);
}
else
{
f = open("/proc/stat",O RDONLY,0); 270
if (f==−1)
{
fprintf(stderr,"Gat ekki opna");
//exit(1);
} }
int n = read(f,buff,1023);
if (n<0)
{
fprintf(stderr,"Gat ekki lesi (%d)\n",n); 280
//exit(2);
}
buff[n] = ’\0’;
static int num;
unsigned long long utime,nice,sys,idle,iow,xxx,yyy;
//printf(“Got following line: %s”,buff );
num = sscanf(buff,"%*s %llu %llu %llu %llu %llu %llu %llu %*s",&utime,&nice,&sys,&idle,&iow,&xxx,&yyy); *user = utime+nice+sys;
*total = utime+nice+sys+idle+iow+xxx+yyy;
//printf(“returning %u,%u\n”,*user,*total); 290
}
void printStatus()
{
debug(1,"main","getting load information");
// cpu totals
unsigned long long cpuwork,cputotal;
getCPUUsage(&cpuwork,&cputotal);
// program cpu totals 300
unsigned long long uuse,suse;
//getProcessUsage(&uuse,&suse);
// will be derived after all cpu loads have been fetched //reader totals
unsigned long long rdrCpuUser, rdrCpuSys;
// packet totals
unsigned long packetsRead,packetsTotal; 310
reader.getCounter(&packetsRead,&packetsTotal);
// filter2
unsigned long long segfiltercpuUser,segfiltercpuSys;
unsigned long segfilterCount, segfilterSize;
readPIDStat(pids[PID FILT2],&segfiltercpuUser,&segfiltercpuSys);
segfilter.getCounters(&segfilterCount,&segfilterSize);
// filter3
unsigned long long searchcpuUser,searchcpuSys; 320
unsigned long searchCount, searchSize;
readPIDStat(pids[PID FILT3],&searchcpuUser,&searchcpuSys);
search.getCounters(&searchCount,&searchSize);
// filterZ
unsigned long long filtZcpuUser,filtZcpuSys;
unsigned long filtZCount, filtZSize;
readPIDStat(pids[PID FILTZ],&filtZcpuUser,&filtZcpuSys);
filtz.getCounters(&filtZCount,&filtZSize);
330
// filter4
unsigned long long iplistcpuUser,iplistcpuSys;
unsigned long iplistCount, iplistSize, iplistItems;
readPIDStat(pids[PID FILT4],&iplistcpuUser,&iplistcpuSys);
iplist.getCounters(&iplistCount,&iplistSize);
iplistItems = iplist.getNumItems();
// other
unsigned long segCount, segMax;
segfilter.getSegCounter(&segCount,&segMax); 340
double load[3];
getloadavg(&load[0],3);
// calculated vars
uuse = rdrCpuUser + segfiltercpuUser + searchcpuUser + filtZcpuUser + iplistcpuUser;
suse = rdrCpuSys + segfiltercpuSys + searchcpuSys + filtZcpuSys + iplistcpuSys;
static unsigned long lastTraffic = 0;
double traffic = 0.0;
traffic = (packetsTotal − lastTraffic) / 1024.0; 350
lastTraffic = packetsTotal;
fprintf(stdout,"LOGGER: %lu %llu %llu %llu %llu %llu %llu %lu %lu %llu %llu %lu %lu %llu %llu, %lu %lu %llu %llu %lu %lu %llu %llu %lu %lu %lu %lu %lu %f %0.2f\n",
time(NULL), // 1. current time
// cpu totals
cpuwork, // 2. working cputime
cputotal, // 3. total cputime // program cpu totals
uuse, // 4. total program user cputime 360
suse, // 5. total program system cputime
// reader
rdrCpuUser, // r1.reader user cpu
rdrCpuSys, // r2.reader sys cpu // packet totals
packetsRead, // 6. packet count
packetsTotal, // 7. total packet size // filter2
segfiltercpuUser, // 8. segfilter user cpu
segfiltercpuSys, // 9. segfilter sys cpu 370
segfilterCount, // 10. packets in segfilter
segfilterSize, // 11. packet size in segfilter // filter3
searchcpuUser, // 12. search user cpu
searchcpuSys, // 13. search sys cpu
searchCount, // 14. packets in search
searchSize, // 15. packet size in search // filterZ
filtZcpuUser, // 12z. filtz user cpu
filtZcpuSys, // 13z. filtz sys cpu 380
filtZCount, // 14z. packets in filtz
filtZSize, // 15z. packet size in filtz // filter4
iplistcpuUser, // 16. iplist user cpu
iplistcpuSys, // 17. iplist sys cpu
iplistCount, // 18. packets in iplist
iplistSize, // 19. packet size in iplist
iplistItems, // 20. total number of items in iplist // segmentation data