Performance Assessment of the Lead User Idea
Generation Process for New Product Development
By
Gary Lilien, Penn State
Pamela D. Morrison, University of New South Wales
Kathleen Searls, ASI Associate
Mary Sonnack, 3M
Eric von Hippel, MIT
ISBM Report 4-2001
Institute for the Study of Business Markets The Pennsylvania State University 402 Business Administration Building
University Park, PA 16802-3004 (814) 863-2782 or (814) 863-0413 Fax
Performance Assessment of the Lead User Idea Generation Process for
New Product Development
Gary L. Lilien*, Penn State
Pamela D. Morrison, University of New South Wales
Kathleen Searls, ASI Associates
Mary Sonnack, 3M
Eric von Hippel, MIT
March 2001
Acknowledgements: The authors gratefully acknowledge comments and suggestions by John Roberts and Christophe Van den Bulte and appreciate the support of Penn State’s Institute for the Study of Business Markets and MIT’s Innovation Lab.
*Corresponding author: 402 BAB, Penn State, University Park, PA 16802; 1-814-237-9568, [email protected].
Performance Assessment of the Lead User Idea Generation Process for New Product Development
Abstract
Traditional idea generation techniques based on customer input usually collect
information on new product needs from a random or typical set of customers. The “lead user process” takes a different approach, collecting information about both needs and solutions from users at the leading edges of the target market, as well as from those in other markets that face similar problems in a more extreme form. This paper describes the unique characteristics of the process and report on a natural experiment conducted within the 3M Company on the effect of the lead user idea generation process relative to more traditional methods.
3M is known for its innovation capabilities – and we find that the lead user process improves upon those capabilities. Annual sales of lead user product ideas generated for the average lead user project at 3M are conservatively projected to be $146 million after 5 years - more than eight times higher than sales for the average
contemporaneously-conducted “traditional” project. Each funded lead user project created a major product line for a 3M division. As a direct result, divisions funding lead user project ideas experienced their highest rate of major product line generation in the past 50 years.
Section 1: Introduction
Many firms use customer-focused new product development processes to generate new product ideas based on information collected from current or potential users. What distinguishes such processes across companies is the kind of information they collect and the respondents from whom they collect it. Most traditional market research techniques collect information from users at the center of the target market. The “lead user” (LU) process takes a different approach, collecting information about both needs and solutions from the leading edges of the target market and from markets that face similar problems in a more extreme form. Our key research question is: how does the LU process
influence the quality of the idea generation stage of new product and service
development? More specifically, we investigate the outcomes of that process, and the individual/team characteristics that may influence the effectiveness of that process relative to more traditional idea generation approaches.
In this paper we report on results of the IGLU (Idea Generation with Lead Users) research program. The first phase of the program was a qualitative examination of new product development-related attitudes and actions observed among informants working at 3M, a corporation known for its cultural emphasis on innovation. In this phase we
studied language use, shared assumptions and culturally valued frameworks for understanding innovation-oriented activities. The second phase of the program is a natural experiment conducted within the several 3M divisions that used both the LU methods and more conventional approaches for new product idea generation. We collected outcome data (new strategies being implemented, new markets identified, new product and service concepts) as well as pre- and post-project team process skills
inventories that allowed us to evaluate changes in team member skills due to LU project participation.
Our findings show that the LU method leads to a higher rate of breakthrough new product generation at 3M than traditional methods produce: compared with traditional projects, funded ideas emerging from LU studies had higher novelty (usually being judged “new to the world”), and their estimated sales in year 5 were more than eight times higher than those of the traditional contemporaneously-funded projects – an average $146 million in forecast annual sales for LU projects versus an average $18 million for the other projects (after adjustment for expected forecast bias). Funded ideas from a total of only 5 LU idea generation projects are conservatively projected to yield $730m in incremental annual sales for 3M.
We proceed as follows: In section 2 we review relevant literature and motivate and describe our research hypotheses. In section 3, we describe our research methods. In section 4 we present our findings. Section 5 discusses the implications of the study, and section 6 offers suggestions for further research.
Section 2: Research Context, Research Site and Hypothesis Generation Despite the strategic importance of effective new product development as a source of competitive advantage, most new product development activities fail to achieve their anticipated level of market success. Eliashberg et al. (1997) report on a survey of 154 senior marketing officers of US corporations, 79% of whom believe their new product development process could be significantly improved. A major complaint that that study identified (see Booz, Allen and Hamilton, 1982, as well) was that most of the resulting products tended to be marginal contributors to the firm’s portfolio, rarely resulting in radical or breakthrough ideas.
To assess the range of market research methods that might be used to help enhance the output of new product development processes, Eliashberg et al. (1997) classify those methods along two dimensions: type of product sought (radically new vs. marginally new) and nature of the research method (traditional versus nontraditional) (Table 1). As they point out, most traditional market research methods that address the idea generation stage of the process use respondents at the center of the market whose thinking is limited by their current experience base and environment.
[Insert Table 1 here]
As Eliashberg et al. (1997) also point out, the traditional methods in box 1 in Figure 1 have generally failed to produce the kind of radical new product breakthrough that developers had hoped, leading to interest in nontraditional methods. Some successes have been reported for information acceleration (Urban, Weinberg, and Hauser1996) and virtual reality based research (Pels and Merrick, 1993 and Crispell, 1993), methods aimed at the assessment and testing stages of the new product development process. The only non-traditional idea generation method they identified was the lead user method.
In their study of 127 successful and unsuccessful new consumer products
Goldenberg et al (2001) point out that “…the marketing literature has paid little attention to the way an idea is generated as a possible predictor of it success.” (p 71). Their analysis supports the results of Finke et al (1992), showing that ideas based on solution spotting (where the solution either precedes traditional market research or where the solution and the need are spotted simultaneously) are superior to those associated with prior need assessment (need spotting).
The lead user process emerged from two research findings about the sources of innovation. First, users rather than manufacturers are often the initial developers of what
later become commercially significant new products and processes (Enos 1962, Knight 1963, Freeman 1968, Lionetta 1977, von Hippel 1976, 1977, 1988, VanderWerf 1990, Shaw 1985, Shah 1999). Second, innovation by users tends to be concentrated among “lead users” of those products and processes (Urban and von Hippel 1988, Morrison, Roberts and von Hippel 2000, Shah 1999, Luthje 2000). Lead users are defined as users of a given product or service type who combine two characteristics: (1) they expect attractive innovation-related benefits from a solution to their needs and so are motivated to innovate, and (2) they experience needs for a given innovation earlier than the majority of the target market (von Hippel 1986).
Research on innovation-related incentives and capabilities provides a theoretical basis for these empirical observations on innovation by users in general, and innovation by lead users in particular. From the perspective of innovation as an economically motivated activity (Schmookler 1966, Mansfield 1968), those users expecting
significantly higher economic or personal benefit from developing an innovation – one of the two characteristics of lead users – have a higher incentive and are more likely to innovate. Also, given that lead users experience needs in advance of the bulk of a target market, the nature, risks, and eventual size of that target market are often not clear to manufacturers. This lack of clarity can reduce manufacturers’ incentives to innovate, and increase the likelihood that lead users will be the first to develop their own innovative solutions for leading-edge needs – including those that later prove to represent
mainstream market demand (Gans and Stern 1999).
Customer driven new product idea generation processes have yet to incorporate these ideas, with all but the lead user process focusing on new product need data from average or major customers within target markets. . Griffin (1997) found that the three
most important market research tools for new product development were: Voice of the Customer, Customer Site Visits, and Beta Site Testing, all of which focus on existing customers. Other tools used to support ideation include brainstorming (Rossiter and Lilien, 1994) focus groups, customer visits (McQuarrie, 1998), conjoint analysis and some promising new work on channeled ideation (Goldenberg et al, 1999) Griffin reports that solution generation then follows, typically executed by internal corporate personnel without input from external sources. In other words, traditional idea generation processes and tools are designed to collect new product need and solution data primarily from sources other than lead users.
Urban and von Hippel, (1988) evaluated the LU concept in a laboratory setting, and showed that new product concepts generated from lead user data (in the area of computer-aided systems for the design of printed circuit boards—PC-CAD) were strongly preferred to those generated from more mainstream users by a sample of PC-CAD users. That encouraging evaluation, along with the above observations, suggest that a carefully monitored field assessment of the effectiveness of an implementation of the procedure would be of value.
Von Hippel, Churchill and Sonnack (2001) have developed an idea generation process designed to collect both need and solution data from lead users. This process involves four major steps and usually takes four to six months to complete, as follows:
Step 1: Goal Generation and Team Formation. A firm provides an ideation-goal for the project and forms a team. Teams typically are composed of 3-5 experienced people from marketing and technical departments, with one member serving as project leader. Team members typically spend 12 to 20 hours per week on a project for its duration. During the initial step, the LU project team is formed and works with relevant
key company stakeholders to select the general market it will target and the type and level of innovation desired. For instance, does the company seek a “breakthrough” product or does it wish to merely extend current product or service lines? At the same time, the team identifies key business constraints.
Step 2: Trend Research. During step 2, LU teams focus on identifying and deeply understanding important market and technical trends in the field being explored. Team members begin by reviewing conventional information sources. Next, they systematically identify and interview leading experts in the marketplace that they are exploring - people who have a broad view of emerging technologies and leading edge applications in that field or fields. They then select an important trend or trends as the central focus of further project work.
Step 3: LU Pyramid Networking. In step 3, unique to the LU process, the project team engages in a “Pyramid” networking exercise to identify and learn from users at the leading edge of the important trends selected for as a study focus. They identify lead users both in the target market and in other markets that face similar needs in an even more extreme form. Then, the team learns from those lead users about needs and
solutions they are encountering at the leading edge, seeking to identify information and ideas that might hold the seeds of a breakthrough. The Pyramid Networking technique is a modified version of the “snowballing” technique used by researchers to identify sample members having rare characteristics in common. Snowballing utilizes the notion that people frequently know people like themselves, and accumulates a sample by asking people with the desired, rare characteristics to identify other people like themselves. In contrast, the Pyramid technique relies on the fact that people with a strong interest in a topic or field tend to know people more expert than themselves: for example, good computer science professionals tend to know the identity of computer scientists who are
even more skilled than they are. In the Pyramid technique, LU project teams use telephone interviewing to network their way up “pyramids of expertise” (see Figure 1, which also includes the percentage of contacts of each type identified in the field research reported on later) to identify increasingly expert lead users in a field of interest. Team members begin with relatively expert users identified from articles and other sources. Then, they ask each user contacted to identify users who are even more advanced, seeking users at the leading edge of the target market, and then to identify lead users in other markets facing similar challenges in an even more advanced or extreme form (“advanced analog markets”). Team members conclude this step by beginning to shape the
information they have collected into preliminary product, service and strategy ideas, and to assess the business potential of these for their firm.
[Insert Figure 1 here]
Step 4: LU Workshop and Idea Improvement. In the fourth and final step of a LU project, activity centers around a lead user workshop in which invited lead users work with company personnel to improve the preliminary concepts generated in step 3 – and sometimes to generate entirely new concepts (An economic rationale for users to freely share their ideas in such a forum is developed in Harhoff et al., 2000). Typically, 10 to 15 people attend this workshop, of which a third may come from the firm sponsoring the study. Participants first work in small groups and then work as a whole to design final concepts that fit the company's needs. Thereafter, the entire group evaluates the concepts in terms of technical feasibility, market appeal, and management priorities. After the workshop, the organization conducts more traditional market research to test the concepts against the needs of the target market and also tests the concepts with key stakeholders in
the firm. The team then makes any necessary refinements and presents its recommendations to senior management.
Our focus in this paper is to compare the effectiveness of the LU procedure described above in a field setting against procedures used by non LU teams in the same organization. Following Cook and Campbell (1979) we sought a field situation that could closely approximate a pre-post/test-control situation, with at least quasi-random assignments to treatment cells. Such a situation requires a participating organizational field site that satisfies three conditions.
First, the site should be one for which innovation has historically been strategically important, to ensure that the LU intervention would not signal a change (increase) in the strategic incentive to innovate. (That is, we sought a challenging test environment, one in which the culture for and incentives to innovate were historically strong).
Second, the site must be using more traditional methods, which could act as a control within the same organizational units in parallel with the LU method.
Third, the site must have data on a number of projects utilizing both LU and traditional idea generation processes for study, so that we can statistically distinguish the effect of the methods from other firm or industry-specific characteristics.
At the time of our study, we found that 3M satisfied these requirements, as follows: 1. 3M has historically been known for and has always placed major emphasis on
innovation. To illustrate, its 1999 Annual Report is titled “The Elements of
Innovation,” and its letter to shareholders states, “For nearly 100 years, 3M has grown by pioneering innovative technologies and products…. Innovation remains the
driving force of 3M culture and growth.” (3M, 1999 Annual Report, p. 12.)
2. 3M began formally training staff in one division with the LU method in 1996 and by May 2000, LU training had been carried out in several others, each of which was at
the same time employing more traditional idea generation methods. These divisions could then play the role of experimental units.
3. By May 2000, 3M had completed 7 LU projects and had funded further development of the ideas generated by 5 of these. The divisions carrying out LU projects also had 42 contemporaneous funded projects (that had utilized a range of traditional idea generation processes) available for study. In contrast to the LU teams, non LU teams collected market information only from target markets. Data collection methods varied from project to project and included market data collected by outside
organizations, focus groups with major customers, customer panels, customer requests relayed through sales personnel and advances introduced by competitors. In all cases, idea generation was carried out by 3M product developers and sales personnel with product designs generated in 3M labs. All LU and non LU product developers were charged to seek important innovation breakthroughs.
As existing research does not report specific, in-company experience with LU idea generation methods, we conducted an inductive, qualitative research phase at 3M to generate more specific research hypotheses and associated measurements. Our approach utilizes a research tradition informed by both ethnographic (Douglas 1986; Willis 1981; Lave 1988, Van Maanen 1988; and Workman 1993) and Grounded Theory (Glaser and Strauss, 1967) perspectives, incorporating three goals:
1 Allow data and the field to drive theory creation. Product developers
throughout the firm shared their time with us and showed considerable patience early on as they explained what to look for, where to look and why we should expect to find (or not) certain themes, as we sought to understand how innovative product concept generation is understood, communicated and practiced at 3M.
These same professionals then led us through their professional networks and their “communities of practice”(Wenger 1998), to collect deeper insights prior to formulating our hypotheses. Our approach also provided us the opportunity to gain insight into the language and terminology used by 3M new product developers.
2 Develop trust-based relationships between 3M new product development professionals and researchers to ensure researchers were properly focused. To implement this goal, we began our grounded research activities only after obtaining strong top management support and permissions for access to
confidential company data. These permissions enabled unguarded and informal relationships to develop between the research team and 3M product development team, increasing the willingness of product developers to shape, direct and redirect researcher attention. 3M informants tested and critiqued our interview agendas, data collection instruments, survey schedules and our early
interpretations of our observations. At a few important junctures, informants simply told us “You’re asking the wrong questions,” and improved our ability to “see” and understand what the practitioners were actually doing in the course of their work.
3 Use fieldwork to drive measurement development. To implement this goal, we studied the variables and scales associated with 3M’s own internal new product development measurement, prioritization and resourcing decisions. We were then in a position to integrate these measures and scales with those gleaned from the academic literature.
In the course of our grounded research at 3M, we specifically sought balance between LU and non LU participants. We interviewed more than 20 managers and related new product development professionals in several 3M divisions. These internal experts represented two broad categories: the technical/scientific side of new product development (the professional group historically most credited as being the source of the company’s innovative product offerings) and the business side (including marketing professionals). Research team members also observed and participated in LU training sessions and studied relevant internal company documentation.
We learned a number of things from the grounded theory process that shaped our research. All respondents agreed that they were strongly motivated to unearth
breakthrough ideas, but LU team members seemed to feel that their approach might provide potential for qualitatively different types of ideas to emerge. However, some LU participants expressed concern that these breakthrough ideas might be less compatible with the 3M technical, production and market environment, and hence, less likely to be judged worthy of funding by 3M management. If this concern proved correct, it obviously would represent a major barrier to gaining actual marketplace benefit from breakthrough ideas generated by the lead user method. Also, managers expressed a concern that a process built upon distilling new ideas from lead user needs and prototype solutions would not generate ideas that could be effectively patented by 3M. Since patents are an important source of competitive advantage for 3M, this would represent a major drawback to the method if true. Finally, many LU participants expressed concern about the time and effort involved in the LU method relative to alternative approaches.
We used these findings in conjunction with our review of the literature to develop both hypotheses and measurement instruments. (We will use the term non LU methods
to refer to the range of more mainstream methods 3M has been traditionally employing for idea generation.)
With respect to project outcomes our hypotheses are:
H1: Lead user methods will generate opportunities with greater commercial
potential than will non LU methods (i.e., the market potential per funded idea will be greater for LU output than for non LU output).
H2: Lead user methods will generate “breakthrough” ideas that result in major
product lines at a greater rate than will non LU methods (i.e., the LU method will increase the overall rate at which the organization generates major new product lines).
H3: Projects from LU methods will exhibit a lower level of compatibility with
organizational selection criteria than will non LU projects.
H4: Ideas generated by LU methods will be less protectable by patent than will
ideas generated by non LU methods.
H5: Projects from LU methods will take more time to develop and cost more
than will non LU projects.
With respect to process outcomes our hypothesis is:
H6: After participating in LU training, team members will have higher capability
on key activities regarded as an integral part of the LU method than before training.
Section 3: Research Samples and Methods Samples
Our study analyzes two samples drawn from the 3M divisions that had completed lead user projects at the time of our quantitative data collection. The first is a sample of
“funded ideas.” 3M has a formal set of stages through which ideas generated by any method must pass. The earliest stage involving critical management review is the initial request for funding. A “funded idea,” therefore, has received careful review and positive evaluations from 3M divisional managers and has received, at a minimum, initial funding within the 3M product development system. Our sample of funded ideas was a complete census of all ideas receiving funding in the 3M divisions that also funded LU project ideas during our data collection period of February, 1999 to May, 2000. We identified these ideas via divisional records of funded projects. The sample consisted of 5 funded ideas developed by LU studies (“LU ideas”) and 42 funded ideas developed by other, more traditional divisional processes (“non LU ideas’).
In our qualitative work, we could identify no differences between the pressures for breakthroughs placed on LU and non LU team members. As we will show later, the backgrounds and capabilities of team members were similar as well. Hence, while not satisfying the random assignment criterion for experimental design, these samples appear to satisfy the “rough equivalence” criteria in test and control conditions associated with natural or quasi-experimentation.
In order to incorporate a pre-post dimension in our research, we developed a second sample, consisting of all major product lines introduced to the marketplace between 1950-2000 by the 3M divisions that executed LU studies. Major product lines – such as the line of Scotch transparent tapes and the line of Post-It memo pads - are vital to the financial success of 3M. Following the advice of 3M controllers (and in line with Stalk, Pecaut and Burnett, 1996) we operationalize the concept of major product lines as those that were separately reported upon in divisional financial statements. (Divisional financial statements broke overall sales into several major product lines plus, typically, a
residual category grouping minor products of a range of types.) In 1999 in the 3M divisions we studied, sales of individual major product lines ranged from 7% to 73% of total divisional sales
Our major product line sample contains 21 major product lines developed by non LU methods that met our criteria and that had been developed and funded by the divisions executing LU studies during the 1950-2000 period. It also contains 5 funded ideas
developed by LU methods. The characteristics and projected sales of these LU ideas - conservatively deflated in line with historical forecast accuracy (see Section 4) – all met our criteria for a major product line.
Data Collection
To address the what (characteristics of the ideas) and the how (characteristics of the process) questions, we selected appropriate respondents within each division from LU and non LU teams. We used multiple approaches to increase our response rate, including: pre-survey, face-to-face meetings conducted with each division contact (typically, but not always, the lead user team leader) to explain the data collection process and to gain trust and cooperation. The actual data collection (outcome and process measures) was done via e-mail with Microsoft Word / Form attachments sent to the individual respondents, and a week after delivery of the instrument an individualized follow-up phone call and e-mail (the communication means uniformly used within 3M) was sent if the Form(s) hadn’t been returned.
In addition to the ideas themselves as units of analysis, we are interested in the impact of the LU process on attitudes, behaviors and skills. Hence, we developed instruments to measure the performance of the various idea generation methods both
through outcome data (new strategies, new markets identified, new product and service concepts) as well as through pre and post-project team process skills inventories.
At a face-to-face meeting with LU team leaders we asked them to: (a) identify and recruit the members of their team as respondents,
(b) identify and recruit appropriate respondents within the same division to provide non LU idea method data, and
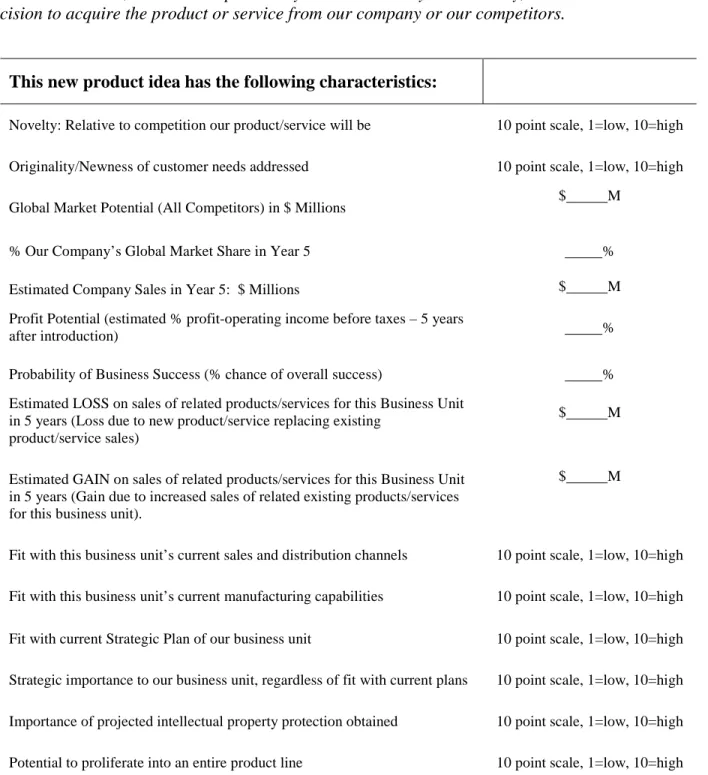
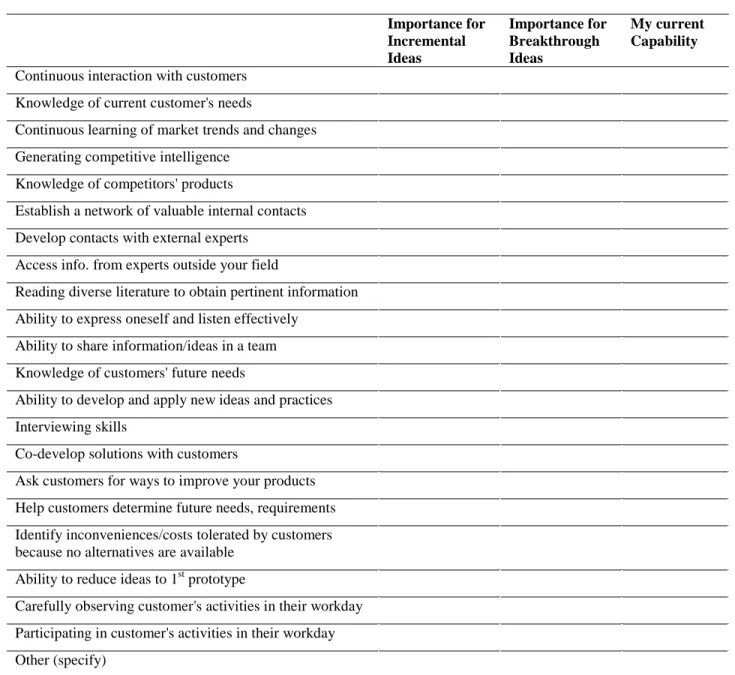
(c) describe the New Product Development goals and outputs from the LU project (see Tables 2b and 2c), provide organizational information about their
division, and provide process information (Table 2c). [Insert Tables 2a,b,c here]
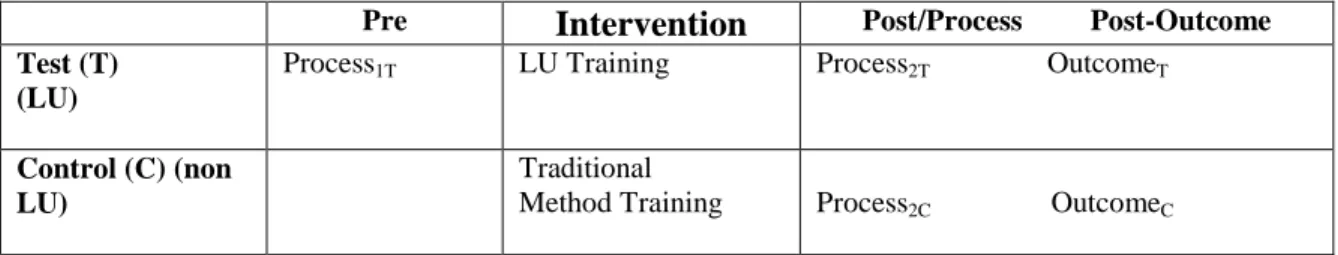
After the meeting with the team leader, we contacted the respondents identified in (a) and (b) above. The respondents from non LU idea generation methods provided detailed information both on funded ideas (as per Tables 2a, b), as well as process data (as per Table 2c). The LU team member respondents provided process data only (as per Table 2c), as we had already collected the funded idea data from team leaders. For lead user teams that started their LU training during the study time period, we took process measures twice – once before LU training, and, again, at the conclusion of the project. In order to increase the size of our LU process measure sample (from n = 7 to n = 47
individuals) we included LU projects that were either completed or underway when we began data collection, and for these teams, we could collect only post-training process measures. We took process measures once for the non LU team members (n = 32) at the conclusion of their projects. Table 3 outlines the measurement flow process.
We collected data on major new product ideas developed early in the 1950-2000 period through in-depth interviews conducted with long-tenure employees in each of the LU study-divisions who had a good knowledge of their division’s and product line histories. We converted all historical dollar figures to 1999 dollar equivalents using U.S. consumer price index data (Council of Economic Advisors 2000).
Measurement Instrument Development.
We developed separate measurement instruments to collect project outcomes and process activities.
Outcomes Instrument. We developed the New Product Idea Description Form (Table 2b), from measures used in previous academic research: novelty of ideas,
originality/newness of customer needs, and potential for proliferating into an entire product line from the New Product Creativity scale (Moorman and Miner, 1997);
company sales/ market share from the new idea in year 5, and probability of business success from NPD Success Criteria (Griffin and Page, 1996); and global market potential for all competitors from Cooper, (1993). We supplemented these measures with items revealed during the exploratory phase of the research. These latter items included several that were in general use within 3M as part of their internal new product idea assessment procedure. We began with long batteries of scales and then we carefully pre-tested all items and refined them during preliminary instrument development meetings with participating staff at 3M. We tested if the scales had meaning to the respondents in their specific organizational setting and retained those that respondents said did have meaning. We collected completed outcome instruments (Table 2b) for all 47 funded ideas (5 LU major product lines, 1 non LU major product line, and 41 non LU incremental ideas) that were current in the period February 1999 to May 2000; that is, our database represents a
census. We also collected responses for the same items for the additional 21 historical major product lines that we will be using for comparison, collected from key informants via in-depth personal interviews.
Process Instrument. We developed the process instrument to measure individual skills in idea generation activities, personality traits, and individual characteristics such as job level, time in the job, and R&D/ marketing/ accounting/ manufacturing expertise. We developed items for the individual skills identified in the literature to be associated with generating new product ideas (Thomas, 1993) and supplemented those items with skills identified from interviews with lead user team leaders and their primary LU trainer. We measured personality traits using a web-based version of Myers-Brigg’s Personality Inventory (www.personalitypage.com). Forty-seven of the 50 (94%) members of the completed LU project teams and 32 (out of 37 contacted, 86%) members of the non LU teams provided the post-process measures (Table 2). In addition, the 17 members of those LU teams that started training during the data collection phase completed a pre-process measurement instrument which had the same pre-process activity items as the post-measure instrument. Of these 17 respondents who completed a pre-process post-measurement instrument, 7 had completed the lead user training and thus also provided post-process measures at the time of this data analysis. (We collected these latter data to view changes in perceived skill level associated with the lead user training via a within-subject design).
Note that since 100% of the Idea Description Forms for LU projects and 79% for non LU projects were returned and 94% of the Process Measure Forms for LU projects and 86% for non LU projects were returned, the response rates were sufficiently high to suggest that validity checks for non-response bias are not needed: (Malhotra, 1996).
Section 4: Analysis and Results
In this section, we will analyze the three sources of data noted above to study what happened (outcome analysis) as well as how it happened (process analysis). In each case we will match, as best we can within a natural (quasi) experimental framework, the test condition (LU) versus the control situation (non LU). For the outcome analysis, we have two subsets of analysis: first, a cross-sectional analysis of the census of all
contemporaneous funded ideas (that is, currently funded ideas in the data collection period February 1999 – May 2000), and second, an intertemporal analysis of major product lines, for which we will compare the LU results with a 50 year history of major product line development at 3M. We will use both of these sets of data to test our hypothesis separately in the sections that follow and will use differences between treatment groups to test our hypotheses.
In several of these analyses, we will be comparing forecast data (projected sales for a line of products not yet launched) against actual, historical sales. Armstrong (2001) reviews some literature on forecast bias for new product introduction that supports the notion that forecasts for new product sales are generally optimistic, but that that upward bias decreases as the level of the sales forecast increases. Indeed, Tull’s (1967) model calculate $15 million in revenue as a level above which forecasts actually become pessimistic on average.
In order to account for possible biases in the relationship between actual and forecast/estimated sales, we collected data from five division controllers responsible for authorizing investment expenditure for developing new ideas into products and also obtained data from a 1995 internal study that compared such forecasts with actual sales. By combining this information, we developed a distribution of forecast errors for a
number of 3M divisions, plus overall forecast errors across the full corporation. Those errors range from forecast/actual of +30% (overforecast) to –13% (underforecast). Based on this information, and in consultation with 3M management, we use a 25%
sales-forecast deflator and apply that adjustment factor to all projected sales data in the analysis that follows. Based on 3M historical experience, and consistent with Tull’s (1967)
findings, that level of forecast deflation should provide conservative sales projection figures.
Outcome Analysis 1: Comparison of Lead User and Non LU Funded Ideas
We began our empirical analyses with a comparison of all “funded ideas” that were generated by LU and non LU methods during the time period of our data collection (February 1999 to May 2000). Table 4 provides a census of all funded ideas during the noted period in the 5 divisions that funded LU ideas. During that time, five ideas generated by lead user projects were being funded along with 42 ideas generated by non LU idea generation methods.
[Insert Table 4 here]
From Table 4, we see that LU ideas are significantly more novel than are ideas generated by non LU methods, address more original/newer customer needs, have
significantly higher market share, have greater potential to develop into an entire product line, and are more strategically important. We also find that the LU ideas have projected annual sales in year 5 that are eight times higher than those of ideas generated by non LU methods – an average of $146 million versus an average of $18 million in forecast annual sales. Thus, we find support for H1 (p<0.005).
The size of this difference is striking and we investigated further. We found that LU ideas differed in kind from ideas produced by non LU methods. Non LU methods
were producing mainly funded ideas for product improvements and extensions to existing product lines. In contrast, the LU method was producing funded ideas that clearly fit 3M divisional criteria for major product lines. Those ideas were clearly different from existing product lines, and the projected sales of each fell well within (and sometimes exceeded) the proportion of divisional sales accounted for by existing individual
divisional major product lines: projected sales five years after introduction for funded LU ideas, conservatively deflated as discussed above, ranged from 25% to over 300% of current total divisional sales. Table 5 shows the qualitative difference in the type of product (incremental vs. major product line/breakthrough) that the LU process has been generating. The probability of this outcome occurring by chance is p < 0.005, providing support for H2.
[Insert Table 5 here]
To give a flavor of the type of innovations that LU process teams generated at 3M, here are descriptions of four:
1. A new approach to the prevention of infections associated with surgical operations. The new approach replaces the traditional “one size fits all” approach to infection prevention with a portfolio of patient-specific measures based upon each patient’s individual biological susceptibilities. This innovation involved new product lines plus related business and strategy innovations made by the team to bring this new
approach to market successfully and profitably.
2. Electronic test and communication equipment that, for the first time, enables physically isolated workers such as telecommunication equipment repair people to carry out their problem-solving work as a team. Linked workgroup members can contribute to the solution of a problem being worked upon by a single, physically isolated worker in real time.
3. A new approach, implemented via novel equipment, to the application of commercial graphics films that cuts the time of application from 48 hours to less than 1 hour. (Commercial graphics films are used, for example, to cover entire truck trailers, buses and other vehicles with advertising or decorative graphics.) The LU team ideas involved needed technical innovations plus related channel and business model changes to help diffuse the innovation rapidly.
4. A new approach to packaging fragile items in shipping cartons to replace current packaging materials such as foamed “plastic peanuts.” The new product lines implementing the approach are more environmentally friendly and much faster and more convenient for both shippers and package recipients than are present products and methods.
H3 addresses the concern that the apparently more ambitious outcomes from the
LU process would be less compatible with key organization-fit criteria than would non LU ideas. The last three items in Table 4 address this issue: we find no statistical difference in quality of fit of LU and non-LU ideas with respect to existing divisional distribution channels, manufacturing capabilities or divisional strategic plans. Hence, we cannot reject the null hypothesis H3 that LU and non LU major product lines are equal on
most dimensions of compatibility (p>.10).
H4 was that ideas generated by the lead user method would be less protectable by
patents than would ideas generated by other methods. A single item in Table 4 tests this hypothesis – and shows no statistical difference between intellectual property protection for LU vs non LU ideas. Apparently the novel synthesis of a number of lead user ideas that is carried out during the LU process enables 3M to obtain as effective intellectual property protection for LU process ideas as for non-LU ideas generated internally by the firm. Thus we cannot reject the null hypothesis H4 that LU and non LU major product
lines are equal on intellectual property protection (p>.10).
H5 addresses the issue of cost differences per idea between LU and non LU
methods. An audit of idea development time shows that the generation of a funded LU idea consumed 154 (sd = 82) person days on average. In contrast, generation of an average non LU idea consumed an average 60 (sd = 43) person days. The hypothesis of equality of these two means is rejected at the p <0.05 level. Using internal 3M data on
average costs of professional development personnel, we obtained a total cost of approximately $100,000 per funded LU project (including additional costs associated with the LU training) versus $30,000 for non LU projects. After accounting for the different probability of success for LU projects (Table 5: 80% for LU projects vs. 66% for the census of non LU projects), we determined that 3M pays about $80,000 more, on average, for a successful LU project than it does for a successful non LU project. These results provide support for H5.
Outcome Analysis 2: Major Product Lines.
Following our finding that the LU method tends to produce ideas for major product lines, we compare the major product line ideas generated by the LU method with those that had been generated by the 3M divisions in our study via other methods. This comparison provides alternative means of testing H1 and H2. To generate a sufficient sample for statistical analysis,
we went back to 1950 (as far back as we could go and still find company employees who could provide some data about the products) to capture major product line data in the divisions of interest. The major product lines tended to be long lived. (We were able to identify only two, relatively small ones that had been discontinued). Each major product line had also been
broadened over time, resulting in general patterns of strong growth and good margins for the 3M divisions.
Examples of historical major product lines in our sample include:
1. Scotch tape: A line of transparent mending tapes that was a major success in many household and commercial applications.
2. Disposable patient drapes for operating room use: A pioneering line of disposable products for the medical field now sold in many variations.
3. Box sealing tapes: The first type of tape strong enough to reliably seal corrugated shipping boxes, it replaced stapling in most “corrugated shipper” applications.
4. Commercial graphics films: Plastic films capable of withstanding outdoor
environments that could be printed upon and adhered to vehicles. This product line changed the entire approach to outdoor signage.
5. Insulation displacement-type connectors: This type of connector makes reliable electrical connections to telecommunication wires by displacing insulation and contacting the metal wire underneath. This technology represents a significant improvement over previous technologies, and has become the standard type of wire connector in the telecommunications field.
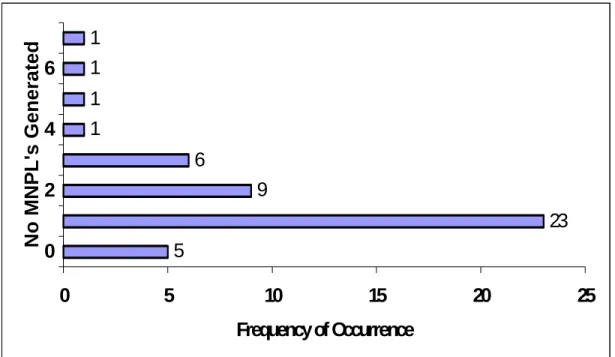
During the 1950-2000 period, the 3M divisions studied produced 21 major
product lines. During the 1997-2000 period, they produced 5 of those major product lines using LU methods and two using non LU methods. It is useful to look at the entire 4-year period during which the LU process was implemented at 3M and compare it (on a rolling basis) with all other four-year periods during 1950-2000. The average rate of major product line development during this half-century for the divisions studied was 1.64 per 4-year period. As Figure 2 shows, the highest rate achieved over a 4-year period was 7 major product lines–and this result was achieved during the 1997-2000 period during which the LU process was implemented by those divisions. During this period, 5 of the 7 major product lines developed were generated by LU methods. Non LU methods
generated 5 or more major product lines in two of the 47 4 year rolling periods. [Insert Figure 2 here]
To revisit H2, we look at the three comparisons: (1) LU output vs. pre-1997
output; (2) LU output vs. non LU output, 1997-2000; and (3) Pre-1997 output vs. all post-1997 output in the divisions studied.
For comparison (1), assume that 3M generates major product lines at a (constant) rate that represents the null hypothesis of no difference in rate of major product line generation over time. Using the four year data in Figure 2, that rate is 1.64 major product
lines per four year period for non LU methods. Then, a formal test of our hypothesis is “What is the likelihood that a process that generates λ = 1.64 events on average per study period could generate 5 (or more) in a period?” (1997-2000 for LU). Using an
assumption of a Poisson generation process (Grassman, 1981), we calculate that P(5 or more|λ=1.64) = 0.025, providing support for H2 (rejecting the null hypothesis at the 0.05
level).
For comparison (2), if we compare the 1997-2000 period (5 major product lines for LU methods vs 2 major product lines for non LU methods), we get P(5 or more|λ=4 x 0.5=2.0) = 0.052, again providing support for H2.
For comparison (3), if we consider the LU method an organizational intervention (Mills, 1999), we can compare the post-1997 period for 3M (blending both LU and non LU ideas) with the results of the previous regime. These results give 7 major product lines (5 LUs and 2 non LUs) in the 4 year 1997-2000 period, versus the historical average (adjusted to account for four fewer intervals and 2 fewer major product lines) of 1.79, giving P(7 or more|λ=1.79) = 0.003.
Thus, all three approaches provide further support for H2.
H1, perhaps our most important hypothesis, also addresses the economic returns
associated with the LU idea-generation investment. The previous subsection looked at a comparison of contemporaneous lead-user vs. all nonlead-user ideas and found support for this hypothesis.
Here we consider an alternative to H1, call it
H1A: Major product lines that emerge from LU methods generate greater
As major product lines occur relatively infrequently and because the major product lines that have emerged from lead user methods have yet to reach market maturity, we can only provide a suggestive test of this hypothesis with our data. To proceed, we make the following two assumptions:
A1. Returns from all major product lines that have emerged at 3M using methods other than the LU method can be considered as draws from the same
probability distribution.
A2. Revenue projections for LU major product lines are biased to the same degree on average as historical projections have been for other major product lines.
A1 allows us to compare the major product lines from the LU method with all major product lines in these divisions during the prior four decades. A2 allows us to use historical 3M figures on major product line forecast error to adjust the forecasts from the LU data.
Following A1 and A2, for major product lines introduced to market in 1994 or earlier we used as a reference “actual sales 5 years after introduction (including loss/gain from sales of related products in the division).” 3M management maintains such records and the 5-year sales goal is part of 3M’s project justification process. To provide
comparable data, we translated all sales data into 1999 dollars. Following A2 for the major product line ideas generated from the LU process (and for two major product line ideas recently generated by non LU processes) we have forecasts of 5-year sales vs. actual figures for the historical major product lines.
After deflation of the forecasts as discussed earlier, we find that the average “sales in year 5” for LU major product lines (n=5), is $146m, while the similar figure for major
product lines generated by non LU methods (n=16, as we were able to obtain detailed data on only 16 of the 21 non LU major product lines) is $62m. (Table 6). We address H1A by testing if the mean LU major product line yields higher sales than those derived
from non LU sources. At the p = .05 level we reject the hypothesis that these values are equivalent (Table 7), providing support for H1A, conditional on assumptions A1 and A2.
[Insert Tables 6 and 7 here]
As was the case in our analyses of current projects, we investigate how major product line ideas generated by the lead user method differ from those generated by non LU methods in terms of dimensions of compatibility (H3, redux). Table 7 provides
profiles of the 5 LU major product lines and the 16 non LU major product lines for which we were able to collect data.. Ideas produced by the LU method tend to be more novel or “breakthrough” (although not statistically significantly so) than are the major product lines produced from conventional methods. As with our previous analysis (Table 4), we reject the hypothesis (H3) of difference between LU and non LU major product lines for
most dimensions of compatibility, at the p<0.10 level; the only difference statistically significant at that level is estimated 5-year sales.
Process Activity Analysis.
To investigate H6, we contrast the characteristics, skills and capabilities of LU
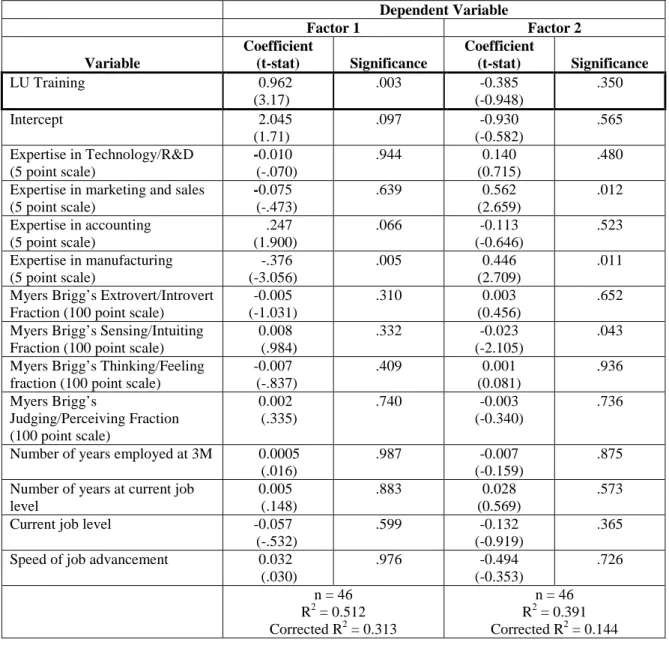
participants with those in non LU groups. The individual respondent measures we collected included a range of process activities as well as personality measures and self-perceived expertise in key activities (see Table 2c). Because we collected our data in a natural experimental setting, we could not assume that measured differences on the post-process measures between LU and non LU team members were not due to differences in the respondent traits, rather than due to the LU training. As Table 8 shows, while the
samples are statistically different at the 0.1 level on self rated expertise in technology and marketing and sales as well as on the Myers-Briggs extrovert dimension, they are not statistically significantly different at that level for any of the other expertise, personality or background characteristics.
[Insert Table 8 here]
To assess H6, then, we test for differences in key capabilities between LU and non
LU team members. Our skills inventory (Table 2c. column C) includes 21 items; to reduce those items to orthogonal, independent factors, we ran a principal factor analysis with Varimax rotation (and Kaiser normalization). The results strongly suggest a four factor solution, with the first four factors explaining 66% of the variance in the 21 items. (Table 9a). The first two factors incorporate the key skills associated with the LU training. The first factor includes knowledge of customers' future needs, reading diverse literature, interviewing skills, continuous learning of market trends, and help customers determine future needs while the second factor includes developing contacts and accessing information with experts outside your field.
[Insert Table 9a,b here]
We ran two Univariate Analysis of Variance models, with the first and second factor score as the dependent variable, LU training as the treatment variable and the twelve personality and expertise items from Table 8 as covariates. The results (Table 9b) show that LU training is significant at the .003 level for the first factor, which
incorporates most of the LU skills, and LU training not significant for the second factor. We also ran individual OLS regression analyses, with key individual items as dependent variables and with the same treatment effect and covariates. We found LU training was positively related to skill levels on all but two of the process activities noted
above, but was only statistically significant (at the 0.10 level) for careful observation of customer’s activities, knowledge of customer future needs, knowledge of current customers’ needs, helping customers determine future needs, requirements, continuous learning of market trends and change, and reading diverse literature. These results provide partial support for H6
The strongest test of the impact of the LU process would be a within subject design, the pre-post comparisons outlined in Table 2 for the post Feb 1999 project data. At the time of this writing, only one team (7 subjects) had had both pre and post measures taken. While clearly too small a sample for statistical analysis, preliminary pre-post differences we observed with this small group are consistent with the between subject analysis in Table 9b.
Section 5: Discussion and Implications
Our study of lead user idea generation projects at 3M has yielded several interesting empirical findings. Overall, we found that the lead user idea generation
process appears to offer significant value even to an innovative company such as 3M. We found that funded projects emerging from 3M lead user studies had significantly higher novelty (usually being judged “new to the world”), addressed more original newer customer needs, and also had significantly higher market share in year 5 (on average, 68% vs 33% for non LU ideas) than did those from more conventional methods. We also found that funded “breakthrough” ideas generated via the LU process offered as good a fit to existing divisional goals and competencies, and involved as high a level of intellectual property protection as did the more incremental ideas generated by non LU methods.
Lead User ideas had projected sales in year 5 that were more than eight times higher than the sales of the contemporaneously funded projects: $146 million annual sales
on average versus $18 million. Total projected divisional sales for 42 non LU projects 5 years after marketplace introduction was $756 million versus $730mm for 5 LU project ideas. We also find that, as a result of the introduction of the LU idea generation process, the rate of major product line generation has significantly increased relative to historically achieved rates.
Finally, our process analyses showed that after having participated in a LU project, even highly skilled developers reported significant increases in data collection skills that are important elements of the LU idea generation process.
Our findings on outcomes seem remarkably strong – the question is: are they real? Recall from section 2 that research into the sources of innovation shows that users are frequently the developers of innovations that later become the basis for important new commercial products because they are frequently better positioned than are manufacturers to develop such innovations. Our view is that the good relative performance of the LU method is largely due to the fact that it systematically exploits this rich source of leading-edge need and solution information, whereas, traditional processes and tools are not designed to access that information.
The quasi-experimental field setting for this research leads to a number of threats to validity. As our analyses involve both a cross sectional (X) component and
longitudinal component (L), we identify and comment upon the validity of these threats, as highlighted below:
1. Strategic use of the LU method to focus on breakthroughs (X only). We were concerned that 3M might have used this new method with its best people and charged them to create more breakthroughs. We could find only minor
differences between LU and non LU team members (Table 8) and all team members had similar incentives to seek breakthroughs.
2. Historic regimes for major product lines were different (L only). Several of our hypotheses depend on an assumption of stationarity of historical NPD processes, permitting the pre-1997 period to be compared with the post-1997 period. While we are concerned about this issue, 3M has always been known as an “innovation company,” and we could find no evidence of lack of emphasis on high impact innovations at 3M at any time during the past half century.
3. Inaccurate matching (Both X and L). A non-experimental setting is always prone to selection bias. And we have no way of knowing how the post-1997 team members compared with pre-1997 members. Our skills profiles in the cross sectional component suggest that there are minor differences between team members’ backgrounds at best. We therefore could identify no compelling skills or background differences that could explain the large differences in outcomes. 4. Forecast bias (Both X and L). The use of forecasts for post-1997 projects is a
threat to validity. While we certainly cannot dismiss this threat, we believe that we have addressed the issue in a conservative way for three reasons. First, over 60% of the total sales for LU projects were derived from forecasts made by non LU participants (outside consulting firms or business analysts from other
divisions). So, the bulk of the forecast sales volume can be attributable to sources not involved in the LU process, mitigating participation-bias. Second, consistent with the literature and relative to historical company experience, we have used a fairly aggressive deflation factor. Third, at 3M (as at many companies) sales forecasts become revenue targets. Project participants have performance
incentives to understate forecasts so they can outperform the projections. (In a related context, Coller and Yoln, 1998 review the literature on bias in accuracy of management earnings forecasts and find that little systematic bias occurs).
5. Hawthorne or placebo effects (X only). These effects can be described as “I do better because extra attention is being paid to me or to my performance” and/or “I expect this process will work and so will strive to get the results that have been described to me”. While possible, these effects do not appear likely given the results of our fieldwork. At 3M, as at most companies, high profile activities are burdened by high management attention paid to those activities, resulting in more frequent reporting and restricted horizons. Also, our qualitative research showed that at 3M employees generally view new processes introduced to the company with skepticism rather than with the expectation that they will perform well. 3M has a strong cultural orientation to view radical new product innovation as an idiosyncratic, individual-level accomplishment and to consider a formally designated new product development team following pre-identified steps (a recipe) as too restricting to produce radical solutions.
All of the above concerns are legitimate and, given the limitations of field research, we have done our best to acknowledge and address them. However, the magnitude as well as the direction of the results appear compelling, an assessment that seems to be shared by 3M management.
“We were using traditional methods of marketing research in our division, and were able to achieve our corporate growth targets. However, we found that traditional techniques are not able to identify newly emerging breakthroughs in a rapidly-moving field like Telecoms. Now the Lead User process has been made the centerpiece of our
new idea generation activities for product breakthroughs, and we have an abundance of radical new ideas. The challenge now is finding resources for all of them.”
--Roger Lacey, VP of 3M Telecoms Division.
“This is probably the best process I’ve seen for replicating what originally made this company great. What made 3M was our people going out and creating solutions with leading edge customers. I think that, for a period of time, we lost a lot of that. It’s very hard to create a process that will do it. But this [the Lead User Process] is the closest that I’ve seen … I’m glad that it’s being adopted across the company.”
--Bill Coyne, 3M Senior VP of R&D. Section 6: Future Research
In the traditional idea generation paradigm, idea generation involves first identifying and quantifying the intensity of needs shared by many users. Next, internal manufacturer personnel strive to create an idea for a novel product that users will find responsive to those general needs - this being the problematic, non-routine part of the procedure. In contrast, the lead user idea generation paradigm assumes that key elements of the desired creative idea for a breakthrough product, process or service already exists among leading-edge users, with the problem being to find it and develop its potential. In other words, the key challenge in the traditional paradigm is idea generation, and in the lead user paradigm it is idea search.
The lead user paradigm opens up several research opportunities. Among these are: (1) replication in other organizations/over time, (2) new method development regarding how to identify users holding leading-edge information of commercial value; and (3) new methods to obtain that information and build it into commercially viable new product and service offerings.
Concerning opportunity 1, is there something unique about the 3M culture or environment that permitted this process to succeed there? It is possible that 3M lead user team members may gain easier access to experts than would team members from firms that did not have 3M’s reputation for innovation. Hence, it is important to see what aspects of the approach are transferable and what aspects might be unique to the 3M culture and climate. In addition, not until these ideas fully play out in the marketplace of successful products will we be able to fully assess the cost effectiveness of the approach. Hence, a cross-sectional, time-series research program would be a worthwhile follow-up to this work.
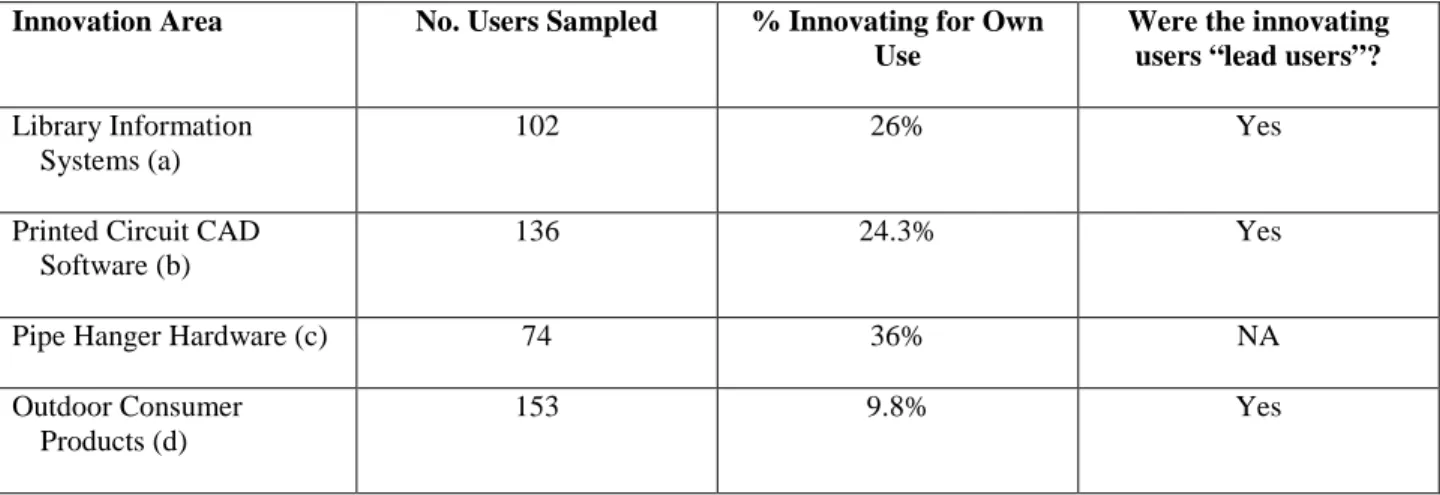
With respect to opportunities 2 and 3, we note that the LU process analyzed here utilizes a networking procedure to identify and learn from only a few carefully selected lead users both within and outside the target market. Other possibilities exist for mining lead user information that also deserve exploration. For example, consider the emerging evidence that lead user innovation is not rare. Indeed, it may be common that a
significant fraction of users at the leading edge of target marketplaces innovate in some way. In recent studies of user innovation in four areas, a significant fraction of users, ranging from 10% to 36%, report that they have developed or modified products (Table 10).
[Insert Table 10 here]
In light of this evidence, methods to process information from many lead users simultaneously could be developed and explored. The potential for such methods may be especially acute in the instance of consumer product and service markets. Note from Table 10 that Luthje found that 9.8% of a sample of consumers of outdoor sports-related goods (collected from samples of users who receive mail order catalogs from firms in
Germany with outdoor product lines similar to that of LL Bean) reported developing ideas for new or modified sporting products - with a significant fraction of these having developed prototypes. He also found that innovating users were lead users - experiencing needs ahead of the general market and expecting high benefits from a solution to those needs. The largest German club for outdoor sports enthusiasts has 610,000 members, suggesting that perhaps sixty thousand lead user innovations are present in this club alone. How can one find the individual gems within such a body of ore? Or is
identifying and evaluating each innovation independently the wrong approach? Perhaps the most commercially-promising innovations are the ones that rapidly spread within user communities in the form of user-made copies - in which case some form of evaluation by analysis of diffusion patterns might be useful.
Also note that the LU process used at 3M and described here involves "hunting and gathering" of innovations already developed by lead users. It may also be possible to "farm" lead user innovations by changing users' capabilities and/or incentives. Recall that lead users innovate when they are both capable of and expect to benefit from doing so. It is therefore possible to increase user innovation frequency and/or affect its direction by influencing capabilities, benefits or both. In some fields today, manufacturers affect user innovation patterns and frequency by providing users interested in developing their own custom products with "user toolkits for innovation." These kits contain development tools enabling users to modify specific types of existing products or create new ones at a reduced cost (von Hippel 1988, 2000).
In sum, we hope that these results will stimulate other researchers to explore and further develop what we see as a promising new paradigm for the idea generation phase of new
References
Armstrong, J. Scott, ed. (2001), Principles of Forecasting: A Handbook for Researchers and Practitioners, Kluwer: Norwell, Massachusetts.
Booz, Allen and Hamilton (1982) New Product Management for the 1980s (New York: Booz, Allen and Hamilton).
Coller, Maribeth and Yohn, Teri Lombardi (1998), “Management forecasts: What do we know?” Financial Analysts Journal, Vol. 54 (1), pp. 58-62.
Cook, Thomas D. and Donald T. Campbell (1979), Quasi-Experimentation: Design and Analysis Issues, Houghton-Mifflin, Boston.
Cooper, Robert G (1993) Winning at New Products: Accelerating the Process from Idea to Launch, (Addison Wesley: Reading MA).
Council of Economic Advisors (2000) Economic Report of the President,
www.access.gpo.gov/usbudget/fy2001/erp.html
Crispell, D. (1993), Virtual reality meets do-it-yourself, Folio: The magazine for Magazine Management, 22 (9) (May 15), pp. 25-26
Douglas, Mary (1986), How Institutions Think, Syracuse University Press: Syracuse NY Eliashberg, Jehoshua; Lilien, Gary L; and Rao, Vithala (1997) “Minimizing
Technological Oversights: A Marketing Research Perspective” Technological Innovation: Oversights and Foresights, Garud, Raghu; Nayyar, Praveen Rattan; and Shapira, Zur Baruch, eds., Cambridge University Press, New York, pp. 214- 230.
Enos, J. L., (1962) Petroleum Progress and Profits: A History of Process Innovation, Cambridge, MA: MIT Press.
Finke, Ronald A., Thomas B. Ward and Steven M. Smith (1992) Creative Cognition, MIT Press, Cambridge, MA.
Freeman, C., (1968), "Chemical Process Plant: Innovation and the World Market,"
National Institute Economic Review 45 (August), 29-57.
Gans, J. S. and Stern, S. (1999), "The Economics of User-Based Innovation," MIT Sloan School of Management Working Paper.
Glaser, Barney G. and Anselm L. Strauss (1967), The Discovery of Grounded Theory: Strategies for Qualitative Research. Aldine de Gruyter, Hawthorne, New York. Goldenberg, Jacob, Donald R. Lehmann and David Mazursky (2001) “The idea itself and
the circumstances of its emergence as predictors of new product success”
Management Science Vol 47, No 1 (January) 69-84.
Goldenberg, Jacob, David Mazursky, and Sorin Solomon (1999) “Toward identifying the inventive templates of new products: A channeled ideation approach,” Journal of Marketing Research, Vol 34, No 2 (May) 200-210.
Grassman, Winfried K (1981), Stochastic Systems for Management, North Holland: New York.
Griffin, Abbie, (1997), Drivers of NPD Success: The 1997 PDMA Report, Product Development & Management Association, Chicago, October.
Griffin, Abbie and Albert L. Page (1996), “PDMA Success Measurement Project: Recommended Measures for Product Development Success and Failure,”. Journal of Product Innovation Management 13:478-496.
Harhoff, Dietmar; Henkel, Joachim; and von Hippel, Eric (2000), “Profiting from voluntary information spillovers: How users benefit by freely revealing their innovations,” MIT Sloan Working Paper #4125 (July 25), pp. 1-26.
Herstatt, Cornelius, and Eric von Hippel (1992), "From Experience: Developing New Product Concepts Via the Lead User Method: A Case Study in a "Low Tech" Field",
Journal of Product Innovation Management, 1992;9: 213-221.
Knight, K.E., (1963), "A Study of Technological Innovation: The Evolution of Digital Computers" Unpublished Doctoral Dissertation, Carnegie Institute of Technology. Lave, Jean (1988), Cognition in Practice: Mind, Mathematics and Culture in everyday
Life, Cambridge, Massachusetts: Cambridge University Press.
Lionetta, W.G., Jr., (1977), "Sources of Innovation Within the Pultrusion Industry," Unpublished S.M. thesis, MIT Sloan School of Management.
Luthje, Christian (2000), "Characteristics of innovating users in a consumer goods field: An empirical study of sport-related product consumers," MIT Sloan School of Management working paper.
Malhotra, Naresh (1996), Marketing Research: An Applied Orientation, 2nd Ed, Englewood Cliffs, NJ, Prentice Hall.
Mansfield, Edwin, (1968), The Economics of Technological Change. New York: W. W. Norton & Company.
McQuarrie, Edward F. (1998) Customer visits: Building a better market focus Sage, Newbury Park, CA.