Footprints
1[OPEN]
Patrick Willems, Amna Mhamdi, Simon Stael, Veronique Storme, Pavel Kerchev, Graham Noctor, Kris Gevaert, and Frank Van Breusegem*
Department of Plant Systems Biology, VIB, 9052 Ghent, Belgium (P.W., A.M., S.S., V.S., P.K., F.V.B.); Department of Plant Biotechnology and Bioinformatics, Ghent University, 9052 Ghent, Belgium (P.W., A.M., S.S., V.S., P.K., F.V.B.); Medical Biotechnology Center, VIB, 9000 Ghent, Belgium (P.W., S.S., K.G.);
Department of Biochemistry, Ghent University, 9000 Ghent, Belgium (P.W., S.S., K.G.); Institut des Sciences des Plantes de Paris-Saclay, Unité Mixte de Recherche 8618, Centre National de la Recherche Scientifique, Université de Paris-Sud, 91405 Orsay cedex, France (A.M., G.N.); and Unité Mixte de Recherche 9213/Unité Mixte de Recherche 1403, Université Paris-Sud, Centre National de la Recherche Scientifique, Institut National de la Recherche Agronomique, Université d’Evry, Université Paris-Diderot, Sorbonne Paris-Cité, 91405 Orsay, France (A.M., G.N.)
ORCID IDs: 0000-0003-4667-2294 (P.W.); 0000-0001-9959-1362 (A.M.); 0000-0001-8322-0428 (S.S.); 0000-0003-4762-6580 (V.S.); 0000-0003-2737-0493 (P.K.); 0000-0002-4237-0283 (K.G.); 0000-0002-3147-0860 (F.V.B.).
In the last decade, microarray studies have delivered extensive inventories of transcriptome-wide changes in messenger RNA levels provoked by various types of oxidative stress in Arabidopsis (Arabidopsis thaliana). Previous cross-study comparisons indicated how different types of reactive oxygen species (ROS) and their subcellular accumulation sites are able to reshape the transcriptome in specific manners. However, these analyses often employed simplistic statistical frameworks that are not compatible with large-scale analyses. Here, we reanalyzed a total of 79 Affymetrix ATH1 microarray studies of redox homeostasis perturbation experiments. To create hierarchy in such a high number of transcriptomic data sets, all transcriptional profiles were clustered on the overlap extent of their differentially expressed transcripts. Subsequently, meta-analysis determined a single magnitude of differential expression across studies and identified common transcriptional footprints per cluster. The resulting transcriptional footprints revealed the regulation of various metabolic pathways and gene families. The RESPIRATORY BURST OXIDASE HOMOLOG F-mediated respiratory burst had a major impact and was a converging point among several studies. Conversely, the timing of the oxidative stress response was a determining factor in shaping different transcriptome footprints. Our study emphasizes the need to interpret transcriptomic data sets in a systematic context, where initial, specific stress triggers can converge to common, aspecific transcriptional changes. We believe that these refined transcriptional footprints provide a valuable resource for assessing the involvement of ROS in biological processes in plants.
Excessive levels of reactive oxygen species (ROS) cause cellular stress through damage to all classes of macromolecules and result in cell death. However, ROS also can act as signaling molecules in various biological processes (Van Breusegem et al., 2008; Mittal et al., 2014). In plants, ROS signaling has been documented in environmental stress perception (Suzuki et al., 2012), plant development (Liszkay et al., 2004), cell death (Levine et al., 1994), and the circadian clock (Lai et al., 2012), among others. To allow signaling, a tight regu-lation of ROS homeostasis is required. Whereas ROS levels can increase through metabolic perturbations leading to incomplete oxygen reduction and through activation of various ROS-producing enzymes, an ex-tensive enzymatic and nonenzymatic antioxidant ma-chinery is in place that tones down excessive ROS levels and thereby cogoverns cellular redox homeostasis (Mittler et al., 2011). Perturbations of ROS homeostasis trigger downstream signaling events via interactions
with individual proteins and signaling pathways (Rentel et al., 2004; Tognetti et al., 2012; Herrera-Vásquez et al., 2015). One consequence is the rearrangement of the transcriptome to assist in the protective mechanisms that contribute to the detoxification of ROS and the allevia-tion or repair of ROS-dependent cellular damage (Mittler et al., 2004). In this manner, transcriptional adjustments are essential to activate long-lasting local and systemic responses that allow improved resilience against subsequent perturbations (Suzuki et al., 2013). Over the past decade, changes in mRNA levels provoked by increased ROS levels have been comprehensively documented in Arabidopsis (Arabidopsis thaliana). Transcriptional changes caused by chemical (e.g. in-hibitors of mitochondrial and chloroplastic electron transfer chains; Clifton et al., 2005; Jung et al., 2013) and genetic (Vanderauwera et al., 2005; Sewelam et al., 2014) perturbations in ROS- scavenging enzymes, and adverse environmental conditions triggering ROS
production such as high light stress (Oelze et al., 2012; Jung et al., 2013), were monitored in dose- and time-dependent manners, mainly with the Affymetrix GeneChip Arabidopsis ATH1 Genome Array, which monitors levels of more than 20,000 transcripts simultaneously (Redman et al., 2004). In these experiments, the tran-scriptomes were found to be extensively reshaped. For instance, 2 h of reillumination of the singlet oxygen-generatingfluorescent(flu) mutant caused the increased expression of 1,356 genes (Laloi et al., 2007). A similar number of genes were differentially expressed in cata-lase (CAT)-deficient plants that accumulate hydrogen peroxide (H2O2) under mild photorespiratory conditions
(Queval et al., 2012).
Previous comparative studies assessed the relative contribution to changes in gene expression provoked by specific types of ROS, such as H2O2or singlet oxygen
(1O2), and/or by their accumulation in a particular subcellular compartment (Laloi et al., 2007; Sewelam et al., 2014), and demonstrated various ROS transcrip-tional footprints during developmental processes and abiotic and biotic stress conditions (Lai et al., 2012; Rosenwasser et al., 2013; Mor et al., 2014). To facilitate recognition of ROS transcriptional footprints, a vector-based algorithm, designated ROSMETER was de-veloped (Rosenwasser et al., 2013). In addition, we reanalyzed oxidative stress-related microarray stud-ies from a decade ago (Gadjev et al., 2006). Differen-tially expressed genes (DEGs) from nine microarray studies were intersected, and sets of general and ROS-specific marker transcripts were proposed (Gadjev et al., 2006). This simplistic, although often used, com-parative effort provides a straightforward way to deter-mine a common set of transcriptomic changes and is a good starting point for an initial comparison/assessment of the data sets (Larsson et al., 2006). Our pioneering meta-analysis turned out to be a useful framework for subsequent studies that assessed the involvement of ROS signaling in various biological processes in plants
(Jing et al., 2008; Rosenwasser et al., 2011; Peng et al., 2014; Jozefczak et al., 2015).
Despite the usefulness of our previous study, it is clear that it may have been limited by several statistical as well as practical pitfalls. Most importantly, each anal-ysis employed its own methodology and ad hoc criteria to determine DEGs (Larsson et al., 2006). Thereby, thefixed thresholds used to define significant differential expres-sion, such asPvalue and log2fold change (FC), greatly influenced the outcome and thus the interpretation. Moreover, intersection of DEG lists performs no real data integration but rather provides a consistency summary (Tseng et al., 2012). When applied to larger numbers of transcriptomic experiments, it also leads to cumbersome and complex visualization outputs. Another problem is that the identification of robust marker transcripts for specific perturbations among multiple experiments be-comes challenging given the inherent biological, experi-mental, and technical variations (Cahan et al., 2007). Recently, differential gene lists stated to be specific to certain treatments have been advised to be interpreted with caution, especially when DEG lists are intersected to discern specific or common transcriptional changes. It was suggested that the determination of a robust set of ROS marker genes would preferentially take place in consortiums of collaborating laboratories (Vaahtera et al., 2014). The large number of ROS-related micro-arrays generated by different laboratories encourages identification of such robust signatures by meta-analysis, as demonstrated in this article.
RESULTS
ROS-Related Microarray Data Sets
We compiled the data from 79 independent ATH1 microarray studies (680 CELfiles) from diverse exper-imental setups with disrupted ROS homeostasis (Fig. 1). ROS perturbations were provoked by chemical treatments and genetic modifications, environmental stresses, or combinations thereof. Genetic perturbations contained mutants for antioxidant enzymes (e.g. CAT) and ROS-producing proteins (e.g. respiratory burst oxidase homologs [RBOHs] and glycolate oxidase) but also ROS-related signal transducers and transcriptional regulators. All the microarray studies consisted either of one or multiple (time courses, multiple genotypes, or treatments) transcriptional profiles, resulting in a total of 157 profiles (Supplemental Table S1) that were or-ganized into 12 perturbation categories, each contain-ing between four and 34 profiles (Fig. 1). The largest category comprised ozone (O3)-, H2O2-, and superoxide (O2$2)-induced signaling, including various mutant backgrounds (seven profiles), chemical treatments with mitochondrial and chloroplastic electron transfer chain inhibitors (eight and 11 profiles, respectively), and di-rect applications of H2O2(five profiles) or O3(three
pro-files). Besides O3/H2O2/O2$2, 1O2- (five profiles) and nitric oxide-mediated transcript changes (six profiles) 1
This work was supported by the Ghent University Special Research Fund (grant no. 01J11311), the Ghent University Multi-disciplinary Research Partnership (Ghent BioEconomy grant no. 01MRB510W), the Interuniversity Attraction Poles Programme (grant no. IUAP P7/29), initiated by the Belgian Science Policy Office, Research Foundation- Flanders (grant no. G0D7914N to F.V.B. and J.M. and postdoctoral fellowship to S.S.), the Vlaamse Gemeenschap (grant no. Tournesol T2005.18), and the Agence Na-tionale de la Recherche (project Cynthiol; grant no. ANR12–BSV6– 0011 to G.N.).
* Address correspondence to frank.vanbreusegem@psb.ugent.be. The author responsible for distribution of materials integral to the
findings presented in this article in accordance with the policy de-scribed in the Instructions for Authors (www.plantphysiol.org) is: Frank Van Breusegem (frank.vanbreusegem@psb.ugent.be).
P.W. and F.V.B. conceived the project, analyzed the data, and wrote the article with contribution of all coauthors; A.M. and P.K. performed the transcriptomic experiments; V.S. provided statistical assistance; S.S., G.N., and K.G. completed the writing.
[OPEN]
Articles can be viewed without a subscription. www.plantphysiol.org/cgi/doi/10.1104/pp.16.00420
were discriminated as separate categories. Besides pro-voking increased ROS levels, distinction also was made for perturbed redox homeostasis in terms of decreased reductive power due to altered redox pools and reduced scavenging activities (15 profiles), including, among others, ascorbic acid biosynthesis mutants or treatments with antioxidants, such as reduced glutathione. Tran-scriptional profiles induced by photooxidative stress were included. In total, 17 high-light (HL) profiles were gathered from studies in which plants were shifted from low to high light intensities, and data also were included from analyses of the effect of irradiation with short wavelengths, such as UV-B (290–320 nm; 16 profiles) and g-rays (less than 10211 nm; five profiles). For the singleg-ray (Culligan et al., 2006) and three UV-B irra-diation studies (Ulm et al., 2004; Oravecz et al., 2006; Hahn et al., 2013), a short 15-min irradiation was fol-lowed by a recovery in which later time points were sampled. In contrast, two other UV-B studies exposed plants continuously for 1 h, 6 h (Favory et al., 2009), or 24 h (Kusano et al., 2011). To analyze the effects of photorespiratory challenge, studies were included that shifted plants from high to low CO2 concentrations (six profiles). To represent pathogen challenges, four flagellin22 (flg22)-triggered transcriptional profiles were integrated, becauseflg22 is known to activate the
RBOH-mediated oxidative burst (Li et al., 2014). Our meta-analysis also included 19 transcriptional profiles of reported ROS signaling components, such as tran-scription factors (TFs), photoreceptors, and retrograde signaling components. As ROS are known signaling compounds in organelle-to-nucleus retrograde com-munication (Galvez-Valdivieso and Mullineaux, 2010; Ng et al., 2014), our analysis also included separate categories for mitochondrial (10 profiles) and chloro-plastic (18 profiles) dysfunctions.
Identifying Similar Transcriptional Changes: the ROS Wheel
All raw microarray data sets (CELfiles) were pre-processed simultaneously, and differential expression of 21,430 genes was calculated for all 157 transcriptional profiles (see“Materials and Methods”). DEGs (P,0.01 and log2FC.1) were defined in each profile, resulting
in a number of DEGs ranging from 6,430 to only two per profile (specified in Supplemental Table S1). The lowest number of DEGs was found in a 1-h methyl viologen treatment of the experiments performed by the AtGenExpress consortium and is consistent with the relatively low number of DEGs reported previously
Figure 1. ROS transcriptional profiles and perturbation categories. Transcriptional profiles monitoring ROS homeostasis
per-turbations were classified under 12 categories (boldface text). For each perturbation category, the number of transcrip-tional profiles is given. These profiles monitor the transcriptranscrip-tional changes of chemical treatments, environmental stresses, and/or genetic backgrounds. cyt b6f, Cytochromeb6f; DMBIB, 2,5-dibromo-6-isopropyl-3-methyl-1,4-benzoquinone; FLS2, FLAGELLIN
SENSITIVE2; NO, nitric oxide; PNO8,N-octyl-3-nitro-2,4,6-trihydroxybenzamide; SOD, superoxide dismutase; VIS, visible.
for this treatment (Hahn et al., 2013). A large majority of transcriptional profiles (149 out of 157) yielded more than 50 DEGs. Similarity between all transcriptional profiles was scored by their pairwise DEG overlaps according to the Sorensen-Dice similarity coefficient (DSC) with formula DSC(a,b) = 2nab/(na+nb). Thus, as a
similarity measure, twice the DEG overlap of studies a and b (2nab) was divided by the sum of DEGs present
in both studies. It should be noted that the tolerant threshold used to define DEGs (P,0.01) offers more discriminative power between studies. This similarity measure had been employed previously to identify common Arabidopsis transcriptomic responses to different viruses (Postnikova and Nemchinov, 2012). We used the respective dissimilarity (1–DSC) directly as a distance measure for hierarchical clustering (see “Materials and Methods”). Hence, transcriptomes sharing many DEGs resided in close proximity to each other in the resulting radial clustering tree or ROS wheel (Fig. 2). Clusters below thefixed height cutoff of 0.8 are highlighted (Supplemental Fig. S1) and consist of at leastfive transcriptional profiles originating from a minimum of two independent studies. These criteria fit our objective to identify common footprints in dif-ferent microarray studies while at the same time fi l-tering out the clusters from transcriptional profiles originating from the same study.
With these criteria, eight clusters varying in size and perturbation characteristics were found. Cluster I con-tained four treatments of the chloroplast biogenesis inhibitors lincomycin or norflurazon and four tran-scriptional profiles ofgenome uncoupled(gun) mutants, which are known plastid retrograde signaling compo-nents during lincomycin- and norflurazon-provoked chloroplast dysfunction (Koussevitzky et al., 2007). It should be noted that the treatment of wild-type plants was compared againstgunmutants; thus, the resulting transcriptional profile should be interpreted as a proxy for GUN retrograde signaling. Clusters II and III con-sisted exclusively of transcription profiles triggered by HL exposures. By comparing the experimental details of the seven HL treatments of cluster II against thefive of cluster III, it is clear that factors, such as respective change in light intensity, growth conditions, and de-velopmental age (e.g. leaf versus seedling) do not ex-plain the division between the two clusters. However, a plausible underlying factor might be the duration of light exposure, ranging from 3 to 8 h in cluster II com-pared with shorter exposures (from 30 min to 2 h) in cluster III. Cluster IV contained a single perturbation category with six O3/H2O2/O2$2 transcriptional
pro-files. They originated from two independent studies that administered rotenone and oligomycin to cell cul-tures, inhibiting the mitochondrial electron transfer chain and ATP synthase, respectively, as well as H2O2 treatment of cell cultures (Clifton et al., 2005; Garmier et al., 2008).
The largest cluster was number V, which comprised 20 transcriptional profiles of various compounds that in-duced ROS directly or indirectly, such as methyl viologen,
antimycin A, oligomycin, dibromothymoquinone,
N-octyl-3-nitro-2,4,6-trihydroxybenzamide, and theflg22 peptide. In addition to these various treatments, the1O2
-generatingflumutant, the chloroplastic import mutant
plastid protein import2, O3fumigation, and 3- to 6-h UV-B
irradiations were included. Most analyses of the effect of UV-B irradiation were retrieved in cluster VI, which contained eight profiles surveying transcriptional changes after 15 min to 1 h of UV-B, as well as multiple early 1O2-induced transcriptional changes, such as a
30-min dark-to-light shift of theflumutant (Lee et al., 2007),1O2accumulation in cell cultures due to HL shift (González-Pérez et al., 2011), or treatment with the photosensitizer Rose Bengal (Gutiérrez et al., 2014). Therefore, we described this cluster as1O2-UV-B early.
A more prolonged reillumination (3 h) of theflu mu-tant was found together withfive O3/H2O2/O2$2
pro-files in cluster VII, including a previously unpublished microarray experiment in rbohF mutants that we per-formed to dissect the role of RBOHF in secondarily regulating gene expression triggered by H2O2 inside the cell (Supplemental Materials and Methods S1). More specifically, the transcriptome of cat2 mutants grown in long-day air from seeds was compared with that ofcat2 rbohfdouble mutants. Hence, the resulting transcriptional changes should be interpreted as the impact ofRBOHFduring oxidative stress.
Lastly, cluster VIII containedfive redox mutants, the photosynthesis acclimation double mutant state
tran-sition7 photosystem I subunit e1(Wassilewskija ecotype;
Pesaresi et al., 2009), two mutants inSUPPRESSOR OF
SA INSENSITIVITY OF NPR1-5(Mandal et al., 2012), a
2-d O3treatment, and three UV-B treatments ranging
from 12 to 24 h. Given the late timing of these oxidative stress treatments and the presence of constitutively perturbed redox mutants, we termed this cluster ROS acclimation. Both the O3study (Booker et al., 2012) and the UV-B studies of the AtGenExpress consortium (Hahn et al., 2013) contained transcriptional profiles of earlier time points that were also present in cluster V, which, as noted above, was the largest ROS cluster. This suggests that cluster V represents transcriptional changes that occur upstream of those present in cluster VIII. Conversely, the 1O2 and UV-B transcriptional profiles of cluster VI contained the 15-min, 30-min, and 1-h time points of the UV-B AtGenExpress study. Thus, the data suggest that the temporal aspect of the oxidative stress responses is an important factor, with transcriptomes from longer oxidative stress exposures (12–48 h) strongly similar to those of constitutively perturbed mutants. In addition to the discussed clus-ters, interesting relations between other studies also were found. For instance, thesnowy cotyledon3mutant, which displayed photoinhibition in response to al-tered CO2 concentrations (Albrecht et al., 2010), showed similarity to four high-to-low CO2shifts and
PSI mutations (Pesaresi et al., 2009). As such, our un-biased all-to-all comparison allows the discovery of novel relations between studies and formulation of new hypotheses.
Random-Effects Models Combining ROS-Induced Transcriptional Changes across Studies
Applied to a large-scale compendium of microarray experiments, our clustering strategy revealed similar transcriptional profiles sharing high numbers of DEGs.
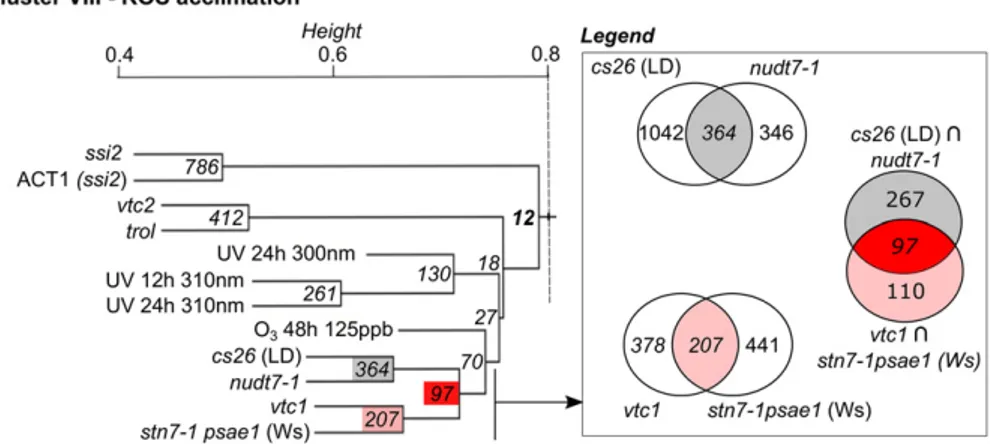
As our clustering approach was based on DEG over-laps, genes differentially expressed (P,0.01 and log2 FC.1) in all transcriptional profiles of a cluster could be extracted easily. For example, 12 transcripts were differentially expressed in all transcriptional profiles, or
Figure 2. The ROS wheel. All 157 transcriptional profiles were hierarchically clustered according their DEG overlap (see “Materials and
Methods”). The hierarchical tree was cut at a fixed height of 0.8 (Supplemental Fig. S1), and clusters that contained at least five profiles, originating from a minimum of two independent studies, are highlighted (clusters I–VIII; thick edges). The numbering of studies is specified in parentheses if a study contained multiple transcriptional profiles. Each profile is accompanied by a circle color coded according to its perturbation category (Supplemental Table S1). CC, Cell cultures; PTI, pattern-triggered immunity.
core DEGs, constituting acclimation cluster VIII (Fig. 3). For each cluster, the genes differentially expressed in all transcriptional profiles of the respective cluster are presented in Supplemental Table S2. However, such a DEG intersection approach is overly conservative and highly influenced byfixed thresholds.
Striving for a more robust identification of genes that were differentially expressed among the tran-scriptional profiles of a cluster, we employed an effect-size meta-analysis. We fitted random-effects models (REMs) with the transcript log2 FC and SE across all
transcriptional profiles of a cluster to determine a single expression change (see “Materials and Methods”). Figure 4A shows as an example the REM results for
GLUTAREDOXIN13 (AT1G03850) in cluster VIII.
GLUTAREDOXIN13 transcript levels were not
sig-nificantly different (P= 0.052) in one out of 12 tran-scriptional profiles of cluster VIII. However, the REM estimated a summarized expression change of 2.27 accompanied by a 95% confidence interval of 1.61 to 2.93. REMs werefitted for all other genes (21,430 in total) in cluster VIII treatments, resulting in the iden-tification of 335 induced and 34 repressed genes (Fig. 4B). We considered a transcript as higher expressed in a cluster when the CILB exceeded a log2FC of 0.58 (equal to FC of 1.5) or lower expressed in a cluster when the CIUB was below 20.58. This approach allowed us to recognize relatively small expression changes that were consistent across studies.
Together, the genes showing high (CILB.0.58) and low (CIUB, 20.58) expression in a cluster constitute
the transcriptional footprint of the cluster. The tran-scriptional footprints of each cluster are available in Supplemental Table S3. The largest extent of reprog-ramming was observed in the early HL cluster III, with a footprint consisting of 803 increased and 861 de-creased transcripts (Table I). Some clusters were characterized by a predominant repression or in-duction of transcripts. For instance, the chloroplast dysfunction cluster I footprint showed a repression of 652 genes, whereas only 33 genes were induced. An opposite scenario is present for the footprints of
theRBOHF(VII) and early1O2-UV-B (VI) clusters, in
which no decreased transcript levels were observed,
but 126 and 264 genes, respectively, were induced. The ROS cluster V footprint was most extensive, with 874 higher and 313 lower expressed genes. We compared the REM-derived transcriptional footprints with the ear-lier described core DEGs or genes fulfilling thefixed DEG criteria (P, 0.01 and log2FC. 1) in each profile of a
cluster. For each cluster, the core DEGs formed a small fraction of those identified by the REM (Supplemental Fig. S2). For example, only 10 core DEGs occurred in cluster V, whereas the REM identified 1,187 DEGs. Sim-ilarly, hundreds of additional DEGs were identified in other clusters. Taken together, the REM provides a sta-tistically robust method to identify differential transcripts that show consistent changes across multiple studies.
Transcriptional Regulation of Pathways and Gene Families under Redox Perturbations
To test whether the obtained transcriptional foot-prints showed the regulation of biological processes, we performed a gene set enrichment analysis (GSEA) on the induced and repressed genes shaping the REM-derived transcriptional footprints. Enrichment for Gene Ontology (GO) pathways (Kyoto Encyclopedia of Genes and Genomes [KEGG] and PlantCyc) and protein family gene sets was assessed using the PlantGSEA tool (Yi et al., 2013). Several gene sets were overrepresented (false discovery rate [FDR], 0.05) in the induced or repressed genes of the transcriptional footprints (Fig. 5A; Supplemental Table S4). As anticipated, the GO term response to oxidative stress was enriched in all clusters. In cluster I, chloroplast dysfunction caused an extensive repression of oxidative stress-responsive genes and chloroplast-associated gene sets such as the KEGG pathway photosynthesis (35 genes; FDR = 7.66e-29) and the cellular component GO set chloro-plast (519 genes; FDR = 5.49e-304). The GO term res-piratory burst was strongly represented (FDR,1e-25) among the induced genes of the footprints of clusters V to VIII. The oxidative burst is part of the KEGG pathway plant-pathogen interaction, which includes 138 genes (KEGG ath04626). This pathway was enriched among induced genes of the ROS cluster V, early
Figure 3. DEG overlaps between
transcrip-tional profiles of ROS acclimation cluster VIII. Cluster VIII was extracted from the hi-erarchical clustering tree (Supplemental Fig. S1), and the fixed height cutoff is shown (branched line). Node labels specify the DEG overlap between the respective tran-scriptional profiles or unions thereof (see inset). In total, 12 core DEGs (i.e. differen-tially expressed in all profiles) were found for cluster VIII (indicated in boldface). Ws, Wassilewskija accession.
UV-1O2 signaling cluster VI, and later acclimation cluster VIII footprints. The pathway also included members of overrepresented gene families such as Ca2+-binding proteins with an EF-hand domain and Ca2+-dependent protein kinases, receptor-like kinases (RLKs), and WRKY TFs. Moreover, several APETALA2/ ETHYLENE-RESPONSIVE ELEMENT-BINDING PROTEIN and HEAT SHOCK FACTOR families were induced, which is in accordance with their suggested roles as ROS response mediators (Miller and Mittler, 2006, Mor et al., 2014).
Whereas the transcriptional footprints of clusters mostly show enrichment of gene sets with increased or decreased transcript levels, RLKs were enriched among both higher and lower expressed genes of the ROS cluster V footprint. In total, 12 RLKs were repressed in ROS cluster V. Additionally, the early HL cluster III footprint contained several repressed RLKs, 44 in total, of which seven showed similarly decreased expression in ROS cluster V (Supplemental Fig. S3). However, several RLKs had opposite responses between both clusters, with low expression under short HL exposures but more abundant
expression in ROS cluster V. Different transcriptional regulation also was observed between early (cluster III) and prolonged (cluster II) light exposures. For instance, more prolonged light exposures in cluster II triggered strong induction offlavonoid biosynthesis genes (FDR = 1.57e-03; Fig. 5B). One example is the TF MYB DOMAIN PROTEIN75, which is the most strongly induced gene in the late HL cluster II footprint (log2FC = 4.20, 95% con-fidence interval 3.58, 4.83) and is a known activator of anthocyanin biosynthesis (Teng et al., 2005). Induction of MYB DOMAIN PROTEIN75 and anthocyanin genes was reported to be impaired in the redox-perturbed vitamin C-deficient mutantsvtc1andvtc2(Page et al., 2012), which are part of cluster VIII. Thus, our GSEA analysis allows the identification of the transcriptional regulation of different biological processes in the footprints.
The Respiratory Burst as a Convergence Point in Transcriptional Imprinting
As indicated by the GSEA analysis, induced genes of clusters IV to VIII footprints were enriched in the
Figure 4. REMs for GLUTAREDOXIN13 and all genes in cluster VIII. A, REM for GLUTAREDOXIN13 (GRXS13; AT1G03850), showing
the log2FCs with their 95% confidence interval (95% CI) andPvalues (P.0.01 in red) for the 12 transcriptional profiles constituting
cluster VIII. The differential expression effect size determined by the REM is indicated at the bottom (boldface text). Ws, Wassilewskija accession. B, Transcriptional footprint of cluster VIII. REMs were fitted for all 21,430 genes (GRXS13 indicated in red), and a gene was considered to be significantly more highly expressed when the lower boundary of the confidence interval (CILB) was greater than a log2FC of 0.58 (FC of 1.5) or less expressed when the upper boundary of the confidence interval (CIUB) was smaller than a log2FC of20.58.
respiratory burst GO term. Cluster VII contained the transcriptional phenotype ofRBOHFunder stress. More specifically, the oxidative stress response in thecat2
mutant was compared with the response in thecat2
RBOHFdouble mutant. Hence, the resulting
transcrip-tional changes should be interpreted as transcriptranscrip-tional changes mediated byRBOHFduring oxidative stress. As can be observed in Supplemental Table S1, the deficiency
of RBOHF triggered a more severe transcriptional
re-sponse (367 DEGs) than RBOHD (44 DEGs). RBOHF
activity is a crucial regulator of pathogen responses and associated metabolic adjustments (Chaouch et al., 2012). Furthermore, RBOHF was shown to enhance ROS production and cell death during ozone treat-ment, unlike RBOHD (Xu et al., 2015a). The tran-scriptional footprint of theRBOHF-containing cluster VII was limited to 126 induced genes. As also suggested by the enrichment of the respiratory burst GO term in clusters IV to VIII (Fig. 5A), an RBOHF-mediated oxi-dative burst would be a logical converging point
Table I. DEGs selected from REM results for each cluster
DEGs were selected based on the CI limits (CILB.0.58 for increased expression and CIUB, 20.58 for
decreased expression).
Cluster Increased Expression (CILB.0.58) Decreased Expression (CIUB, 20.58)
I, GUN retrograde 33 652
II, HL late 641 581
III, HL early 803 861 IV, ROS cell cultures 202 219
V, ROS 874 313
VI,1O2-UV-B early 264 0
VII,RBOHF 126 0
VIII, ROS acclimation 355 34
Figure 5.GSEA of transcriptional footprints. A, Up- or down-regulated genes belonging to the transcriptional footprints of clusters
I to VIII (columns) were controlled for enrichment in GO biological process (BP), pathway, and protein family gene sets (rows) using the PlantGSEA tool (Yi et al., 2013; see “Materials and Methods”). Enrichment of gene sets (FDR,0.05) is colored in red (enriched induced genes) or blue (enriched repressed genes) according to their significance (2log FDR). AP2/EREBP, APETALA2 and ETHYLENE-RESPONSIVE ELEMENT BINDING PROTEIN; CDPK, CALCIUM-DEPENDENT KINASE; HSF, HEAT SHOCK FACTOR. B, Heat map displaying the summarized differential expression of flavonoid biosynthesis-associated genes in clusters I to VIII.
resulting in a similar transcriptional footprint across these clusters. To test this hypothesis, we compared the correlation of the summarized log2 FC of the 126
in-duced genes ofRBOHFcluster VII with their summa-rized expression changes in the footprints of clusters IV to VIII (Supplemental Fig. S4). The correlation and overlap ofRBOHF-activated genes (cluster VII) was most prominent with cluster V, which consists of 20 diverse ROS profiles. All 126 genes were present in this cluster (Pearson correlation of 42%; Supplemental Fig. S4), indicating thatRBOHF provokes a transcrip-tional effect that also is present in a diversity of oxidative stress perturbations. The GSEA analysis of theRBOHF
cluster VII revealed enrichment of three protein families: glutathioneS-transferases, WRKY TFs (Fig. 5A), and two mitochondrial alternative oxidases, AOX1d and AOX1a, which are both well-known stress-induced genes (Ng et al., 2014).RBOHF-driven changes in expression were imprinted in diverse redox homeostasis-related tran-scriptomes, which is consistent with the marked effects of the loss of this NADPH oxidase function on cellular redox state, metabolite profiles, and pathogen resistance (Chaouch et al., 2012).
ROS Transcriptional Footprints Are Found in Environmental Stress-Triggered
Transcriptional Responses
The transcriptional footprints can be employed directly to hunt for similar transcriptomes in Genevestigator with the signature search functionality (Hruz et al., 2008). The footprint of cluster VIII (355 induced and 34 re-pressed genes) was used to retrieve perturbations with similar transcriptional changes (Supplemental Fig. S5). Besides the perturbations that are part of the cluster itself (e.g.vtc2and vtc1), several additional perturba-tions were retrieved. These included the antioxidant mutantvitamin E deficient2 (Maeda et al., 2014), Ca2+ signaling calmodulin binding transcription activator mu-tants, and the Ca2+/H+ exchanger double mutantcax1 cax3. In addition, deficiency of pathogen resistance genes, such asENHANCED DISEASE RESISTANCE1, incuba-tion with the salicylic acid analog benzothiadiazole (2 d), inoculations with plant pathogens (3 d), and insect-plant interactions (Bemisia tabaci; 7 d) were found. Lastly, in-clusion of thesuppressor of npr1-1mutant, which nega-tively regulates NPR1-mediated SA signaling in systemic acquired resistance (Li et al., 1999), suggested that this cluster could be considered as a transcriptional footprint associated with systemic acquired resistance and sys-temic acclimation.
We performed the same analysis for the early 1O2 -UV-B cluster VI footprint (264 induced genes) men-tioned above. High similarities were found with several cold, drought, osmotic, and salt transcriptional profiles (Supplemental Fig. S6). Early osmotic and salt stress time points from the AtGenExpress consortium were retrieved (Hahn et al., 2013). Both abiotic stresses had been considered to display a common plant core
environmental stress response (PCESR; Hahn et al., 2013). Representative PCESR genes were defined as 56 genes that were differentially expressed in UV-B, osmotic, salt, and wounding stress (Hahn et al., 2013). This gene set, from which 54 genes were present on the updated probe set annotation (see “Materials and Methods”), was compared with the footprints of clus-ters V, VI, and VIII. These clusclus-ters showed a strong
Figure 6. Comparison of transcriptional footprints in clusters V, VI, and
VII with the previous meta-analysis. DEG intersection gene lists de-scribed by Hahn et al. (2013; A), Mor et al. (2014; B), and Gadjev et al. (2006; C) were compared with transcriptional footprints of clusters V, VI, and VIII. Our probe set annotation caused the loss of three of the PCESR and five of the1O
2core gene sets.
enrichment (FDR, 1e-25) of the GO term respiratory burst (Fig. 5) and were mentioned before to contain transcriptional profiles spaced in time during the oxi-dative stress response. The comparison of the PCESR gene set (Hahn et al., 2013) indicated that 45 out of 54 (83%) genes overlapped with genes that are part of clusters V, VI, or VIII footprints (Fig. 6A). The footprint of cluster VI had 24 PCESR genes in common, sug-gesting early1O2signaling as an important factor in the environmental stress response. The presence of 1O2
transcriptome footprints in biotic and abiotic stresses was observed previously (Mor et al., 2014). Mor et al. (2014) determined a 1O2-responsive set of 118 core
genes byfiltering genes differentially expressed in nine out of 12 microarray experiments after 10 min to 1 h of stress. The footprints of clusters V and VI reported in total 95% of this 1O2 core gene set (Fig. 6B) and, in
contrast, the ROS acclimation cluster VIII only a small fraction (20 genes) that also was found in ROS cluster V. Finally, the meta-analysis conducted by our labora-tory a decade ago reported 32 marker transcripts that were differentially expressed in at least six of the eight ROS-related microarrays (Gadjev et al., 2006). The footprints of clusters V, VI, and VIII reported 29 of these 32 genes (91%; Fig. 6C). Thus, our analysis here reveals transcriptional footprints that are consistent with pre-viously conducted stress analyses (Hahn et al., 2013) or ROS-inspired meta-analysis (Gadjev et al., 2006; Mor et al., 2014).
Transcriptional Footprints Are Present in Oxidative Stress RNA Sequencing Studies
RNA sequencing (RNA-Seq) is increasingly used for transcriptomic studies, offering unbiased detection of (low-abundance) transcripts, a broader dynamic range, and improved sensitivity. Unlike the vast amounts of ATH1 microarray data that have documented oxidative stress responses at the transcript level, RNA-Seq studies are still outnumbered. Examples of oxidative stress RNA-Seq studies are a time-course experiment during reillumination of theflu mutant (Kim and Apel, 2013) and O3 treatments in different accessions (Xu et al.,
2015a, 2015b). In order to assess transcriptional changes upon photorespiratory stress, we conducted an addi-tional RNA-Seq study incat2mutants after 3 h of stress (Supplemental Materials and Methods S1). This resulted in an extensive transcriptomic reprogramming, with 3,571 significantly induced genes (log2 FC . 1 and
FDR,0.01) and 2,555 repressed genes (log2FC, 21 and FDR , 0.01; Supplemental Table S5). Such high numbers of DEGs also were retrieved after 2 h of flu
reillumination (3,187 genes; Kim and Apel 2013) or 2 h of O3treatment in the wild-type background (5,168 genes; Xu et al., 2015a).
We compared the 404 transcripts induced in the flu
mutant after 15 min of reillumination (Chen et al., 2015) and the 3,571 induced transcripts in cat2 after 3 h of photorespiratory stress with the transcriptional foot-prints of all clusters. It is important to note that genes not present on the microarray platform were filtered from the RNA-Seq study that omitted 631 (cat2) and 70 (flu) significantly induced genes. The transcriptional footprints showed high consistency with the induced genes of both RNA-Seq studies (Fig. 7). For instance, the induced genes in the cat2RNA-Seq study overlapped markedly with clusters IV to VIII. All genes of the
RBOHF cluster VII footprint were retrieved, whereas
approximately 85% to 95% of the footprints of clusters IV, V, VI, and VIII were induced in the RNA-Seq study. Smaller overlaps were observed for short (cluster III; 55%) and prolonged (cluster II; 19%) light exposure signatures. However,cat2plants were shifted to excess light for 3 h, which might explain a certain similarity to both HL clusters. Conversely, the flu RNA-Seq study shared only one gene with prolonged HL exposures (cluster II). Whereas the ROS acclimation cluster VIII shared 26 induced genes (7.3%) with the 15-min flu
study, the early1O2-UV-B cluster VI shared 105 DEGs, or 40% of the signature (Fig. 7). However, nearly all of these overlapping genes also were present in the 3-h
cat2 study (102 DEGs), suggesting that elevated tran-script levels of these genes are not restricted to early1O2
signaling. Besides the cat2 and flu experiments, O3 RNA-Seq studies (Xu et al., 2015a, 2015b) also were highly consistent with our transcriptional footprints. For instance, induced genes of the ROS cluster V footprint
Figure 7. Overlap of induced gene transcriptional
footprints and RNA-Seq studies. All induced genes (CILB.0.58) of clusters I to VIII intersected with
those from the 15-minfluand 3-hcat2RNA-Seq studies (FDR,0.01, log2FC.1). The
transcrip-tional footprints (xaxis) are colored according to their overlap with both RNA-Seq studies, with duced genes either not overlapping (gray) or in-duced in the 15-minflu(green), 3-hcat2(orange), or both RNA-Seq (dark red) studies.
were more than 90% present in O3treatments performed
in multiple Arabidopsis accessions (Xu et al., 2015a, 2015b), as shown in Supplemental Figure S7. Hence, our footprints also can be implemented on data obtained from RNA-Seq and support the biological relevance of our meta-analysis results.
DISCUSSION
Through a large-scale comparison of 79 ROS-related microarray studies (Fig. 1; Supplemental Table S1), we identified similar transcriptional profiles based on their extent of DEG overlap. Eight clusters of similar tran-scriptional profiles were obtained by hierarchical clus-tering and visualized in a circular clusclus-tering tree (ROS wheel; Fig. 2) that served as a starting point for a meta-analysis on the identified clusters. To determine a rep-resentative footprint, robust effect-size statistics were used to determine a single magnitude of differential expression for each cluster (Fig. 4). For each cluster, significantly induced or repressed genes shaped a rep-resentative ROS transcriptional footprint. The main insights from our study are that ROS footprints do not seem to correlate directly with subcellular production site or chemical type but that the timing of oxidative stress is a more determining factor. Our meta-analysis emphasizes the interpretation of ROS- or stress-related transcriptional changes in a mechanistic framework with the oxidative burst as a converging point after stress perception, eventually giving rise to systemic ROS-mediated acclimation.
Timing of Oxidative Stress Responses as the Determining Factor in Shaping the Transcriptome
Previously reported meta-analyses, including ours, of oxidative stress-related transcriptional responses mainly described transcriptional changes specific to subcellular production site or chemical type, which are governed by a complex, yet to be elucidated mechanism (Gadjev et al., 2006; Shapiguzov et al., 2012; Vaahtera et al., 2014). Our meta-analysis shows that ROS tran-scriptional footprints are determined primarily by temporal aspects. For instance, the ROS wheel indicates a footprint between several mutants affected in reduc-ing power in the ROS acclimation cluster VIII (Fig. 3). Such redox homeostasis mutants are constitutively perturbed, unlike the induced ROS accumulation trig-gered in other transcriptional profiles. Using the REM-derived transcriptional footprint of cluster VIII in the Genevestigator signature search tool revealed several microarray experiments with similar transcriptional footprints relating to salicylic acid-mediated systemic signaling during defense responses. During defense responses, salicylic acid signaling is preceded by ox-idative bursts in different cellular compartments (Herrera-Vásquez et al., 2015). The GO term respira-tory burst was strongly enriched (FDR,1e-25) in the footprints of clusters V to VIII. Furthermore, cluster
VII contained anRBOHFtranscriptional profile. The transcriptional footprint of thisRBOHF cluster con-sisted of 126 induced genes, and all of them also were induced in the largest ROS cluster V. This cluster was composed of 20 transcriptional profiles, including direct applications of O3, H2O2,flg22, or of electron
transfer chain-blocking chemicals,1O2provocations, a chloroplast import mutant, and 3 to 6 h of UV-B exposure. Interestingly, the 3- to 6-h O3 and UV-B perturbations belonged to a study in which later time points were part of the ROS acclimation cluster VII. Conversely, early 1O2-UV-B cluster VI consisted solely of early (15 min to 1 h) UV-B studies and different 1O2 signaling studies using Rose Bengal (Gutiérrez et al., 2014), HL treatments (González-Pérez et al., 2011), orflureillumination (Laloi et al., 2007). The 30-min flu reillumination was suggested previously by the ROSMETER as a unique1O2response (Rosenwasser et al., 2013), unlike the probably less spe-cific ROS responses at later time points. The early
1O
2-UV-B footprint of cluster VI in our meta-analysis
was highly consistent with a previously defined DEG set of a core plant stress response (Fig. 6B; Hahn et al., 2013) and supports the1O2-responsive gene set found
in early stress responses (Fig. 6C; Mor et al., 2014). Footprints associated with specific (subcellular) types of ROS probably exist, although they do not seem to be major discernible factors among diverse studies, ex-cept the early1O2 footprint of cluster VI. We believe
that the notion of specificity might have been used too easily, as stated before by Vaahtera et al. (2014). In-correct interpretations can arise from the simplistic ap-proach of previous meta-analyses but also due to the logical fact that specific, initial triggers can result later in converging (aspecific) transcriptional changes.
Determining Robust ROS Transcriptional Footprints
Recently, it had been proposed to use transcriptional marker signatures consisting of several genes instead of single marker genes to study ROS-specific transcrip-tional regulation (Vaahtera et al., 2014). The develop-ment of such representative ROS marker signatures would preferentially take place in a consortium of col-laborating laboratories (Vaahtera et al., 2014). Here, we determined robust ROS transcriptional footprints by reanalyzing the results of 79 studies derived from 45 different laboratories. Inherently, this kind of anal-ysis brings various interexperimental variability, due to factors such as laboratory-specific effects, development effects, and within-study variation. Previous micro-array meta-analyses indicated that a robust statistical analysis is impossible due to such inherent heteroge-neity of various experimental setups (Gadjev et al., 2006; Schwarzländer et al., 2012). Nevertheless, size-effect models are capable of combining independent microarray data (Choi et al., 2003; Stevens and Doerge, 2005; Larsson et al., 2006). An effect-size meta-analysis was implemented recently for Arabidopsis microarray
data (Rest et al., 2016), demonstrating to be a powerful approach to establish robust DEG sets. Here, we fitted REMs to determine a single differential expression effect across transcriptional profiles constituting a cluster (Fig. 4). The REM weighs transcriptional changes by the sum of true variation among studies and sampling within stud-ies, providing effect sizes based on differential expression. Whereas multiple methods exist to correct for variation (Cheng et al., 2009; Chen et al., 2011), such a procedure was not used here to maintain expression changes related to the diverse experimental setups included in our meta-analysis. REMs werefitted for the eight clusters identified in the ROS wheel (Fig. 2). Significantly induced or re-pressed genes were identified per cluster, together con-stituting a representative transcriptional footprint (Table I). Importantly, the REM facilitates the detection of lowly expressed genes, but consistently DEGs, which are missed in single microarray studies and might elucidate new functions for these genes (Rest et al., 2016).
In conclusion, using a meta-analysis of 79 ROS micro-array data sets, we were able to identify robust ROS tran-scriptional footprints that can be a valuable resource for the plant community in future ROS-related research. Such signatures will help both in understanding the mecha-nisms underlying oxidative stress responses and in evalu-ating the roles of ROS in a given biological process in plants.
MATERIALS AND METHODS Microarray Data
In total, 680 CELfiles of 79 independent studies were collected from the public repositories Gene Expression Omnibus (GEO; http://www.ncbi.nlm.nih.gov/ geo/) and ArrayExpress (http://www.ebi.ac.uk/arrayexpress/), requested from authors, or conducted in-house. The included microarray data were controlled for quality, and four unpublished microarray studies were included (Supplemental Materials and Methods S1).
Microarray Data Processing and Differential Statistics All raw intensityfiles were normalized by robust multiarray averaging (Irizarry et al., 2003) using the affy package (version 1.40.0) of R/Bioconductor (Gautier et al., 2004). Probe sets were up to date using The Arabidopsis Infor-mation Resource 10 CDF annotation retrieved from BrainArray (The Arabidopsis Information Resource G version 18.0.0 [http://www.brainarray.mbni.med. umich.edu/]; Dai et al., 2005). Differential gene expression was analyzed by the limma package (version 3.18.13) using empirical Bayes-moderatedtstatistics (Smyth, 2005). Perturbations were contrasted discriminated versus the control condition (ROS/control). In the case of genetic perturbations, wild-type or gain-of-function plants were distinguished against loss-gain-of-function or control lines.
Similarity Transcriptional Profiles and
Hierarchical Clustering
DEGs were selected for each transcriptomic response, usingP#0.01 as a significance threshold and a log2FC greater than 1 or less than21. This
rela-tively tolerant threshold was chosen to select DEGs less restricrela-tively, which would favor discrimination between similar profiles in our clustering analysis. Pairwise similarity between each DEG list was assessed using the DSC:
DSCða;bÞ ¼ 2na;b
naþnb
wherenaandnbrepresents the DEGs of two independent studies, treating genes
with low or high expression as separate entities. Hence, a DSC from two dif-ferent experiments will range from 0 to 1, with 1 indicating an identical DEG
set. Subsequently, the Dice dissimilarity (12DSC) matrix was used as a dis-tance measure for hierarchical clustering (average linkage) in R. Clusters were assigned using afixed-height threshold (Supplemental Fig. S1). To generate the ROS wheel, the corresponding Newick tree was created using the write.tree function of the ape package (version 3.2; Paradis et al., 2004) in R. The Newick tree was imported and transformed to a radial layout in Dendroscope3 (Huson and Scornavacca, 2012).
REM
Differential expression was combined across studies byfitting a REM. Studies were weighted by the sum of true variation among studies and sam-pling within studies, providing effect sizes based on differential expression. REMs werefitted for each probe set individually (21,430 in total) using the log2
FCs and correspondingSEvalues of all the individual transcriptional profiles constituting a transcriptional cluster. The model for the estimated log2FC in
study i, denoted asyi, can be written as:
yi¼uiþei
whereuiis the true effect of study i andei;N ð0;viÞ, withvithe known
sam-pling variance of study i. Variability introduced by differences in the methods of the various studies is accommodated by treating this variability as a random effect:
ui¼mþui
wheremis the average true effect andui;Nð0;t2Þ, witht2the amount of
heterogeneity among the true effects.
The metafor package in R (version 1.3-2; Viechtbauer 2010) was used tofit REMs for each gene separately using restricted maximum likelihood to estimate the true average effect and the amount of heterogeneity,t2.
GSEA
Functional class enrichment was analyzed with the Plant Gene Set Enrichment Analysis Toolkit (http://structuralbiology.cau.edu.cn/PlantGSEA/; Yi et al., 2013). Gene families were enriched for PlantCyc, KEGG, and GO biological pro-cesses and cellular component gene sets using the background for Arabidopsis (Arabidopsis thaliana) and running on default parameters.
Accession Numbers
The RNA-Seq data discussed in this article have been deposited in the GEO repository (http://www.ncbi.nlm.nih.gov/geo/) and are accessible through the GEO accession GSE77171. Unpublished microarray studies for 24-h 10 mM
H2O2and 400- to 100-ppm CO2shift are available under the GEO accessions
GSE80200 and GSE80158, respectively. The 24-h restricted gas continuous light incat2mutants and mild photorespiratory stress incat2 rbohfandcat2 rbohd
double mutants are available under the GEO accessions GSE66365 and GSE81516, respectively.
Supplemental Data
The following supplemental materials are available.
Supplemental Figure S1. Hierarchical clustering tree of transcriptional profiles and cluster identification.
Supplemental Figure S2.Performance REM and traditional DEG list in-tersection approach.
Supplemental Figure S3.Transcriptional regulation of RLKs.
Supplemental Figure S4. Correlation and overlap of induced DEGs of
RBOHFcluster VII with ROS cluster V.
Supplemental Figure S5.Use of the cluster VIII footprint in the Genevestigator signature search tool (Hruz et al., 2008).
Supplemental Figure S6.Use of the cluster VI footprint in the Genevestigator signature search tool (Hruz et al., 2008).
Supplemental Figure S7.Overlap ROS cluster V footprint with RNA-Seq results of O3treatments.
Supplemental Table S1.Experimental details, perturbation category, and number of DEGs (P,0.01 and log2FC.1) of the transcriptional
pro-files.
Supplemental Table S2.Core gene sets of clusters I to VIII.
Supplemental Table S3.Cluster I to VIII REM result for all 21,430 genes.
Supplemental Table S4.GESA for lower and higher expressed genes of clusters I to VIII.
Supplemental Table S5.RNA-Seq results after a 3-h photorespiratory stress incat2mutants.
Supplemental Materials and Methods S1.Description of microarray qual-ity control and experimental details from unpublished microarray ex-periments and RNA-Seq studies.
ACKNOWLEDGMENTS
We thank Olivier Van Aken and Alessandro Alboresi for providing micro-array data available to us and Yvan Saeys for helpful discussions during the course of this research.
Received March 20, 2016; accepted May 30, 2016; published May 31, 2016. LITERATURE CITED
Albrecht V, Simková K, Carrie C, Delannoy E, Giraud E, Whelan J, Small ID, Apel K, Badger MR, Pogson BJ(2010) The cytoskeleton and the peroxisomal-targeted snowy cotyledon3 protein are required for chlo-roplast development inArabidopsis. Plant Cell22:3423–3438
Booker F, Burkey K, Morgan P, Fiscus E, Jones A(2012) Minimal influence of G-protein null mutations on ozone-induced changes in gene expres-sion, foliar injury, gas exchange and peroxidase activity inArabidopsis thalianaL. Plant Cell Environ35:668–681
Cahan P, Rovegno F, Mooney D, Newman JC, St Laurent G III, McCaffrey TA(2007) Meta-analysis of microarray results: challenges, opportunities, and recommendations for standardization. Gene401:12–18
Chaouch S, Queval G, Noctor G(2012) AtRbohFis a crucial modulator of defence-associated metabolism and a key actor in the interplay between intracellular oxidative stress and pathogenesis responses in Arabi-dopsis. Plant J69:613–627
Chen C, Grennan K, Badner J, Zhang D, Gershon E, Jin L, Liu C(2011) Removing batch effects in analysis of expression microarray data: an evaluation of six batch adjustment methods. PLoS ONE6:e17238
Chen S, Kim C, Lee JM, Lee HA, Fei Z, Wang L, Apel K(2015) Blocking the QB-binding site of photosystem II by tenuazonic acid, a non-host-specific toxin ofAlternaria alternata, activates singlet oxygen-mediated and EXECUTER-dependent signalling inArabidopsis. Plant Cell Environ
38:1069–1080
Cheng C, Shen K, Song C, Luo J, Tseng GC(2009) Ratio adjustment and calibration scheme for gene-wise normalization to enhance microarray inter-study prediction. Bioinformatics25:1655–1661
Choi JK, Yu U, Kim S, Yoo OJ(2003) Combining multiple microarray studies and modeling interstudy variation. Bioinformatics (Suppl 1)19:
i84–i90
Clifton R, Lister R, Parker KL, Sappl PG, Elhafez D, Millar AH, Day DA, Whelan J(2005) Stress-induced co-expression of alternative respiratory chain components inArabidopsis thaliana. Plant Mol Biol58:193–212
Culligan KM, Robertson CE, Foreman J, Doerner P, Britt AB(2006) ATR and ATM play both distinct and additive roles in response to ionizing radiation. Plant J48:947–961
Dai M, Wang P, Boyd AD, Kostov G, Athey B, Jones EG, Bunney WE, Myers RM, Speed TP, Akil H, et al(2005) Evolving gene/transcript definitions significantly alter the interpretation of GeneChip data. Nu-cleic Acids Res33:e175
Favory JJ, Stec A, Gruber H, Rizzini L, Oravecz A, Funk M, Albert A, Cloix C, Jenkins GI, Oakeley EJ, Seidlitz HK, Nagy F, Ulm R(2009) Interaction of COP1 and UVR8 regulates UV-B-induced photomorpho-genesis and stress acclimation inArabidopsis. EMBO J28:591–601
Gadjev I, Vanderauwera S, Gechev TS, Laloi C, Minkov IN, Shulaev V, Apel K, Inzé D, Mittler R, Van Breusegem F(2006) Transcriptomic
footprints disclose specificity of reactive oxygen species signaling in Arabidopsis. Plant Physiol141:436–445
Galvez-Valdivieso G, Mullineaux PM(2010) The role of reactive oxygen species in signalling from chloroplasts to the nucleus. Physiol Plant138:
430–439
Garmier M, Carroll AJ, Delannoy E, Vallet C, Day DA, Small ID, Millar AH(2008) Complex I dysfunction redirects cellular and mitochondrial metabolism in Arabidopsis. Plant Physiol148:1324–1341
Gautier L, Cope L, Bolstad BM, Irizarry RA(2004) affy: analysis of Affy-metrix GeneChip data at the probe level. Bioinformatics20:307–315
González-Pérez S, Gutiérrez J, García-García F, Osuna D, Dopazo J, Lorenzo Ó, Revuelta JL, Arellano JB(2011) Early transcriptional de-fense responses in Arabidopsis cell suspension culture under high-light conditions. Plant Physiol156:1439–1456
Gutiérrez J, González-Pérez S, García-García F, Daly CT, Lorenzo O, Revuelta JL, McCabe PF, Arellano JB(2014) Programmed cell death activated by Rose Bengal inArabidopsis thalianacell suspension cultures requires functional chloroplasts. J Exp Bot65:3081–3095
Hahn A, Kilian J, Mohrholz A, Ladwig F, Peschke F, Dautel R, Harter K, Berendzen KW, Wanke D(2013) Plant core environmental stress re-sponse genes are systemically coordinated during abiotic stresses. Int J Mol Sci14:7617–7641
Herrera-Vásquez A, Salinas P, Holuigue L(2015) Salicylic acid and reac-tive oxygen species interplay in the transcriptional control of defense genes expression. Front Plant Sci6:171
Hruz T, Laule O, Szabo G, Wessendorp F, Bleuler S, Oertle L, Widmayer P, Gruissem W, Zimmermann P(2008) Genevestigator v3: a reference expression database for the meta-analysis of transcriptomes. Adv Bio-informatics2008:420747
Huson DH, Scornavacca C(2012) Dendroscope 3: an interactive tool for rooted phylogenetic trees and networks. Syst Biol61:1061–1067
Irizarry RA, Hobbs B, Collin F, Beazer-Barclay YD, Antonellis KJ, Scherf U, Speed TP(2003) Exploration, normalization, and summaries of high density oligonucleotide array probe level data. Biostatistics4:249–264
Jing HC, Hebeler R, Oeljeklaus S, Sitek B, Stühler K, Meyer HE, Sturre MJG, Hille J, Warscheid B, Dijkwel PP(2008) Early leaf senescence is associated with an altered cellular redox balance inArabidopsis cpr5/old1
mutants. Plant Biol (Stuttg) (Suppl 1)10:85–98
Jozefczak M, Bohler S, Schat H, Horemans N, Guisez Y, Remans T, Vangronsveld J, Cuypers A(2015) Both the concentration and redox state of glutathione and ascorbate influence the sensitivity of Arabi-dopsis to cadmium. Ann Bot (Lond)116:601–612
Jung HS, Crisp PA, Estavillo GM, Cole B, Hong F, Mockler TC, Pogson BJ, Chory J(2013) Subset of heat-shock transcription factors required for the early response ofArabidopsisto excess light. Proc Natl Acad Sci USA
110:14474–14479
Kim C, Apel K(2013) Singlet oxygen-mediated signaling in plants: moving fromflu to wild type reveals an increasing complexity. Photosynth Res
116:455–464
Koussevitzky S, Nott A, Mockler TC, Hong F, Sachetto-Martins G, Surpin M, Lim J, Mittler R, Chory J(2007) Signals from chloroplasts converge to regulate nuclear gene expression. Science316:715–719
Kusano M, Tohge T, Fukushima A, Kobayashi M, Hayashi N, Otsuki H, Kondou Y, Goto H, Kawashima M, Matsuda F, Niida R, Matsui M, Saito K, Fernie AR (2011) Metabolomics reveals comprehensive re-programming involving two independent metabolic responses of Ara-bidopsis to UV-B light. Plant J67:354–369
Lai AG, Doherty CJ, Mueller-Roeber B, Kay SA, Schippers JH, Dijkwel PP (2012) CIRCADIAN CLOCK-ASSOCIATED 1 regulates ROS ho-meostasis and oxidative stress responses. Proc Natl Acad Sci USA109:
17129–17134
Laloi C, Stachowiak M, Pers-Kamczyc E, Warzych E, Murgia I, Apel K
(2007) Cross-talk between singlet oxygen- and hydrogen peroxide-dependent signaling of stress responses inArabidopsis thaliana. Proc Natl Acad Sci USA
104:672–677
Larsson O, Wennmalm K, Sandberg R(2006) Comparative microarray analysis. OMICS10:381–397
Lee KP, Kim C, Landgraf F, Apel K(2007) EXECUTER1- and EXECUTER2-dependent transfer of stress-related signals from the plastid to the nu-cleus ofArabidopsis thaliana. Proc Natl Acad Sci USA104:10270–10275
Levine A, Tenhaken R, Dixon R, Lamb C(1994) H2O2from the oxidative
burst orchestrates the plant hypersensitive disease resistance response. Cell79:583–593
Li L, Li M, Yu L, Zhou Z, Liang X, Liu Z, Cai G, Gao L, Zhang X, Wang Y, et al(2014) The FLS2-associated kinase BIK1 directly phosphorylates the NADPH oxidase RbohD to control plant immunity. Cell Host Microbe
15:329–338
Li X, Zhang Y, Clarke JD, Li Y, Dong X(1999) Identification and cloning of a negative regulator of systemic acquired resistance, SNI1, through a screen for suppressors ofnpr1-1. Cell98:329–339
Liszkay A, van der Zalm E, Schopfer P(2004) Production of reactive oxygen intermediates (O2$2, H2O2, and$OH) by maize roots and their
role in wall loosening and elongation growth. Plant Physiol136:3114–
3123, discussion 3001
Maeda H, Song W, Sage T, Dellapenna D(2014) Role of callose synthases in transfer cell wall development in tocopherol deficient Arabidopsis
mutants. Front Plant Sci5:46
Mandal MK, Chandra-Shekara AC, Jeong RD, Yu K, Zhu S, Chanda B, Navarre D, Kachroo A, Kachroo P(2012) Oleic acid-dependent modu-lation of NITRIC OXIDE ASSOCIATED1 protein levels regulates nitric oxide-mediated defense signaling inArabidopsis. Plant Cell 24:1654–
1674
Miller G, Mittler R(2006) Could heat shock transcription factors function as hydrogen peroxide sensors in plants? Ann Bot (Lond)98:279–288
Mittal M, Siddiqui MR, Tran K, Reddy SP, Malik AB(2014) Reactive oxygen species in inflammation and tissue injury. Antioxid Redox Signal
20:1126–1167
Mittler R, Vanderauwera S, Gollery M, Van Breusegem F(2004) Reactive oxygen gene network of plants. Trends Plant Sci9:490–498
Mittler R, Vanderauwera S, Suzuki N, Miller G, Tognetti VB, Vandepoele K, Gollery M, Shulaev V, Van Breusegem F(2011) ROS signaling: the new wave? Trends Plant Sci16:300–309
Mor A, Koh E, Weiner L, Rosenwasser S, Sibony-Benyamini H, Fluhr R
(2014) Singlet oxygen signatures are detected independent of light or chloroplasts in response to multiple stresses. Plant Physiol165:249–261
Ng S, De Clercq I, Van Aken O, Law SR, Ivanova A, Willems P, Giraud E, Van Breusegem F, Whelan J(2014) Anterograde and retrograde regu-lation of nuclear genes encoding mitochondrial proteins during growth, development, and stress. Mol Plant7:1075–1093
Oelze ML, Vogel MO, Alsharafa K, Kahmann U, Viehhauser A, Maurino VG, Dietz KJ(2012) Efficient acclimation of the chloroplast antioxidant defence ofArabidopsis thalianleaves in response to a 10- or 100-fold light increment and the possible involvement of retrograde signals. J Exp Bot63:1297–1313
Oravecz A, Baumann A, Máté Z, Brzezinska A, Molinier J, Oakeley EJ, Ádám E, Schäfer E, Nagy F, Ulm R(2006) CONSTITUTIVELY PHOTOMORPHOGENIC1 is required for the UV-B response inArabidopsis. Plant Cell18:1975–1990
Page M, Sultana N, Paszkiewicz K, Florance H, Smirnoff N(2012) The influence of ascorbate on anthocyanin accumulation during high light acclimation inArabidopsis thaliana: further evidence for redox control of anthocyanin synthesis. Plant Cell Environ35:388–404
Paradis E, Claude J, Strimmer K(2004) APE: Analyses of Phylogenetics and Evolution in R language. Bioinformatics20:289–290
Peng J, Li Z, Wen X, Li W, Shi H, Yang L, Zhu H, Guo H(2014) Salt-induced stabilization of EIN3/EIL1 confers salinity tolerance by deter-ring ROS accumulation inArabidopsis. PLoS Genet10:e1004664
Pesaresi P, Hertle A, Pribil M, Kleine T, Wagner R, Strissel H, Ihnatowicz A, Bonardi V, Scharfenberg M, Schneider A, et al(2009)Arabidopsis
STN7 kinase provides a link between short- and long-term photosyn-thetic acclimation. Plant Cell21:2402–2423
Postnikova OA, Nemchinov LG(2012) Comparative analysis of micro-array data in Arabidopsis transcriptome during compatible interactions with plant viruses. Virol J9:101
Queval G, Neukermans J, Vanderauwera S, Van Breusegem F, Noctor G
(2012) Day length is a key regulator of transcriptomic responses to both CO2and H2O2inArabidopsis. Plant Cell Environ35:374–387
Redman JC, Haas BJ, Tanimoto G, Town CD(2004) Development and evaluation of anArabidopsis whole genome Affymetrix probe array. Plant J38:545–561
Rentel MC, Lecourieux D, Ouaked F, Usher SL, Petersen L, Okamoto H, Knight H, Peck SC, Grierson CS, Hirt H, et al(2004) OXI1 kinase is necessary for oxidative burst-mediated signalling inArabidopsis. Nature
427:858–861
Rest JS, Wilkins O, Yuan W, Purugganan MD, Gurevitch J(2016) Meta-analysis and meta-regression of transcriptomic responses to water stress in Arabidopsis. Plant J85:548–560
Rosenwasser S, Fluhr R, Joshi JR, Leviatan N, Sela N, Hetzroni A, Friedman H(2013) ROSMETER: a bioinformatic tool for the identifi ca-tion of transcriptomic imprints related to reactive oxygen species type and origin provides new insights into stress responses. Plant Physiol
163:1071–1083
Rosenwasser S, Rot I, Sollner E, Meyer AJ, Smith Y, Leviatan N, Fluhr R, Friedman H(2011) Organelles contribute differentially to reactive oxy-gen species-related events during extended darkness. Plant Physiol156:
185–201
Schwarzländer M, König AC, Sweetlove LJ, Finkemeier I (2012) The impact of impaired mitochondrial function on retrograde signalling: a meta-analysis of transcriptomic responses. J Exp Bot63:1735–1750
Sewelam N, Jaspert N, Van Der Kelen K, Tognetti VB, Schmitz J, Frerigmann H, Stahl E, Zeier J, Van Breusegem F, Maurino VG(2014) Spatial H2O2signaling specificity: H2O2from chloroplasts and
perox-isomes modulates the plant transcriptome differentially. Mol Plant7:
1191–1210
Shapiguzov A, Vainonen JP, Wrzaczek M, Kangasjärvi J(2012) ROS-talk: how the apoplast, the chloroplast, and the nucleus get the message through. Front Plant Sci3:292
Smyth GK(2005) limma: Linear Models for Microarray Data.InR Gen-tleman, V Carey, W Huber, R Irizarry, S Dudoit, eds, Bioinformatics and Computational Biology Solutions Using R and Bioconductor. Springer, New York, pp 397–420
Stevens JR, Doerge RW(2005) Combining Affymetrix microarray results. BMC Bioinformatics6:57
Suzuki N, Koussevitzky S, Mittler R, Miller G (2012) ROS and redox signalling in the response of plants to abiotic stress. Plant Cell Environ
35:259–270
Suzuki N, Miller G, Salazar C, Mondal HA, Shulaev E, Cortes DF, Shuman JL, Luo X, Shah J, Schlauch K, et al(2013) Temporal-spatial interaction between reactive oxygen species and abscisic acid regulates rapid systemic acclimation in plants. Plant Cell25:3553–3569
Teng S, Keurentjes J, Bentsink L, Koornneef M, Smeekens S (2005) Sucrose-specific induction of anthocyanin biosynthesis in Arabidopsis requires the MYB75/PAP1 gene. Plant Physiol139:1840–1852
Tognetti VB, Mühlenbock P, Van Breusegem F(2012) Stress homeostasis: the redox and auxin perspective. Plant Cell Environ35:321–333
Tseng GC, Ghosh D, Feingold E(2012) Comprehensive literature review and statistical considerations for microarray meta-analysis. Nucleic Acids Res40:3785–3799
Ulm R, Baumann A, Oravecz A, Máté Z, Ádám E, Oakeley EJ, Schäfer E, Nagy F(2004) Genome-wide analysis of gene expression reveals func-tion of the bZIP transcripfunc-tion factor HY5 in the UV-B response of Ara-bidopsis. Proc Natl Acad Sci USA101:1397–1402
Vaahtera L, Brosché M, Wrzaczek M, Kangasjärvi J(2014) Specificity in ROS signaling and transcript signatures. Antioxid Redox Signal 21:
1422–1441
Van Breusegem F, Bailey-Serres J, Mittler R(2008) Unraveling the tap-estry of networks involving reactive oxygen species in plants. Plant Physiol147:978–984
Vanderauwera S, Zimmermann P, Rombauts S, Vandenabeele S, Langebartels C, Gruissem W, Inzé D, Van Breusegem F(2005) Genome-wide analysis of hydrogen peroxide-regulated gene expression in Arabidopsis reveals a high light-induced transcriptional cluster involved in anthocyanin biosynthesis. Plant Physiol139:806–821
Viechtbauer W(2010) Conducting meta-analyses in R with the metafor package. J Stat Softw36:1–48
Xu E, Vaahtera L, Brosché M(2015a) Roles of defense hormones in the regulation of ozone-induced changes in gene expression and cell death. Mol Plant8:1776–1794
Xu E, Vaahtera L, Hõrak H, Hincha DK, Heyer AG, Brosché M(2015b) Quantitative trait loci mapping and transcriptome analysis reveal can-didate genes regulating the response to ozone inArabidopsis thaliana. Plant Cell Environ38:1418–1433
Yi X, Du Z, Su Z(2013) PlantGSEA: a gene set enrichment analysis toolkit for plant community. Nucleic Acids Res41:98–103