Report No. KS-16-02 ▪FINAL REPORT▪ May 2016
Evaluation of Temporary Traffic
Signals in Conjunction with Pilot
Car Operations at Two-Way Long
Temporary Work Zones
Steven D. Schrock, Ph.D., P.E., F.ITE Shivraj S. Patil
Eric J. Fitzsimmons, Ph.D. Vishal R. Sarikonda
1 Report No.
KS-16-02 2 Government Accession No. 3 Recipient Catalog No. 4 Title and Subtitle
Evaluation of Temporary Traffic Signals in Conjunction with Pilot Car Operations at Two-Way Long Temporary Work Zones
5 Report Date May 2016
6 Performing Organization Code 7 Author(s)
Steven D. Schrock, Ph.D., P.E., F.ITE, Shivraj S. Patil, Eric J. Fitzsimmons, Ph.D., Vishal R. Sarikonda
7 Performing Organization Report No.
9 Performing Organization Name and Address The University of Kansas
Department of Civil, Environmental and Architectural Engineering 1530 West 15th St
Lawrence, Kansas 66045-7609
10 Work Unit No. (TRAIS) 11 Contract or Grant No.
C1979 12 Sponsoring Agency Name and Address
Kansas Department of Transportation Bureau of Research
2300 SW Van Buren Topeka, Kansas 66611-1195
13 Type of Report and Period Covered
Final Report
October 2013–December 2015 14 Sponsoring Agency Code
RE-0646-01 15 Supplementary Notes
For more information write to address in block 9.
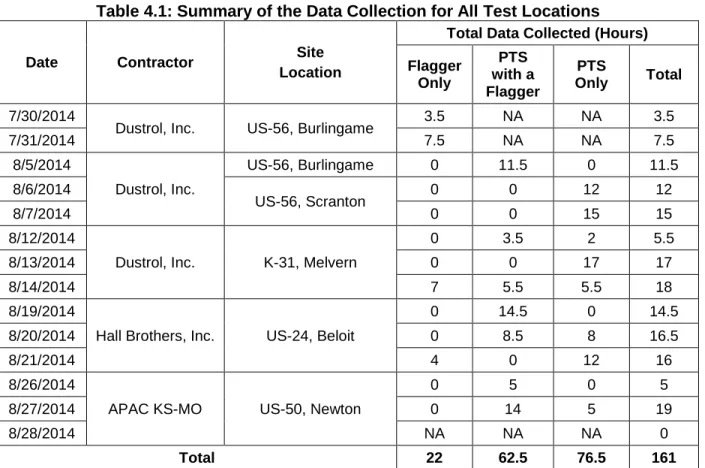
The primary objective of this study was to evaluate the use of Portable Traffic Signal (PTS) systems at long, rural two-lane work zones and to compare three different conditions for controlling one-lane traffic in conjunction with pilot car operations: flagging only, a PTS system with the presence of a flagger, and a PTS system without the presence of a flagger. The primary measures of effectiveness were determined as Red Light Running (RLR) violation percentages, vehicle delay estimates, queue lengths, signal timing operations, and general field operations. Data were collected three days per week over a period of four weeks from August 5, 2014, to August 28, 2014, at four different temporary work zones in Kansas. Two PTS units were used for the purpose of the study in conjunction with pilot car operations.
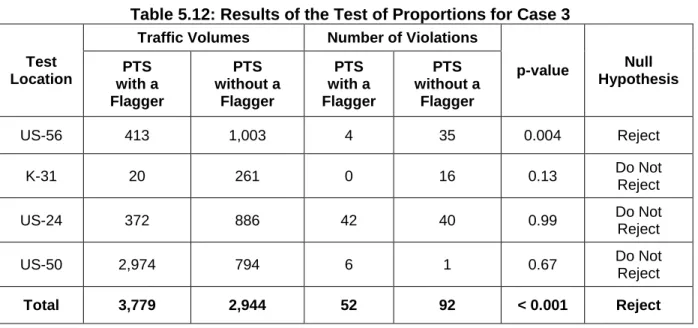
It was found that the percentage of violations for the flagger only, PTS with a flagger, and PTS without a flagger were 1.1, 1.3, and 3.1 percent, respectively. A test of proportions conducted on the three samples at a 0.05 level of significance indicated that there was a statistically significant difference in the number of violations when a PTS was used with a flagger and without a flagger, as compared to when flagging only operations were used. Similarly, there was a statistically significant difference in the number of violations when a PTS was used with a flagger and when a PTS was used without a flagger. It was also found that there was no statistically significant difference between the number of RLR vehicles that followed an already departed queue for the PTS with a flagger and PTS without a flagger conditions. It was found that there was a statistically significant difference in the number of RLR vehicles that left the stopped queue and the number of vehicles that disregarded the PTS control for both the conditions.
An exploratory delay analysis indicated that the presence of a flagger reduced the total delay by approximately 5 percent of the delay that could have occurred during the normal operations when flaggers waved the vehicles through the red light. Finally, equations were developed to determine the volume thresholds at which the PTS system would fail and the appropriate green intervals needed to serve a certain queue length. It was found that based on the existing KDOT policy of a maximum pilot car roundtrip time of 15 minutes, the PTS system would fail at an annual average daily traffic (AADT) of approximately 7,083 vehicles per day and at a corresponding maximum green time of approximately 446 seconds.
In conclusion, it was recommended to use a PTS unit without a flagger in conjunction with pilot car operations at long, rural two-lane work zones but other measures were suggested, such as engineering studies to more accurately estimate queue lengths, installation of static signs indicating the expected wait time, and regular inspections of the PTS units by site supervisors or crew members to mitigate excessive delays and monitor for RLR vehicles.
17 Key Words
Portable Traffic Signals, Pilot Car Operations, Work Zones 18 Distribution Statement No restrictions. This document is available to the public through the National Technical Information Service
www.ntis.gov. 19 Security Classification
(of this report) Unclassified
20 Security Classification (of this page)
Unclassified
21 No. of pages
Evaluation of Temporary Traffic Signals in
Conjunction with Pilot Car Operations at
Two-Way Long Temporary Work Zones
Final Report
Prepared by
Steven D. Schrock, Ph.D., P.E., F.ITE
Shivraj S. Patil
Eric J. Fitzsimmons, Ph.D.
Vishal R. Sarikonda
The University of KansasA Report on Research Sponsored by
THE KANSAS DEPARTMENT OF TRANSPORTATION TOPEKA, KANSAS
and
THE UNIVERSITY OF KANSAS LAWRENCE, KANSAS
May 2016
NOTICE
The authors and the state of Kansas do not endorse products or manufacturers. Trade and manufacturers names appear herein solely because they are considered essential to the object of this report.
This information is available in alternative accessible formats. To obtain an alternative format, contact the Office of Public Affairs, Kansas Department of Transportation, 700 SW Harrison, 2nd Floor – West Wing, Topeka, Kansas 66603-3745 or phone (785) 296-3585 (Voice) (TDD).
DISCLAIMER
The contents of this report reflect the views of the authors who are responsible for the facts and accuracy of the data presented herein. The contents do not necessarily reflect the views or the policies of the state of Kansas. This report does not constitute a standard, specification or regulation.
Abstract
The primary objective of this study was to evaluate the use of Portable Traffic Signal (PTS) systems at long, rural two-lane work zones and to compare three different conditions for controlling one-lane traffic in conjunction with pilot car operations: flagging only, a PTS system with the presence of a flagger, and a PTS system without the presence of a flagger. The primary measures of effectiveness were determined as Red Light Running (RLR) violation percentages, vehicle delay estimates, queue lengths, signal timing operations, and general field operations. Data were collected three days per week over a period of four weeks from August 5, 2014, to August 28, 2014, at four different temporary work zones in Kansas. Two PTS units were used for the purpose of the study in conjunction with pilot car operations.
It was found that the percentage of violations for the flagger only, PTS with a flagger, and PTS without a flagger were 1.1, 1.3, and 3.1 percent, respectively. A test of proportions conducted on the three samples at a 0.05 level of significance indicated that there was a statistically significant difference in the number of violations when a PTS was used with a flagger and without a flagger, as compared to when flagging only operations were used. Similarly, there was a statistically significant difference in the number of violations when a PTS was used with a flagger and when a PTS was used without a flagger. It was also found that there was no statistically significant difference between the number of RLR vehicles that followed an already departed queue for the PTS with a flagger and PTS without a flagger conditions. It was found that there was a statistically significant difference in the number of RLR vehicles that left the stopped queue and the number of vehicles that disregarded the PTS control for both the conditions.
An exploratory delay analysis indicated that the presence of a flagger reduced the total delay by approximately 5 percent of the delay that could have occurred during the normal operations when flaggers waved the vehicles through the red light. Finally, equations were developed to determine the volume thresholds at which the PTS system would fail and the appropriate green intervals needed to serve a certain queue length. It was found that based on the existing KDOT policy of a maximum pilot car roundtrip time of 15 minutes, the PTS system
would fail at an annual average daily traffic (AADT) of approximately 7,083 vehicles per day and at a corresponding maximum green time of approximately 446 seconds.
In conclusion, it was recommended to use a PTS unit without a flagger in conjunction with pilot car operations at long, rural two-lane work zones but other measures were suggested, such as engineering studies to more accurately estimate queue lengths, installation of static signs indicating the expected wait time, and regular inspections of the PTS units by site supervisors or crew members to mitigate excessive delays and monitor for RLR vehicles.
Acknowledgements
The University of Kansas research team would like to thank the Kansas Department of Transportation for funding the research project and providing technical assistance at all times during the course of the study.
The research team would like to thank Mr. Roger Alexander (John Thomas, Inc.) for providing the PTS systems and coordinating the various test locations for the research.
The team appreciates C-Hawkk’s cooperation in providing the research team with traffic signs and sand bags for the research.
The team would like to thank Twin Traffic Marketing Corp. for providing the research team with traffic drums and rubber bases for the research.
Finally, the team would like to thank Mr. Matthew Maksimowicz and Mr. David Woody of KU for their assistance.
The team also would like to thank all the students at the University of Kansas for assisting in the data collection for this research.
Table of Contents
Abstract ... v
Acknowledgements ... vii
Table of Contents ... viii
List of Tables ... x
List of Figures ... xiii
Chapter 1: Introduction ... 1 1.1 General Background ... 1 1.2 Research Gap... 1 1.3 Research Need ... 3 1.4 Research Objective ... 4 1.5 Report Organization ... 5
Chapter 2: Literature Review ... 6
2.1 Portable (or Temporary) Traffic Signals ... 6
2.2 Pilot Car and Flagger Operations ... 12
2.3 Temporary Traffic Control Devices ... 14
Chapter 3: Research Methodology... 16
3.1 Survey of Practice ... 16
3.2 Closed-Course Field Test ... 17
3.3 Site Selection and Data Collection ... 18
3.3.1 Equipment Used ... 19
3.3.2 Experimental Design and Data Collection Methodology ... 22
3.3.3 Work Zone Traffic Control Operations ... 24
3.4 Data Reduction and Data Analyses ... 26
Chapter 4: Field Data Collection ... 28
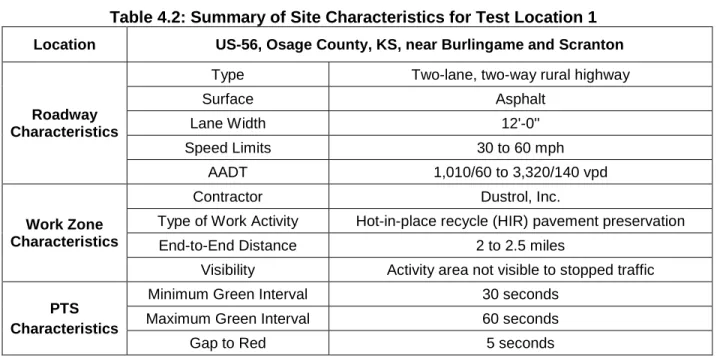
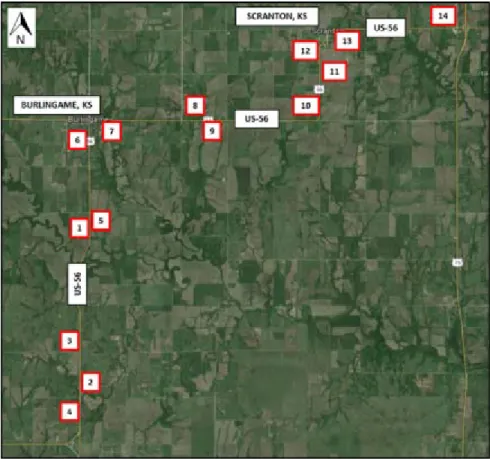
4.1 Test Location 1: US-56 Burlingame, KS ... 30
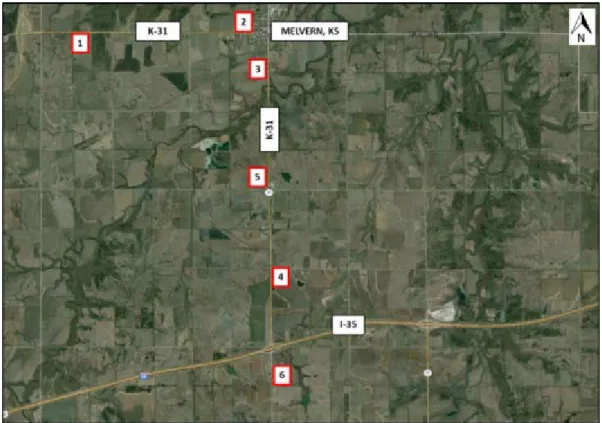
4.2 Test Location 2: K-31 near Melvern, KS ... 33
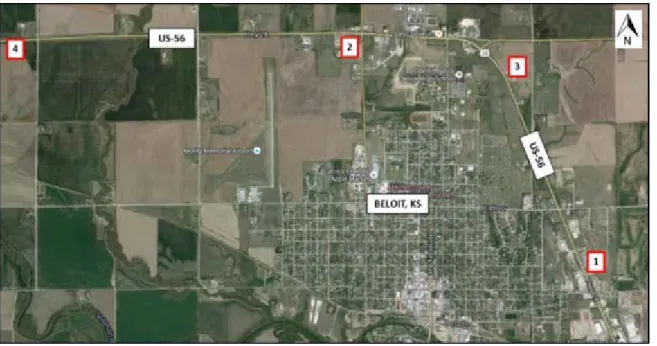
4.3 Test Location 3: US-24 Beloit, KS ... 35
4.4 Test Location 4: US-50 near Newton, KS ... 36
Chapter 5: Data Analysis ... 39
5.1 Data Reduction ... 39
5.2 Evaluation of the Operational Parameters ... 41
5.2.1 Average Vehicle Wait Time ... 41
5.2.2 Average Queue Length ... 42
5.3.1 Test of Proportions ... 52
5.3.2 Summary of Results... 57
5.4 Delay Analysis ... 59
5.4.1 Summary of Results... 65
5.5 Model Development for Volume Thresholds and Appropriate Green Interval ... 66
5.5.1 Saturation Headway and Start-Up Lost Time ... 66
5.5.2 Platoon Clearance Time ... 73
5.5.3 Development of the Model to Determine Appropriate Green Interval ... 75
5.5.4 Summary of Results... 83
Chapter 6: Research Findings ... 84
6.1 Summary of Findings ... 85
6.1.1 Safety and Visibility ... 85
6.1.2 Field Operations ... 85
6.1.3 Evaluation of Operational Parameters ... 86
6.1.4 RLR or Violation Analysis ... 86
6.1.5 Delay Analysis ... 88
6.1.6 Model for Volume Thresholds and Appropriate Green Interval ... 89
Chapter 7: Recommendations ... 91
7.1 Use of PTS Units in Conjunction with Pilot Car Operations ... 91
7.2 Measures to Adopt for Potential Problems Due to Signal Failure ... 95
7.3 PTS Limitations and Anomalies ... 95
Chapter 8: Future Research ... 98
References ... 100
Appendix A: Portable Traffic Signal (PTS) Specifications ... 103
Appendix B: Survey of Practice ... 110
Appendix C: Signal Timing Data ... 119
Appendix D: Data for Delay Analysis ... 121
Appendix E: Charts for Delay Analysis... 135
Appendix F: Temporary Traffic Control Plans ... 151
Appendix G: Charts for Maximum Feasible Green Interval (Gmax) and Maximum Feasible Length of Work Zone (Lw) ... 153
Appendix H: Additional Pictures ... 156
Appendix J: Additional Research Questions Regarding Project ... 157
List of Tables
Table 2.1: Summary of Portable Signal Costs and Benefits ... 8
Table 2.2: Summary of Comparison of Information Dissemination Systems Used ... 13
Table 3.1: Summary of Responses for the Survey of Practice ... 17
Table 4.1: Summary of the Data Collection for All Test Locations ... 30
Table 4.2: Summary of Site Characteristics for Test Location 1 ... 31
Table 4.3: Summary of Data Collection for Test Location 1 ... 32
Table 4.4: Summary of Site Characteristics for Test Location 2 ... 33
Table 4.5: Summary of Data Collection for Test Location 2 ... 34
Table 4.6: Summary of Site Characteristics at Test Location 3 ... 35
Table 4.7: Summary of Data Collection for Test Location 3 ... 36
Table 4.8: Summary of Site Characteristics for Test Location 4 ... 37
Table 4.9: Summary of Data Collection for Test Location 4 ... 38
Table 5.1: Summary of the Average Wait Time for All the Three Conditions ... 42
Table 5.2: Summary of the Average Queue Length for All the Three Conditions ... 43
Table 5.3: Summary of the Average Green Time for All the Three Conditions ... 44
Table 5.4: Summary of Violations for the Flagger Only Condition at All the Test Locations .... 48
Table 5.5: Number of RLR Violations for the PTS with a Flagger Condition ... 48
Table 5.6: Number of RLR Violations for the PTS with a Flagger Condition Excluding the Intersection at Beloit, KS ... 50
Table 5.7: Percentage of RLR Violations for the PTS with a Flagger Condition ... 50
Table 5.8: Number of RLR Violations for the PTS without a Flagger Condition ... 51
Table 5.9: Percentage of RLR Violations for the PTS without a Flagger Condition ... 51
Table 5.10: Results of the Test of Proportions for Case 1 ... 53
Table 5.11: Results of the Test of Proportions for Case 2 ... 54
Table 5.12: Results of the Test of Proportions for Case 3 ... 55
Table 5.13: Results of the Test of Proportions for the RLR Violations when Drivers Followed a Departed Queue ... 56
Table 5.14: Results of the Test of Proportions for the RLR Violations when Drivers Left the Stopped Queue ... 56
Table 5.15: Results of the Test of Proportions for the RLR Violations when Drivers Disregarded the Traffic Control ... 57
Table 5.16: Sample Arrival Times for the Actual and Hypothetical Scenarios ... 62
Table 5.17: Summary of the Delay Analysis ... 64
Table 5.18: Summary of the Total Delay Observed When a PTS was Used with a Flagger ... 65
Table 5.21: Maximum Feasible Length of Work Zone and Maximum Feasible Green Interval
Based on Current KDOT Policy ... 82
Table C.1: Signal Timing Information for Test Location 1 on US-56 near Burlingame, KS .... 119
Table C.2: Signal Timing Information for Test Location 2 on K-31 near Melvern, KS ... 119
Table C.3: Signal Timing Information for Test Location 3 on US-24 near Beloit, KS ... 120
Table C.4: Signal Timing Information for Test Location 4 on US-50 near Newton, KS ... 120
Table D.1: Data for Delay Analysis 1 ... 121
Table D.2: Data for Delay Analysis 2 ... 121
Table D.3: Data for Delay Analysis 3 ... 122
Table D.4: Data for Delay Analysis 4 ... 122
Table D.5: Data for Delay Analysis 5 ... 123
Table D.6: Data for Delay Analysis 6 ... 123
Table D.7: Data for Delay Analysis 7 ... 123
Table D.8: Data for Delay Analysis 8 ... 124
Table D.9: Data for Delay Analysis 9 ... 124
Table D.10: Data for Delay Analysis 10 ... 124
Table D.11: Data for Delay Analysis 11 ... 125
Table D.12: Data for Delay Analysis 12 ... 125
Table D.13: Data for Delay Analysis 13 ... 126
Table D.14: Data for Delay Analysis 14 ... 126
Table D.15: Data for Delay Analysis 15 ... 127
Table D.16: Data for Delay Analysis 16 ... 127
Table D.17: Data for Delay Analysis 17 ... 128
Table D.18: Data for Delay Analysis 18 ... 128
Table D.19: Data for Delay Analysis 19 ... 129
Table D.20: Data for Delay Analysis 20 ... 129
Table D.21: Data for Delay Analysis 21 ... 129
Table D.22: Data for Delay Analysis 22 ... 130
Table D.23: Data for Delay Analysis 23 ... 130
Table D.24: Data for Delay Analysis 24 ... 131
Table D.25: Data for Delay Analysis 25 ... 131
Table D.26: Data for Delay Analysis 26 ... 131
Table D.27: Data for Delay Analysis 27 ... 132
Table D.28: Data for Delay Analysis 28 ... 132
Table D.29: Data for Delay Analysis 29 ... 133
Table D.30: Data for Delay Analysis 30 ... 134
Table J.1: First Vehicle Arrival Data for PTS with Flagger Condition ... 159
Table J.3: RLR Data for PTS with Flagger Condition... 160
Table J.4: RLR Data for PTS Only Condition ... 160
Table J.5: Summary of First Vehicle Arrival Data as per the Set Gap Time for PTS with Flagger Condition ... 161
Table J.6: Summary of First Vehicle Arrival Data as per the Set Gap Time for PTS Only Condition... 161
Table J.7: Summary of RLR Data as per the Set Gap Time for PTS Only ... 164
Table J.8: Summary of RLR Data as per the Set Gap Time for PTS with Flagger ... 165
Table J.9: Number of Vehicles Not Served by the Maximum Green Interval ... 169
Table J.10: Entering and Exiting Times of the Platoons on August 5 ... 172
Table J.11: Paired t-test Results for Means of Entering and Exiting Times of the Platoons on August 5th ... 173
Table J.12: Average Number of Vehicles in a Queue and Their Time Taken for Entering and Exiting in Statistical Terms for Test Days ... 174
Table K.1: Entering and Exiting Times of the Platoons on August 6 ... 175
Table K.2: Paired t-test Results for Means of Entering and Exiting Times of the Platoons on August 6 ... 176
Table K.3: Entering and Exiting Times of the Platoons on August 7 ... 177
Table K.4: Paired t-test Results for Means of Entering and Exiting Times of the Platoons on August 7 ... 178
Table K.5: Entering and Exiting Times of the Platoons on August 12 ... 179
Table K.6: Paired t-test Results for Means of Entering and Exiting Times of the Platoons on August 12 ... 179
Table K.7: Entering and Exiting Times of the Platoons on August 13 ... 180
Table K.8: Paired t-test Results for Means of Entering and Exiting Times of the Platoons on August 13 ... 182
Table K.9: Entering and Exiting Times of the Platoons on August 14 ... 182
Table K.10: Paired t-test Results for Means of Entering and Exiting Times of the Platoons on August 14 ... 183
Table K.11: Entering and Exiting Times of the Platoons on August 19... 184
Table K.12: Paired t-test Results for Means of Entering and Exiting Times of the Platoons on August 19 ... 185
Table K.13: Entering and Exiting Times of the Platoons on August 20... 186
Table K.14: Paired t-test Results for Means of Entering and Exiting Times of the Platoons on August 20 ... 188
Table K.15: Entering and Exiting Times of the Platoons on August 21... 188
Table K.16: Paired t-test Results for Means of Entering and Exiting Times of the Platoons on August 21 ... 189
List of Figures
Figure 3.1: Closed-Course Field Testing of the Signal Units at the University of Kansas ... 18
Figure 3.2: Sony HDR CX-220 Camera Used for Video Data Collection ... 20
Figure 3.3 Traffic Signs Used ... 21
Figure 3.4: Designed Equipment Setup Plan ... 23
Figure 3.5: Standard Pilot Car with the Pilot Car Sign Installed ... 24
Figure 3.6: Galaxy Flagger Remote Control Device ... 25
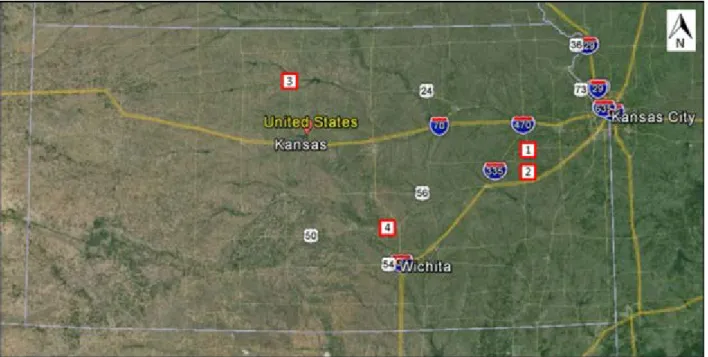
Figure 4.1: Map Showing the Four Test Locations for Field Data Collection ... 28
Figure 4.2: Three Study Conditions: (a) Flagger Only; (b) PTS with a Flagger; (c) PTS without a Flagger ... 29
Figure 4.3: Map Showing Work Zone Ends at Test Location 1 on US-56 ... 32
Figure 4.4: Map Showing Work Zone Ends at Test Location 2 on K-31 ... 34
Figure 4.5: Map Showing Work Zone Ends at Test Location 3 on US-24 ... 36
Figure 4.6: Map Showing Work Zone Ends at Test Location 4 on US-50 ... 37
Figure 5.1: Sample Data Reduction Sheet ... 40
Figure 5.2: Ground View of the Eastbound PTS Leg of the Intersection at Beloit, KS ... 59
Figure 5.3: Graph Illustrating a Sample Delay Analysis ... 63
Figure 5.4: Plot of the Vehicle Headway Data against Vehicle Position for All the 30 Queues .. 69
Figure 5.5: Plot for the Vehicle Headway Data against First 20 Vehicle Positions ... 70
Figure 5.6: Plot for the Headway Data against Vehicle Position Excluding the Trucks and Heavy Vehicles ... 73
Figure 5.7: General End-to-End Layout of the Work Zone at All Test Locations ... 75
Figure 5.8: Plot for the AADT against the Maximum Green Interval ... 79
Figure 5.9: Plot for Maximum Green Time against Number of Vehicles ... 80
Figure 5.10: Plot for Maximum Green Interval against Maximum Length of Work Zone ... 81
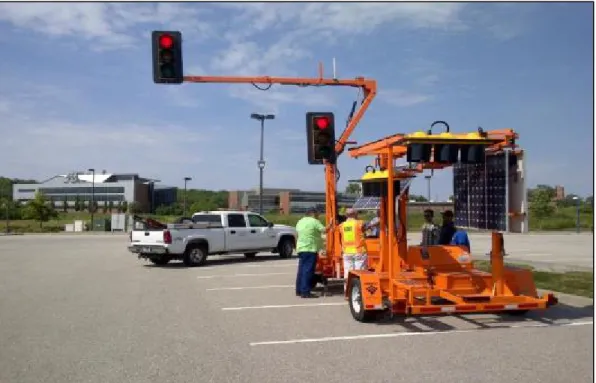
Figure A.1: Two PTS Units Used for the Study ... 103
Figure A.2: A Fully Raised PTS Unit ... 104
Figure A.3: PTS Signal Heads ... 105
Figure A.4: Batteries Provided (Source: Procurement Specifications PTS-2000) ... 106
Figure A.5: Tilt and Rotate System for the Solar Panels ... 107
Figure A.6: PTS Handheld Remote Control with External Plug-In Charger ... 108
Figure A.7: PTS Control Box ... 108
Figure E.1: Delay Analysis 1 ... 135
Figure E.2: Delay Analysis 2 ... 136
Figure E.3: Delay Analysis 3 ... 136
Figure E.4: Delay Analysis 4 ... 137
Figure E.5: Delay Analysis 5 ... 137
Figure E.7: Delay Analysis 7 ... 138
Figure E.8: Delay Analysis 8 ... 139
Figure E.9: Delay Analysis 9 ... 139
Figure E.10: Delay Analysis 10 ... 140
Figure E.11: Delay Analysis 11 ... 140
Figure E.12: Delay Analysis 12 ... 141
Figure E.13: Delay Analysis 13 ... 141
Figure E.14: Delay Analysis 14 ... 142
Figure E.15: Delay Analysis 15 ... 142
Figure E.16: Delay Analysis 16 ... 143
Figure E.17: Delay Analysis 17 ... 143
Figure E.18: Delay Analysis 18 ... 144
Figure E.19: Delay Analysis 19 ... 144
Figure E.20: Delay Analysis 20 ... 145
Figure E.21: Delay Analysis 21 ... 145
Figure E.22: Delay Analysis 22 ... 146
Figure E.23: Delay Analysis 23 ... 146
Figure E.24: Delay Analysis 24 ... 147
Figure E.25: Delay Analysis 25 ... 147
Figure E.26: Delay Analysis 26 ... 148
Figure E.27: Delay Analysis 27 ... 148
Figure E.28: Delay Analysis 28 ... 149
Figure E.29: Delay Analysis 29 ... 149
Figure E.30: Delay Analysis 30 ... 150
Figure F.1: Snapshot of the Temporary Traffic Control Plan used for Locating the Traffic Signs ... 151
Figure F.2: Snapshot of TE-710 used for Determining the Distance ‘A’ ... 152
Figure G.1: Plot for Gmax against Lw at Tr = 15 mins; Sp = 35 mph; Y = 4 sec. ... 153
Figure G.2: Plot for Gmax against Lw at Tr = 15 mins; Sp = 30 mph; Y = 4 sec. ... 154
Figure G.3: Comparison of the AADT against Gmax for Different Tr ... 154
Figure G.4: Comparison of Gmax against Lw for Different Sp ... 155
Figure H.1: Oversize Vehicle Following a Pilot Car ... 156
Figure J.1: 5-Second Gap Time with PTS and Flagger ... 162
Figure J.2: 12-Second Gap Time with PTS and Flagger ... 163
Figure J.3: 5-Second Gap Time with PTS Only ... 163
Figure J.4: 12-Second Gap Time with PTS Only ... 164
Figure J.5: 5-Second Gap Time RLR Data with PTS and Flagger ... 166
Chapter 1: Introduction
1.1 General Background
Lane closures at one-way, two-lane roadways require the use of a control method to regulate the safe and efficient movement of traffic at either ends of the work zone. Traditionally, flaggers at each end of the work zone are used to control the alternating traffic. A Portable Traffic Signal (PTS) system is a traffic control device designed to facilitate the movement of one-way traffic at temporary lane-closure type work zones. A PTS system consists of two portable trailers with traffic signals attached to a pole and mast arm. Communications between trailers are typically fiber optics, radio, or a synchronized timer. In work zones with pilot car operations, PTS systems can operate as an actuated traffic signal controlled by the pilot car operator which allows for higher directional flows to accommodate an increased travel time through the work zone. To minimize the risk of a flagger being struck by noncompliant traffic, PTS systems have become common among contractors at shorter work zones where the ends of the work zone are visible to stopped traffic.
The 2009 edition of the Manual on Uniform Traffic Control Devices (MUTCD) indicated that, if traffic on the one-lane roadway was not visible from one end to the other, then flagging procedures, a pilot car in conjunction with a flagger, or a traffic control signal should be used to control opposing traffic flows (FHWA, 2012). Similarly, the Kansas Department of Transportation (KDOT) Section 805, Work Zone Traffic Control and Safety, of the Special Provision to the Standard Specifications recommends that pilot car operations could be used to assist and lead traffic during one-way vehicular operations, at a distance greater than that which could be seen between flaggers (KDOT, 2007). Therefore, for maintenance activities such as asphalt overlay and shoulder repair, using a pilot car in conjunction with flagging operations on two-lane, two-way roadways with one lane closed for traffic was a widely accepted practice in the state of Kansas at the time of this research.
1.2 Research Gap
An initial review of the existing literature on PTS systems showed limited research on their use in general.
Carlson et al. (2015) evaluated pilot cars and portable traffic control signals with and without flaggers. They found that only 3 percent of the drivers did not comply with the signals and pilot vehicles for the studied conditions. The research team concluded that there was no significant or practical difference in the number of violations when a signal was used with and without a flagger and recommended to use the portable traffic signals without a flagger to control traffic at lane closures on two-lane, two-way roadways.
Finley, Songchitruksa, and Jenkins (2015) evaluated alternate methods for controlling traffic on one-lane, two-way highways in Ohio. It was found that the violation rate for the portable traffic signals was 47.1 violations per 100 stop cycles, which was significantly different than the violations for the flagger method. The researchers also found that 99 percent of the violations had occurred at the end of the green interval when the non-compliant vehicles were able to see the end of the departed queue at a short distance and followed it to enter the work zone. The researchers recommended using the portable traffic signals for work zones with durations of at least half a day and identified high volume roads with flat side slopes as suitable locations for using these systems.
Several studies have indicated the cost benefits of using PTS systems instead of flaggers for controlling traffic at lane-closure type work zones. A study conducted by Ullman and Levine (1987) found that significant labor savings could be achieved with minimal delay to drivers by the use of a temporary traffic signal system when tested at three Texas work zones. A follow up study by Daniels, Venglar, and Picha (2000) developed thresholds and limitations of temporary traffic signals at work zones based on three study sites in Texas. It was found that the cost of purchase could be recovered after 2 years of operation if the equipment was used 8 to 10 days per month and savings in subsequent years were estimated at $20,000 to $30,000 per year (for 1999-2000).
Although the literature reported herein provided some information regarding the use of PTS system and its applications, only a limited number were able to provide guidelines regarding the use of these devices with pilot car operations at long lane-closure type work zones, indicating that an important research gap exists.
1.3 Research Need
A report by the National Institute for Occupational Safety and Health (NIOSH) indicated that from 1992 to 1998, 27 flagger fatalities were recorded at highway or street construction work zones, which was found to be approximately 3.86 flagger fatalities per year (Pratt, Fosbroke, & Marsh, 2001). The Bureau of Labor Statistics (BLS) found for fatal occupational injuries at road construction sites from 2003 to 2010, 442 workers were killed at road construction sites after being struck by a vehicle or mobile work zone related equipment (BLS, 2013). Of the 442 cases, 92 cases stated that the workers were performing flagging or other traffic control duties and 32 were employed as flaggers. This indicated that whenever the flaggers were used in conjunction with pilot car operations, they were operating under the ever-increasing risk of being hit by an errant driver.
As stated previously, the 2009 MUTCD provided guidance regarding the use of pilot car operations in conjunction with flagger operations for controlling one-way traffic at two-lane, two-way work zones. However, there was minimal guidance provided to design engineers and contractors regarding the use of PTS systems in conjunction with pilot car operations and/or flagger operations. Although the 2009 MUTCD did not prohibit the use of a PTS system in conjunction with a pilot car, Paragraph 4 of Section 6C.13 of the 2009 MUTCD required the use of a flagger when using a pilot car to control traffic at one-lane, two-way work zones and was stated as, “A flagger shall be stationed on the approach to the activity area to control vehicular traffic until the pilot vehicle is available”(FHWA, 2012).
Furthermore, on August 31, 2010, the Federal Highway Administration (FHWA) provided their interpretation for the use of a flagger with a pilot car in the letter “Use of Pilot Car with Temporary Traffic Control Signals” and provided the following reasons for Paragraph 4, Section 6C.13 (FHWA, 2010):
• Since work zones adopting pilot car operations are long, presence of a flagger assures the road users of the presence of a work zone and that they will be eventually given the opportunity to travel through the lane-closure area.
• A several minute wait at the signal on red indication might result in the road users becoming impatient and proceeding into the work zone assuming that the signal unit had malfunctioned.
• A flagger would alert the work crew and the pilot car operator regarding a noncompliant vehicle that enters the work zone.
As flagging operations were labor intensive, expensive, and posed hazards for workers, it was important to evaluate new technologies and techniques that had the potential of providing efficient traffic operations and safety at one-lane, two-way work zones. Furthermore, there is minimal guidance within the 2009 MUTCD regarding the work zone traffic volume thresholds where a PTS system would fail and safety could be compromised. Other useful information was also unavailable to support proposed guidance in the 2009 MUTCD to the safe operation of a PTS system in a work zone, such as appropriate signal timings and length of work zone.
1.4 Research Objective
The primary objective of this research was to determine the effectiveness of the PTS systems at long work zones in conjunction with pilot car operations and the presence of a flagger. Three conditions were selected to determine whether these conditions were beneficial in improving the overall operations and safety at two-lane, two-way rural work zones. These were:
• Flagging only operations;
• A PTS system with a flagger present; and
• A PTS system without a flagger present.
Data were to be collected at two-lane, two-way work zones anticipating pilot car operations and flagger operations. All the collected data were to be analyzed using the primary measures of effectiveness, which were determined as:
• RLR or violation percentages;
• Vehicle delay estimates;
• Queue lengths;
The research was anticipated to be completed by conducting an operational evaluation, a statistical evaluation, and developing a model to provide guidelines for the use of PTS systems at long work zones in conjunction with pilot car operations. The operational evaluation was conducted by investigating and reporting on performance measures such as average vehicle wait times, queue lengths, and signal timing operations. The statistical evaluation was conducted by recording and analyzing the number of red light running vehicles and calculating the estimates of delay reduction. Finally, the research was completed with the development of a model and identification of the volume thresholds at which the PTS systems would fail with recommendations and safety could be compromised. The KDOT specifications for work zone traffic control and safety were used as guidance regarding issues such as maximum pilot car speed within the work zone and the maximum round trip time for the pilot car. That helped in conducting the data analysis to determine the volume thresholds for the failure of the PTS system and in the estimation of green intervals for corresponding number of vehicles. The “Signal/Pilot Car typical” and “Traffic Control Sign” (TE710) Standard used for this research were provided by KDOT and can be found in Appendix F.
1.5 Report Organization
This report is divided into eight chapters. Chapter 1 introduces a general background with the existing research gap and the research objective. Chapter 2 provides a detailed summary of the literature review relating to PTS systems. Chapter 3 provides a description of the general data collection methodology. Chapter 4 provides a detailed description of the test locations where data collection was conducted. Chapter 5 describes the data analyses as well as calculations for each of the analyses. Chapter 6 provides findings from the general field observations and from the results of the data analyses. Chapter 7 provides a detailed description of all the recommendations based on the findings and discusses the limitations of the PTS system and anomalies observed during the research. Finally, Chapter 8 discusses the scope for future research.
Chapter 2: Literature Review
The first step of this research was to conduct a review of the existing literature to determine the findings of previous related studies. Only the literature that was directly related to the research was included and is summarized in this chapter.
2.1 Portable (or Temporary) Traffic Signals
Carlson et al. (2015) evaluated pilot cars and portable traffic control signals with and without flaggers. Data were collected at eight test sites, two-lane two-way rural roads in the Brownwood District, Texas, in May and October 2013. The eight test locations represented varying annual average daily traffic (AADT) ranging from 470 to 2,800 vehicles per day (as of 2011) and with speed limits ranging from 55 to 75 mph. Also, the length of lane closures varied at every test location and ranged from 0.41 to 1.42 miles. The research team calculated the violation rates for the signals with and without a flagger conditions and found that only three percent of the drivers did not comply with the signals and pilot vehicles for both the studied conditions. They also found that there was no statistically significant or practical difference in the number of violations when a signal was used with and without a flagger, based on the results of a test of proportions conducted at a 0.05 level of significance. Therefore, it was recommended to use the portable traffic signals without a flagger to control traffic at lane closures on two-lane, two-way roadways. Finally, the research team also developed guidelines to assist pilot car drivers in the selection of appropriate green time based on a start-up lost time of 4 seconds and assumed each vehicle axle required 1 second of green time.
Finley et al. (2015) evaluated alternate methods for controlling traffic on one-lane, two-way hightwo-ways in Ohio. Data were collected at 15 lane-closure type work zones in District 11, Carrollton County, OH, for four conditions: flagger with a STOP/SLOW paddle, red/yellow automated flagger assistance device (AFAD) with a flagger at each end of the work zone, red/yellow AFAD with one flagger operating both the devices, and portable traffic signals at both ends of the work zone. The AADT ranged from 520 to 9,230 vehicles per day and the
portable traffic signals was 47.1 violations per 100 stop cycles. Based on the results of a test of proportions conducted at a 0.05 level of significance, it was found that the number of violations for the portable traffic signal method were significantly different than the violations for the flagger method. The researchers also found that 99 percent of the violations had occurred at the end of the green interval when the non-compliant vehicles were able to see the end of the departed queue at a short distance and followed it to enter the work zone. They also found that the average green interval when the portable traffic signals were used was 39 seconds, and found that in 36 percent of the cycles the vehicle queue did not clear completely. The researchers conducted a cost-benefit analysis and found that on a limited usage of the portable traffic signal systems, the cost of purchase could be recovered in about 9 years. It was concluded that if the green intervals were determined based on the approaching traffic volumes and work zone lengths, the use of portable traffic signal systems would not result in a significant increase in the driver delay as compared to the flagger method. Finally, the researchers recommended using the portable traffic signals for work zones with durations of at least half a day, and identified high volume roads with flat side slopes as suitable locations for using these systems.
Ullman and Levine (1987) conducted a study of a fixed-time portable signal system at three work zone lane closures on two-lane, two-way rural highways (without paved shoulders) in Texas. The three sites chosen represented traffic volumes varying from 600 to 10,000 ADT (as of 1985) and work zone lengths ranging from 0.11 to 0.49 miles. Data were collected for traffic volumes, driver noncompliance of the signal, and vehicle stopped delay. Data for delay and compliance were collected for approximately 4 hours during the day when work was being performed. The researchers found that flaggers had the ability to respond to random vehicle arrivals and gaps in the traffic stream and assign traffic movements through the work zone to minimize vehicle stops and delays. The researchers concluded that fixed-time signals did not respond to random vehicle arrivals, and the vehicle delay under signal control was a function of the signal timing parameters: cycle length and green phase time. At higher traffic volumes, fixed-time signals at a work zone lane closure were found to provide a level of service to drivers comparable to that provided by a flagger. The study also suggested that the potential for vehicle crashes within the work zone may be higher because of driver noncompliance with the PTS. The
researchers suggested that the signal validity could be improved by adding a STOP line 50 to 60 feet in advance of the signal and also installing a temporary STOP HERE ON RED sign next to the stop line, enhancing the need for stopping. Table 2.1 shows that the fixed-time portable signals provided significant cost savings over the use of flaggers.
Table 2.1: Summary of Portable Signal Costs and Benefits
Site Cost of Additional Motorist
Delay ($/hour)a
Savings in Labor Costs ($/hour)b
Savings Achieved by Portable Signals ($/hour)
1 3.12 12 8.88
3 4.16 18 13.84
Source: Finley et al. (2015)
Note: Data for Site 2 was not used in the analysis because the delay estimates could not be estimated for flagger control.
a
Based on 1986 estimates of value of travel time = $10.40 per vehicle-hour.
b
Based on typical wages and benefits of approximately $6 per hour for Maintenance Technician I working for the Texas State Department of Highways and Public Transportation.
As shown in Table 2.1, the costs of additional vehicle delay were based on the estimates of value of travel time by Chui and McFarland (1986) which were available at the time of their research. Based on an approximate cost of $8,000 (as of 1987) per signal, the researchers estimated that the cost of purchase of the signals would be recovered after approximately 1,600 hours of service. Therefore, it was found that substantial savings in flagger labor costs could be achieved by using a portable fixed-time traffic signal system with savings ranging from $9 to $14 per hour. These savings in labor costs were calculated based on the wages and benefits of approximately $6 per hour for a Maintenance Technician I working for the Texas State Department of Highways and Public Transportation in 1987.
Daniels et al. (2000) studied the use of PTS technology to replace flaggers as a means for improving the efficiency of two-lane rural maintenance operations in Texas. The study examined critical issues such as determining the applicability of PTS in work zones, collecting data that would assist in assessing the cost effectiveness, driver comprehension of PTS in rural work zones, identifying unique characteristics related to maintenance operations, and recommending
total of 20 days over a 3-month period from June 1998 to August 1998 at three test locations (two hilly and one curving road) in the San Antonio District of the Texas Department of Transportation (TxDOT). The test sites had similarities in sight distance from beginning to end of each work zone, type of maintenance activities, absence of significant driveways, and absence of significant intersections within the work zone. The complete setup for the signals included a STOP HERE ON RED sign and took approximately 38 to 43 minutes to be fully setup. During this study, many maintenance sections were functioning with inadequate staff, therefore the researchers assumed that only one flagger position could be eliminated and calculated the potential savings anticipated by the use of this technology. It was found that the cost of purchase could be recovered after 2 years of operation if the equipment was used 8 to 10 days per month and savings in subsequent years were estimated at $20,000 to $30,000 per year (for 1999-2000). From their field test cases, the researchers found that PTS systems were technically feasible in improving the crew efficiency and flexibility on two-lane rural work zones for maintenance operations. TxDOT guidelines in 1996 recommended the use of PTS units for long-term stationary work zones of length up to 400 feet. The researchers recommended that a PTS system could be used at short-term stationary work zones of lengths up to 2,600 feet where the ends of the work zone were not visible to each other. They also suggested that the maximum time before driver confusion and a possible violation was 4 minutes. Therefore, the threshold for maximum wait time was recommended at 4 minutes and corresponding values were developed for the yellow clearance time, the red clearance time, and the maximum green time. Finally, the researchers also recommended values for minimum green time and the extension interval to be 7 to 10 seconds and 3 seconds, respectively.
Stout (2013) presented the different applications of PTS systems in short-term work zones and indicated that using these systems could replace flaggers, making them available for other work activities. The main advantages for using the signal systems were found to be the speed, portability, and ease of installation.
A report by the Roadway Safety Consortium (n.d.) listed the different strategies for improving the safety of workers in work zones by suggesting measures for improving flagger visibility and minimizing the risks of flaggers being hit by errant vehicles. The report
recommended the use of PTS systems at one-way work zones which were expected to last for several days and at one-lane work zones to remove flaggers from being directly exposed to approaching traffic It was indicated that appropriate signal timings were vital when implementing temporary traffic signals, as extensive wait times could lead to confusion, driver impatience, and decreased compliance. It was recommended to use pilot car operations for alternating one-way work zones where the travel paths were not clear and where travel speeds adjacent to the activity area were to be kept low.
In 2013, the Oregon Department of Transportation (ODOT) Safety Audit identified the strengths and weaknesses within ODOT’s Traffic Control Plan (TCP) standards, practices, and their implementation (ODOT, 2013). After reviewing 29 highway work zones, the report identified the temporary/portable traffic signals and pilot car operations as successful methods to alternate traffic at one-lane, two-way work zones. The report also indicated that pilot car operations were effective in maintaining safe operating speeds and minimal traffic delays at work zones with lower traffic volumes (<2,000 ADT) and limited side roads. Similarly, it was also found that pilot car operations were not as successful in minimizing traffic delays for work zones with higher traffic volumes (>3,500 ADT), several driveways, and an end-to-end distance of 1 to 2 miles.
A traffic advisory leaflet detailed practices in England, UK, for the use of PTS systems at road and street works (Department for Transport, 2011). PTS systems were primarily used for alternating traffic in work zones where one lane of a two-lane facility was closed. The maximum recommended length for the work zones to deploy a PTS system was 300 meters (1,000 feet) due to long all-red times that result in longer queues. It was recommended to control the side roads that were present within the work zone if there was poor visibility of the traffic control on the main road. It was also recommended to use the PTS in vehicle-actuated mode to reduce unwanted delays. If a PTS system was going to be operated manually, it was recommended that both ends of the working area be clearly visible to the operator. Proper training was also necessary for personnel setting up the PTS units, since poor setups could increase the risk of crashes, additional costs in fuel and time, increased pollution, and driver frustration.
Lee, Park, Kim and Lee (2012) studied the effectiveness of a vehicle-actuated signal control system on work zone operations for two-lane highways in Korea. The researchers investigated the dependence of average control delay and number of conflicts on signal control methods for a two-lane highway, taking into account work zone length and traffic volume changes. Pre-timed signal control or time of day (TOD), actuated signal control with fixed all-red (AFAR), and actuated signal control with dynamic all-red (ADAR) were the three signal control methods that were investigated. The average control delay per vehicle was used to evaluate the effectiveness of each control method while the length of the work zone and the traffic volume were used to evaluate safety. In the study, VISSIM was used to analyze signal control methods, VisVAP of VISSIM for algorithm embodiment, SYNCHRO 4.0 for TOD signal optimization, and finally surrogate safety assessment model (SSAM) to analyze traffic safety. In terms of safety and mobility for short work zones on two-lane highways, the researchers found ADAR to be the most efficient signal control method under most conditions examined, except under certain traffic volumes in a 400 meter (1,200 ft) long work zone. In work zones with lengths of 200 meters (600 ft), the ADAR control method decreased the average control delay per vehicle by a minimum of 16 seconds or more as compared to the other two methods. For work zones with lengths of 400 meters (1,200 ft), the ADAR control method could be operated safely and had less deviation, even though vehicle delays were widely distributed from 100 to 712 seconds for all control methods. The signal timings for the ADAR control method (green time and all-red time), were shorter than those for the other control methods in the work zones with lengths of 200 meters (600 ft) and 400 meters (1,200 ft). The results of conflict analysis showed that ADAR had no crossing conflicts and fewer conflicts than other signal control methods, especially for 200 meter (600 ft) long work zones where ADAR had no conflicts. Since the average control delay exceeded 100 seconds for work zones with lengths of 400 meters (1,200 ft), the researcher recommended the construction of a temporary bypass if the traffic volumes exceeded 500 vehicles per hour on two-lane, two-way work zones with lengths greater than 400 meters (1,200 ft) to reduce delays and increase traffic safety.
2.2 Pilot Car and Flagger Operations
Rys, Jacob, Clark, Gutierrez, and Kovala (2012), in Phase I of their study, examined the most effective method of informing drivers about delay time when approaching a pilot car operation at a two-lane rural highway work zone. Six notification systems were identified during the preliminary research to provide information to the drivers: highway advisory radio (HAR) with static sign notification, a static sign displaying maximum wait time, a countdown timer displayed on the flagger’s stop paddle, a portable variable message sign (VMS), a countdown timer displayed on the approach sign, and a portable message sign with countdown timer. Table 2.2 provides the summary of the feasibility of these different notification systems based on various evaluation criteria (Rys & Jacob, 2009).
As shown in Table 2.2, all the systems were rated on the basis of the criteria: cost, effectiveness, integration, and deployment. For cost, integration, and deployment, the rating of high to low was defined as high=0 and low=1, and for effectiveness high to low was defined as high=1 and low=0. Therefore, in terms of cost, integration, and deployment, it was found that portable message signs with a countdown timer were the best alternative. Also, this system was found to be the most effective alternative since it was able to provide real-time information to drivers. After evaluating the systems based on the criteria mentioned earlier, the idea of portable message signs with a countdown timer was chosen for further research. Field testing of the equipment was conducted on a rural highway work zone 4 to 5 miles in length, with only one sign positioned on the right side of the shoulder near the flagger on September 30, 2004, on US-24 near Riley, Kansas, and October 7, 2004, on US-77 in Riley County, Kansas. The test was run for 3 hours and 112 public survey questionnaires were distributed. The system could not be tested for long periods due to the nature of the work zones and also the test of the autonomous functioning of the system was not performed.
Phase II of the study involved development of a fully workable and deployable prototype based on the concepts and field observations of the system demonstrated in Phase I (Hobson, 2012). An algorithm to estimate the wait time, instead of using real-time communication, was used to resolve the communication issues related to gaps in coverage. The “mini-trailer” design
KS, on October 29, 2008, and a survey was conducted by questioning 30 drivers waiting in the queue. The algorithm kept the displayed wait time within 1 minute of the arrival of the pilot car. The survey results showed that 100 percent of drivers could understand the sign, and 73 percent felt that the sign was helpful.
Table 2.2: Summary of Comparison of Information Dissemination Systems Used
System Costa Effectivenessb Integrationa Deploymenta
HAR High Low High High
Static Sign with Maximum Wait
Time Low Low Low Low
Countdown Timer on Flagger
STOP/SLOW Paddle Low Low Low Low
VMS High High High High
Countdown Timer on Approach
Sign Low Low Low Low
Portable Message Sign with
Countdown Timer Low High Low Low
Source: Rys et al. (2012)
a
For cost, integration, and deployment: high to low (high = 0 and low = 1)
b
For effectiveness: low to high (high = 1 and low = 0)
The 2008 KDOT Flagger Handbook presented operations and guidance for personnel who would be used as flaggers in work zones (KDOT, 2008). Flaggers help guide traffic, slow traffic, and/or stop traffic to allow safe operations in work zones. Safety was given a prime consideration, since flaggers had the highest amount of exposure to fast moving traffic. They also served as safety lookouts for other personnel on the work site by alerting them to potential threats and dangerous situations. Uniformity in operations was considered to be the key in increasing driver safety and compliance. When pilot cars were to be used, flaggers held the traffic until the pilot car was present to guide the traffic through the work zone. The manual also stated that late vehicles should not be allowed to catch up to the platoon after it had embarked.
2.3 Temporary Traffic Control Devices
Carlson, Fontaine, and Hawkins (2000) evaluated the various traffic control devices, treatments, and practices for rural high-speed maintenance work zones. Nine work zones, in which four were two-lane highways with flagger operations, were studied at three locations in the Childress District in Texas. Data were collected using two LIDAR, two pairs of piezoelectric sensors with appropriate traffic counter classifiers, and one mobile recording video system with a high-mast camera support in May, June, and August 1999. Speeds, conflicts, driver surveys, maintenance crew surveys, and recorded CB Radio conversations were used to evaluate the devices. The devices evaluated in the flagger-controlled work zones were fluorescent orange signings, drone radar, fluorescent yellow-green vests and hard hat covers, handheld strobe lights attached to flagger vests, visibility improvement attachments and cones, and high visibility retroreflective magnetic strips on flagger vehicles. The speed data were analyzed at a 0.05 level of significance and preliminary analysis indicated that fluorescent orange signing, fluorescent yellow vests, drone radar, and speed display trailers were the most promising devices. Further analyses showed that the drone radar was identified by drivers as a factor influencing them to slow down in flagger operated work zones.
Fontaine, Carlson, and Hawkins (2000) evaluated the use of seven devices at six short-term two-lane work sites in the Childress District, TX: portable rumble strips, drone radar, fluorescent yellow worker vests, retroreflective vehicle visibility improvements, fluorescent orange signs, and speed display trailers. Speed data were collected by the LIDAR guns for the free flow speeds throughout the work zones, and traffic counters with piezoelectric sensors were used to collect speed and vehicle class data for all vehicles in the traffic stream in May and June 2000. The vehicle speeds in the work zones, the ease of installation and removal, the impact of the device on vehicle conflicts, and worker comments on the effectiveness of these devices were assessed. Analysis of the data collected revealed that the speed display trailer had the largest impact on reducing passenger car speeds by 7 to 9 mph and 2 to 3 mph at Sites 1 and 2, respectively. Also, the speed display trailer reduced the truck speeds by 2 to 3 mph at both the test sites. The portable rumble strips were found to have no effect on passenger cars, but reduced
All the literature reported herein was useful in development of the research methodology presented in Chapter 3, provided some guidelines during the data reduction and analyses, and finally, also supported some of the recommendations discussed in Chapter 7.
Chapter 3: Research Methodology
This chapter is divided into four parts and details the research methodology and tasks in the order that they were conducted as part of this study. After conducting a detailed review of previous literature, the following tasks were conducted and described in this chapter: the survey of practice, the closed-course field testing, the site selection and data collection methodology, the work zone traffic control operations, and an overview of the data reduction and data analyses.
3.1 Survey of Practice
To understand the commonality of portable traffic signals in work zones in combination with pilot car operations, and if any specifications were used by a state highway agency, a survey of state highway agencies was conducted between May and June 2014. Out of all of the possible state highway agencies, the research team received information back from 19, based on telephone or email communications with work zone engineers within each state highway agency. A summary of the survey is shown in Table 3.1.
As shown in Table 3.1, it was found that 18 of the 19 states that responded to the survey used PTS system in work zones. It was also found that 12 state highway agencies used the MUTCD as the primary reference, while six state Departments of Transportation (DOTs) developed additional guidelines as reference for the use of PTS systems, pilot car operations, and flagger operations. Finally, it was also found that two state highway agencies used a PTS system in conjunction with pilot car operations and three state highway agencies used a PTS system in conjunction with flagger operations. Based on the survey, the research team found that although PTS systems are common in the state highway agencies surveyed, additional guidance is still needed to fully understand their use and acceptance as a work zone traffic control device. Appendix B provides a detailed description of the responses for all the 19 state DOTs that were surveyed.
Table 3.1: Summary of Responses for the Survey of Practice
State DOT Pilot Car Operation Portable Traffic Signal PTS with Pilot Car PTS with Flagger Operation Maximum Length of Work Zone for PTS (miles) MUTCD Own Standards
Arkansas Yes Yes No No 0.2 Yes -
Connecticut No Yes No Yes NS Yes -
Florida Yes Yes No No NS Yes -
Idaho Yes Yes No No 5 - Yes
Illinois No Yes No No 1.5 - Yes
Indiana Yes No NA NA NA - -
Iowa Yes Yes No No 2.5 - Yes
Kentucky No Yes No No 0.03 Yes Yes
Maryland No Yes NA NS 0.4 - Yes
Michigan Yes Yes No No 2 Yes -
Minnesota Yes Yes No Yes NS Yes Yes
Montana Yes Yes No Yes 2 Yes -
Nebraska Yes Yes No No 0.2 Yes -
Nevada Yes Yes No NS 5 Yes -
Ohio No Yes NA No NS - Yes
Oklahoma Yes Yes No No NS Yes -
Tennessee No Yes No NS 1.5 Yes -
Texas Yes Yes Yes No NS - Yes
Wyoming Yes Yes Yes No NS Yes -
Note: “NA” Not applicable because the PTS or pilot car operations were not used, “NS” No maximum length of work zone was specified during the survey, “-” Did not use the corresponding guidelines.
3.2 Closed-Course Field Test
A closed-course testing was performed on August 4, 2014, in the East Lot of the Park and Ride facilities at the University of Kansas. Figure 3.1 shows a photo from the closed-course testing.
Figure 3.1: Closed-Course Field Testing of the Signal Units at the University of Kansas
As shown in Figure 3.1, the functioning of the several components and the features of the ADDCO PTS-2000 unit with the Galaxy operating system were demonstrated by representatives from John Thomas, Inc. (Mr. Doug Niemerg and Mr. Roger Alexander). At the time, instructions were provided for operating the main control box on the PTS unit to lower and raise the mast arm and solar panels, operate the handheld Galaxy Flagger Remote (GFR), and alter the signal timings. Mr. Garry Olson (KDOT) was also present at the time of this closed-course testing.
3.3 Site Selection and Data Collection
The next step in the research was to select suitable test locations where data were to be collected. For selecting the test locations, specific characteristics of the work zone included the following:
• The work zone must be considered a long work zone. This meant that pilot car operations were required to escort a queue of vehicles through the work zone.
• The work zone must be a two-lane state highway and have a project where one-lane, two-way traffic operations were required.
Based on these guidelines, four locations were identified by working with KDOT and selected for the data collection. The following were the four test locations that were selected for this research:
1. US-56 near Burlingame, KS 2. K-31 near Melvern, KS 3. US-24 near Beloit, KS 4. US-50 near Newton, KS
Data were collected at these four test locations 3 days per week for a period of 4 weeks in August 2014. A detailed description of all the test locations and data collection is provided in Chapter 5.
3.3.1 Equipment Used
A list of equipment required for the data collection was prepared prior to conducting any field data collection. The following section details a general description of the equipment that was used for the research.
3.3.1.1 Safety
Safety of all the research team members was of paramount importance. All the team members participating in the data collection activity were required to wear hard hats and retroreflective vests for the entire duration of the data collection.
3.3.1.2 PTS Units
John Thomas, Inc., provided two ADDCO Solar PTS units with the Galaxy operating system for the research. A summary of important technical specifications of the PTS unit can be found in Appendix A. Two pickup trucks (Ford F-150) were used to transport the PTS units and the other data collection equipment to every test location.
3.3.1.3 Video Data Collection
Commonly available equipment was used for the video data collection. The high definition video cameras used for data collection had a battery life of 1 to 2 hours, thus needing
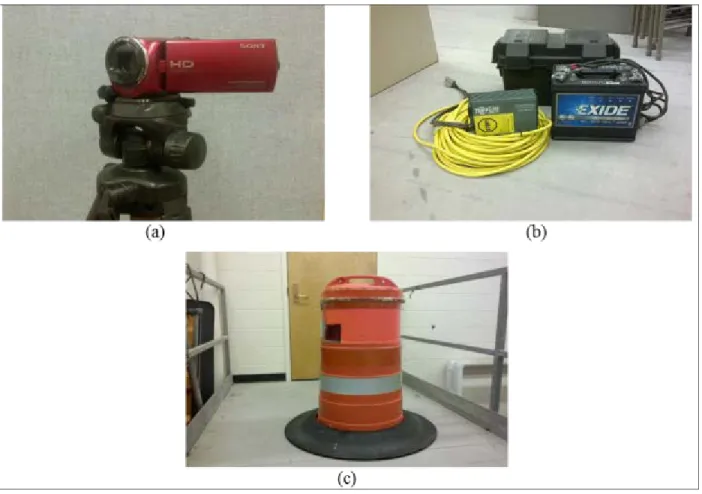
an extended battery pack to extend the record time of each camera. Also, a custom built camera drum was used to place the video cameras at the time of data collection. Figure 3.2 shows the video camera used for the research.
Figure 3.2: Sony HDR CX-220 Camera Used for Video Data Collection
As shown in Figure 3.2(a), four Sony Handycam HDR-CX 220 cameras were used for collecting video data, two at each end of the work zone. One camera was deployed for collecting the signal data, such as start of green interval, end of green interval, red light running vehicles, and pilot car operations for every cycle. The second camera was deployed to record the arrival time of the first vehicle in each queue, length of the queue, and vehicles turning around due to the wait time. Figure 3.2(b) shows the battery and the inverters used for the research.
black plastic box to protect them from rain, wind, and for the ease of transportation. A 100-foot-long wire was used to connect the inverter to the camera plug-in to allow the batteries to be placed well outside the roadside clear zone during the data collection. Figure 3.2(c) shows the custom built drum used to place the video cameras for the research.
As shown in Figure 3.2(c), three standard traffic drums were borrowed from Twin Traffic Marketing Corp. for placing the video cameras during the data collection. A semicircular portion from the face of the drum was replaced with clear plastic for providing visibility to the cameras. A majority of the portion of the plastic glass was taped off with basic orange tape similar to the color of the drum to diminish the visibility of the video cameras to the drivers. It was assumed that the reduced visibility of the cameras would result in unaltered driver behavior. Each drum was designed to support two video cameras on a wire mesh that was fixed inside the drum.
3.3.1.4 Traffic Signs
The four traffic signs used for the purpose of the research were: SIGNAL AHEAD [W3-3], STOP HERE ON RED [R10-6], FLAGGER AHEAD [W20-7A], and WAIT FOR PILOT CAR [KG20-5]. Figure 3.3 shows the SIGNAL AHEAD sign used for the research.
Figure 3.3 Traffic Signs Used
As shown in Figure 3.3, the SIGNAL AHEAD signs were borrowed from C-Hawkk’s construction office in Eudora, KS. The location of the signage was determined based on the
temporary traffic control plans provided by KDOT. At every test location, the contractor was responsible for all the other signage that was to be provided in the work zone as per the traffic control plan. Figure 3.3 shows the STOP HERE ON RED sign, FLAGGER AHEAD sign, and WAIT FOR PILOT CAR sign used for the research.
As shown in Figure 3.3, the STOP HERE ON RED signs were borrowed from C-Hawkk’s construction office in Eudora, KS, and the WAIT FOR PILOT CAR signs and the FLAGGER AHEAD signs were borrowed from the contractor at every test location as needed. Similar to the other signs, the location of these signs was determined based on the temporary traffic control provided by KDOT.
3.3.2 Experimental Design and Data Collection Methodology
A general data collection and equipment setup methodology was established prior to the field data collection. Figure 3.4 shows the equipment setup plan that was designed to indicate the location of the PTS unit, video cameras, and the traffic signs during the field data collection.
As shown in Figure 3.4, the STOP HERE ON RED and WAIT FOR PILOT CAR signs were located at the same spot at the test location. Their distance from the PTS unit was approximately 40 to 180 feet and varied depending on the road geometry at each work zone end. The distance of the SIGNAL AHEAD sign from the PTS unit was approximately 500 to 700 feet and varied with the speed of the road. The other work zone signage installed by the contractor was kept unaltered. Also, in the absence of a paved or unpaved shoulder and the presence of a steep foreslope, the test equipment was setup close to the outside edge of the pavement. Data were required to be collected at all the work zone ends established by the contractor during the selected dates. The collected data were considered to be valid only if the section of the roadway on which the signal and/or flagger were located was the major approach and the rest of the road geometry at that work zone end did not alter the work zone traffic operations (discussed in Section 3.3.3). The following section describes the general procedure that was followed at every test location in regards to equipment setup and video data collection.
Figure 3.4: Designed Equipment Setup Plan
3.3.2.1 Equipment Setup and Video Data Collection
Two research teams were used with one team stationed at either end of the work zone. Each team was responsible for setting up the PTS unit, two video cameras inside the custom drum, one camera on tripod at the end of the work zone, an external battery with an inverter, and the traffic signs as per the plan shown in Figure 3.4. The additional signs were setup a short time after the other work zone signage was setup by the contractor. The team periodically checked the PTS units, video cameras, and the signs to ensure that the setup was unaltered and data were collected. To ensure that the driver behavior was not affected, the research team ensured that no contractor/official vehicle was parked next to the signal and/or the data collection setup.
Data collection started as soon as the data equipment was setup and continued until the end of the day’s activities. Periodically, time was recorded in all the video cameras using a cellphone or a watch by a team member for future reference during the data reduction process. A minimum of 8 hours of video data per day were set as the target for each team. This minimum duration excluded the time required for the setup of the equipment and the time lost when moving from one location to the other with the work zone. At the end of the day, collected data were immediately transferred to a hard drive to avoid loss of data. The rest of the equipment was then prepared for the following day.
3.3.3 Work Zone Traffic Control Operations
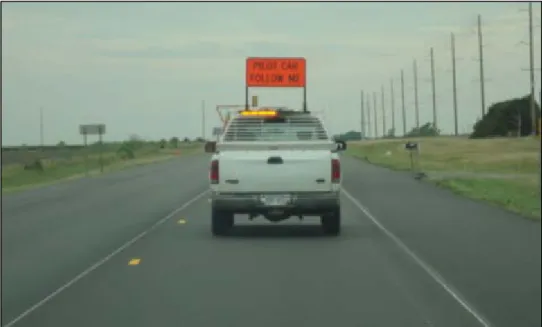
The contractor established the work zone for one-lane, two-way traffic at all test locations. At all the test locations, pilot car operations were used to escort the queue of stopped vehicles and guide them through the work zone at safe speeds. Figure 3.5 shows a standard contractor pilot that was used during this research with the PILOT CAR FOLLOW ME sign [G20-4].
When a portable traffic signal system was used with or without a flagger present, the pilot car drivers were solely responsible for operating the signal and activating the green phase prior to escorting the stopped queue. Figure 3.6 shows a photo of the GFR remote control device used for operating the signal unit in this research study. When activating the red and green phases on the signal unit, the pilot car drivers first selected the appropriate call button (for example, “Call 1”) on the GFR Remote control and then selected the “Red Rest/Pilot” button to activate the maximum green interval. In any circumstances if the pilot car drivers did not press the “Red Rest/Pilot” button, the signal activated only the minimum green interval even if the stopped queue was not completely cleared. The pilot car drivers were required to proceed into the work zone only when the signal green phase was active. They would repeat the steps for the activation of the green interval in events when the signal did not display a green indication.
Figure 3.6: Galaxy Flagger Remote Control Device
When the pilot car drivers approached the stopped queue of vehicles, they completed their U-turn by making a 90-degree turn using an available driveway or side road at the flagger/signal station to escort the vehicles into the work zone. For this study, the research team