February 2000
Competition, Growth, and Performance
in the Banking Industry
Bert Scholtens
apreliminary version, comments are welcome
-a
University of Groningen, Department of Finance, P.O. Box 800, 9700 AV Groningen, The Netherlands, phone +31–50 363 7064, fax +31–50 363 7207, email
L.J.R.Scholtens@ECO.RUG.NL, http://www.eco.rug.nl/medewerk/scholten
JEL: F30, G21, L23
Keywords: Bank Competition, Bank Performance, Bank Size, International Banking Abstract:
This paper analyzes competition, growth, and performance in the banking industry. First, we analyze the relationship between market structure and the performance of the banking industry. Furthermore, we test hypotheses on whether size matters for
individual banks' profit performance. As such, we use extreme bounds stability analysis and a stability analysis in line with Sala-i-Martin (1997) to test for the reliability of the regression outcomes. It turns out that bank profits are inversely related to the amount of bank assets and are positively associated with the amount of tier-one bank capital. Acknowledgements:
Daphne Hameeteman and Robert Lensink are gratefully acknowledged for their
COMPETITION, GROWTH, AND PERFORMANCE IN THE BANKING INDUSTRY
1. Introduction
There is a discussion in the economic literature about whether or not size matters for the performance of banks. From a theoretical perspective, this seems somewhat awkward. Gibrat’s law tells us that size does not matter (Gibrat, 1931), and we know that size is unimportant in the atomistic market structure of the Arrow-Debreu model.
However, in the real world, size is a hot issue. In this respect, a substantial amount of research has been directed towards the cost function of banks (see Berger et al. (1999) for an overview). In general, this research established that economies of scale may exist for banks up to the $10bn-$25bn size range. The evidence is at best very weak that cost complementarities exist, i.e. it appears that there are very limited economies of scale. But there turn out to be substantial X-inefficiencies in the banking industry; on average, banks have costs about 20% higher than those of a “best-practice” firm producing the same output. Analysis of the profit function of banks tends to reveal that with increases in bank size profit efficiency may improve (see Akhavein et al., 1997). This might result from improved risk diversification with increases in the scale of the banks' operations.
This paper tries to bring the ‘profit’ approach a step further. We first analyze how concentration in the banking industry is related to bank profitability in a number of industrialized countries. Then we analyze how bank size affects the profits of
internationally operating banks, as we assume that the globe rather than the nation state is the banks battlefield. We include various bank characteristics to determine profit growth. We use a sample of 100 international banks over the years 1987-1997. The main innovative feature of the paper is that it uses extreme bounds stability analysis (EBA) and a stability analysis in line with Sala-i-Martin (1997) in order to test for the reliability of the regression outcomes.
The structure of the paper is as follows. In section 2, we go into the market
to profitability. In this section, we take the banking sector within a country as our unit of analysis. In section 3, we take the individual bank as the object of our research. We will focus on how bank size and performance are related for 100 large international banks. As such, we provide regression results and stability tests. The conclusion is in section 4.
2. Competition and profitability
Figure 1
Average net income of banks in the G-7 countries, 1981-1997 (as a percentage of average balance sheet total)
Figure 1 shows the average net income of banks in the major industrial countries (Canada, France, Germany, Italy, Japan, the UK, and the US) during the years 1981-1997. Profit margins in the banking industry show a gradual decline since the late-1980s (for a discussion of the determinants of this trend, see Llewellyn, 1999). On average, net
0.90 1.00 1.10 1.20 1.30 1.40 1.50 1981 1983 1985 1987 1989 1991 1993 1995 1997
income was highest in the US, Italy and the UK, and lowest in Japan. In the period under consideration, it was most volatile in France and least in the UK.
In many countries, banks, in part as a response to the weakened performance, have sought for increases in the scale of their operations, sometimes on the basis of merger and acquisitions, sometimes on the basis of their own strengths. This has resulted in an overall increase in the concentration ratios in the banking industry in those
countries, hence competition might have weakened. Figure 2 shows the relative increase in the concentration ratio C-10, i.e. the share of the ten largest banks in the banking sector’s total assets, between 1980 and 1997. This C-10 rose substantially in the US. Here, the concentration ratio traditionally has been rather low and the C-10 is 26 percent in 1997. But also countries that already were highly concentrated in the early 1980s
witnessed a further rise in bank concentration, for example Sweden and the Netherlands.
Figure 2
Change in concentration ratios in 1980 and 1997
(percentage change in top-10 banks’ assets as a percentage of total banks’ assets)
-20
-10
0
10
20
30
40
50
60
70
80
90
100
Fear of monopolistic tendencies in the banking industry awakened in the mid-1990s when many large mergers took place. They frightened the public and cartel authorities as they might result in financial giants that could easily abuse their power. The basic idea behind this notion is that bigger banks are able to squeeze more profits from businesses, especially small and medium sized firms, and households. This would improve their profitability. To find out whether this notion basically is correct, we focus on the banking sectors’ profitability (return on assets, net interest margin) and banking sector structure (C-5 and C-10 concentration ratio). These four indicators cannot be simply related to each other because of dimensional problems, and we use rank correlation to find out about any association among them. Table 1 gives the Spearman rank correlations for bank profitability and bank concentration in fifteen countries.
Table 1
Spearmann rank correlation coefficients
Rank C-5 Rank C-10 Rank ROA Rank NIM
Rank C-5 1.0000
Rank C-10 0.9520 1.0000
Rank ROA 0.1058 0.1502 1.0000
Rank NIM -0.1680 -0.1271 0.8898 1.0000
Table 1 shows that there is a close association between the two market structure indicators and the two profitability indicators, as might have been expected. But somewhat surprising is that there is only a very weak association between bank profitability and concentration. The data reveal that there is a negative association between return on assets and bank concentration, indicating that less competition is accompanied by lower profitability. However, the coefficients are not significant. In all, table 1 does suggest that the basic notion that bank concentration results in monopoly profits for the banks can not be confirmed by the empirical evidence. This might result from the fact that we use aggregate data. In the next section, we will investigate
micro-economic behavior of a sample of international banks, as we assume that banks compete in the international arena.
3. Individual bank size and performance
3.1 General background
Alhadeff and Alhadeff (1964) compared the growth of the top 200 banks in the US over the period 1930-60 to the growth of total bank assets. They found that the top 200 grew more slowly than the total did. Within the top 200, the bottom segment grew more rapidly than the top, but showed greater variance in growth rates. Rhoades and Yeats (1974) replicated this study for the period 1960-71. They too found that the largest banks grew less than the system as a whole. This points to de-concentration in banking. Unlike these two studies, Tschoegl (1983) treated banking as a world industry and therefore analyzed the world’s 100 largest banks every second year from 1969 to 1977. The results of his study suggest that the variability of the growth rate of bank assets declines with the size of the accompanying bank. Tschoegl also found that the growth rate of each bank is independent of its size. Akhavein et al. (1997) report on a positive association between bank size and bank profitability in the US. In this paper, we use these
hypotheses as the basis for our own investigation, as we want to find out whether profit growth is related to bank size in the international environment. As such, we have two hypotheses:
H1: The profit growth of banks is inversely related to their size.
H2: The profit growth of banks is independent of their size.
Data
The population of banks to be investigated is drawn from the Banker’s list of the 1,000 largest banks in the world (1988-98 editions). This listing defines banks as deposit-taking institutions recognized by a central bank. It covers retail, wholesale, development, and savings banks. Some are state-owned, some co-operatives, but most are commercial banks, answerable to shareholders. The ranking in the list is based on the amount of
bank capital. We investigate the period 1987-97, every single year. From the 1997 list, we started at the top and searched down for those 100 banks that were not involved in mergers or major acquisitions from 1987 until 1997. This is because the M&A business in banking obscures the real performance of banks. In our opinion, it gives a very biased impression about the development of an individual bank: Growth may be simply the result of incorporating a different company. The pooling of the balance sheets of the two firms distorts the view on their actual performance. Therefore, merged firms have not been taken into account; testing our three hypotheses for merged banks warrants another dataset. We use 100 banks since this provides us with a population of the same size as Tschoegl’s (1983) study and since it is almost impossible to find more banks ranked in both the 1987 and the 1997 listings (and in the in-between years). The banks included in our analysis are listed in Appendix A. We are well aware of the fact that many banks in this group of 100 may have acquired other financial institutions during the period under review. This might slightly affect the results. However, in order to test the hypotheses mentioned above, we exclude the banks that have merged.
With respect to the bank's characteristics that might affect pre-tax profit growth (GPTP) with a bank, we investigate bank assets and bank capital. Tier One capital (TOC), as defined by the Bank for International Settlements, includes common stock, disclosed reserves, and retained earnings (Basle Committee on Banking Supervision, 1988). This item has become an important feature to assess bank's strengths. Second is total bank assets (TBA). This is the key item extensively researched in the papers that are at the basis of our hypotheses. We calculate growth rates of bank capital and assets (GTOC and GTBA respectively) as well as the volatility of these growth rates, as revealed by their standard deviation (VTOC and VTBA respectively) during 1987-97.
3.2 Regression results and stability analysis
where GPTP is the growth of bank profits; S is a vector of "commonly used" variables; M is a variable of particular interest; Zj is a vector of three variables taken from a pool of N available variables that might be potentially important explanatory variables of profit growth. For each model j, we are interested in the estimates of the coefficient βmj and the corresponding standard deviation in the extreme bounds analysis.
Based on Alhadeff and Alhadeff (1964), Rhoades and Yeats (1974), Tschoegl (1983), and Akhavein et al. (1997), it seems likely to include bank size in the growth regression. Therefore, total bank assets (TBA), the traditional size indicator, as well as the tier-one capital (TOC) are included in the profit growth regressions. Pre-tax profits (PTP) is used as variable M as, on the one hand, one might assume that being big is a relative
advantage that might result in a further rise in profits. On the other hand, we have to make do with the basic statistic property of large numbers in that the growth rate (as a percentage) declines with size.
We first analyze the model in which the two S variables (TBA, TOC) as well as pre-tax profits (PTP) are included (M). On an a priori basis, we are not sure what the sign of these variables is (hence H1 and H2). The results of the regression analysis are in column 1 of table 3. This shows that the S and M variables are all significant, given the t-statistics (confidence level >99%). TBA and PTP have a negative sign, indicating that profit
growth slows down with increasing asset and profit size of the bank. Thus, with a bigger size of the bank, measured as the amount of assets and/or profits, profit growth
(percentage growth!) is declining. However, profit growth increases with higher levels of tier-one capital. As such, we have a surprising and interesting result.
We find that profit growth becomes smaller with a bigger size of the bank as
measured by the amount of assets and by the amount of profits. Thus, with bank profits and bank assets, it is clear that H1 tends to be confirmed, whereas H2 is not. This might either be due to decreasing economies of scale or simply result from basic statistical properties of large numbers. However, profit growth increases with the size of tier-one
capital. This implies that healthier banks report better profit performance than banks that are less well endowed with tier-one capital. Furthermore, this result leads to the
confirmation of H2, whereas H1 is not confirmed.
Table 2
Bank characteristics and profit growth
1 2 3 4 5 6 7 8 TBA -0.0075 (-2.93) -0.0046 (-1.64) -0.0080 (-2.98) -0.0076 (-2.97) -0.0062 (-2.25) -0.0097 (-4.40) -0.0093 (-2.99) -0.0056 (-2.12) TOC 0.2112 (3.08) 0.1783 (2.61) 0.2332 (3.02) 0.2081 (3.02) 0.1832 (2.55) 0.2246 (3.83) 0.2365 (3.26) 0.1915 (2.84) PTP -1.0638 (-3.78) -1.1309 (-4.09) -1.0233 (-3.53) -1.0423 (-3.66) -1.1282 (-3.95) -0.8137 (-3.32) -1.0119 (-3.54) -0.9593 (-3.44) Constant 0.6090 (3.64) 0.0918 (0.34) 0.4187 (1.21) 0.7105 (3.05) 0.8646 (3.25) 0.2489 (1.60) 0.9908 (2.46) -0.0112 (-0.04)
ad. var. none GTBA GTOC VTBA VTOC VPTP CAR ROE
4.1294 (2.36) 1.3373 (0.63) -0.5561 (-0.63) -1.3239 (-1.23) 0.2221 (6.02) -0.0658 (-1.04) 0.0347 (2.35) adj. R2 0.24 0.28 0.24 0.24 0.25 0.45 0.24 0.28 F-stat. 11.55 10.46 8.71 8.71 9.09 20.92 8.94 10.45 Note:
GPTP is the dependent variable; the t-values are between parentheses; t-values are based on White hetereskedasticity-consistent standard errors (this also applies to table 3). The line "ad. var." shows the additional variables that are included, one-by-one, in the regression estimation.
Next, we add, one by one, the other characteristics of our dataset. These results are shown in columns 3-8 in table 2. Table 2 suggests that the other bank characteristics have a quite different impact on banks’ pre-tax profit growth. It appears that the growth of tier-one capital is not significantly related to profit growth. Its sign, however, is positive. Growth of bank assets, in contrast, is positively and significantly related to profit growth.
sustain their profit growth. This confirms an observation by Keeton (1999). He argues that an increase in loan growth is likely to lead to higher loan losses only if the source of the faster loan growth is a shift in the supply of bank credit. However, the link between loan growth and loan losses is far from airtight, as there are numerous other factors involved. Furthermore, quite naturally of course, profit growth also is positively and significantly related to the volatility of this growth. Apart from the intercept (constant), all S, M variables retain their significance, signs and magnitudes.
To test the reliability of our results, bank performance variables are added to the estimation presented above. We use growth of bank assets (GTBA) and tier-one capital (GTOC), the volatility of the growth in bank assets (VTOC), tier-one bank capital
(VTOC), and banks’ pre-tax profits (VPTP), as well as banks’ capital to asset ratios (CAR), and the return to equity of the banks (ROE). Hence the total pool of Z-variables contains 7 variables. We perform, for each bank performance measure, regressions for all possible combinations of three out of the above-presented set of 7 variables. This implies that 35 (7! / (4! 3!)) estimates have been performed per performance measure.
The procedure of the Extreme Bounds Analysis (EBA) is as follows. For each regression j, we find an estimate βmj and a standard deviation σmj. The lower extreme bound is the lowest of βmj - σmj, whereas the upper bound is βmj + σmj. If the upper extreme bound for variable M is positive and the lower bound is negative, the variable M is not robust according to EBA.
The results of the Extreme Bounds Analysis are given in the columns Low and High in table 3. It can be seen that in all cases there is a sign switch, so that none of the
complementary measures robustly affects profit growth when EBA is used. However, this is not remarkable given the fact that 35 estimates per measure are done, and the EBA implies that if in only one of these the measure is not significant, the analysis indicates "not robust".
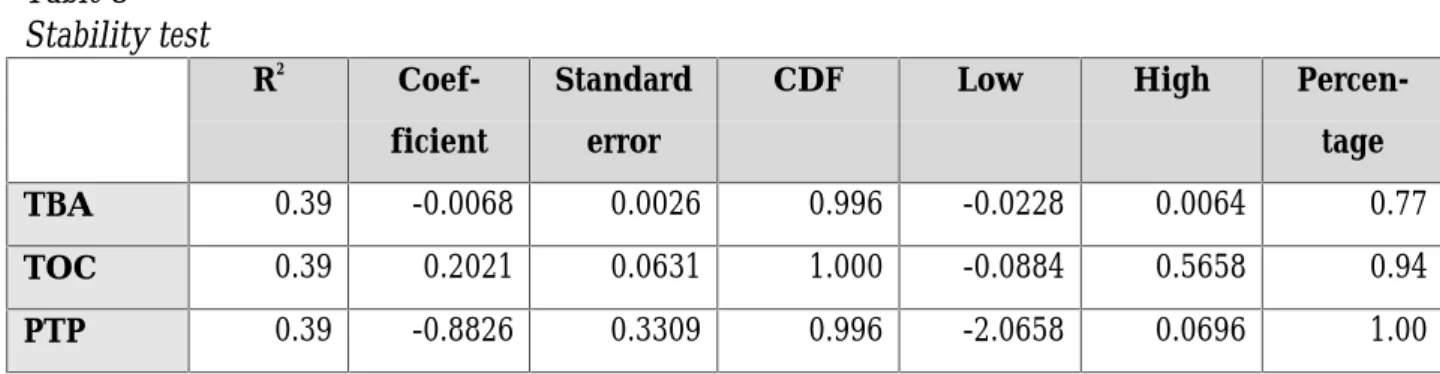
Table 3 Stability test R2 Coef-ficient Standard error
CDF Low High
Percen-tage
TBA 0.39 -0.0068 0.0026 0.996 -0.0228 0.0064 0.77
TOC 0.39 0.2021 0.0631 1.000 -0.0884 0.5658 0.94
PTP 0.39 -0.8826 0.3309 0.996 -2.0658 0.0696 1.00
Sala-i-Martin (1997) comes up with an alternative robustness test. His analysis boils down to looking at the entire distribution of the coefficient βm instead of a zero-one (robust-fragile) decision and calculating the fraction of the cumulative distribution lying on each side of zero. By assuming that the distribution of the estimates of the coefficients is normal and calculating the mean and the standard deviation of this distribution, the cumulative distribution function (CDF) can be calculated. His methodology starts by computing the point estimates of βmj and the standard deviation σmj per regression. The mean estimate of the coefficient and the average variance are then calculated as:
βm = ∑β mj 2 / n. σm = ∑σmj 2 / n.
The mean estimate of the coefficient and the average standard error are the mean and the standard deviation of the assumed normal distribution. In table 3, the mean estimate is given by the column Coefficient; the mean standard deviation by the column Standard
error. Finally, by using a table for the cumulative normal distribution, it can be calculated
which fraction of the cumulative distribution function is on the right or left-hand side of zero. In table 3, CDF denotes the largest of the two areas. If CDF is above 0.95 it is
concluded, according to this analysis, that the additional measure has a robust effect of banks’ profit performance. Using the latter stability analysis, it appears that our key indicators clearly have a robust effect on banks’ pre-tax profits. Finally, the last column of table 3 shows the percentage of all regressions for which the bank characteristic is
significant at the 90% level. Indeed, the three bank characteristics have a significant effect on pre-tax profit growth in the majority of the regressions.
4. Conclusion
This paper examines profit performance of the banking industry in an
international context. The analysis of market structure of the banking industry in the main industrialized economies shows that there is a very weak association between bank profitability and bank concentration. This suggests that, on a national level, bank
concentration does not result in monopoly profits in the banking sector. This aggregate, sectoral, analysis is complemented with an investigation of the micro-economic behavior of a sample of 100 international banks. The results clearly confirm the relevance of
individual bank characteristics for profit growth. We find that profit growth is to be positively associated with the size of a bank’s tier-one capital. However, profit growth is inversely related to size, when bank size is measured by bank assets or pre-tax profits. These results are robust and significant. They underline the utmost importance of bank soundness, rather than asset size, for sustainable bank performance.
References
Akhavein, J.D., Berger A.N. and Humphrey, D.B., “The effects of megamergers on efficiency and prices: Evidence from a bank profit function”, Review of Industrial
Organization, 1997, 12, 95-139.
Alhadeff, D. and Alhadeff, C., “Growth of large banks, 1930-1960”, Review of Economics
and Statistics, 1964, 46, 356-363.
Basle Committee on Banking Supervision, International Convergence of Capital
Measurement and Capital Standards. Basle: Bank for International Settlements, 1988.
Berger, A.N., Demsetz, R.S. and Strahan, P.E., “The consolidation of the financial services industry: Causes, consequences and implications for the future”, Journal of Banking
and Finance, 1999, 23, 135-194.
Gibrat, R., Les inégalités économiques, Paris : Sirey , 1931.
Keeton, W.R., “Does faster loan growth lead to higher loan losses?, Federal Reserve Bank of
Kansas City Economic Review, 84 (2), 57-75.
Llewellyn, D.T., The New Economics of Banking, Amsterdam: SUERF, 1999.
Rhoades, S.A. and Yeats A.J., “Growth, consolidation and mergers in banking”, Journal of
Finance, 1974, 29, 1397-1405.
Sala-i-Martin, X., “I just ran two million regressions”, American Economic Review, 1997, 87, 178-183.
Tschoegl, A., “Size, growth and transnationality among world’s largest banks”, Journal of
Appendix A
Banks included in this survey
(between brackets is the country of origin)
Allied Irish Banks (Irl), ASLK-CGER Bank (Bel ), Australia & New Zealand Banking Group (Aus), Banca Commerciale Italiana (It), Banca di Roma (It), Banca Monte dei Paschi de Siena (It), Banca Nazionale del Lavoro (It), Banco Bilbao Vizcaya (Sp), Banco do Brasil (Bra), Banco Itau (Bra), Banco Popular Español (Sp), Banco Santander (Sp), Bank Hapoalim (Isr), Bank Leumi le-Israel (Isr), Bank of China (China), Bank of Communications (China), Bank of Montreal (Can), Bank of New York (US), Bank of Scotland (UK), Bank of Taiwan (Taiw), Bank of Yokohama (J), BankAmerica Corp (US), Bankers Trust (US), Banque Nationale de Paris (F), Barnett Bank (US), Barclays Bank (UK, Bayerische Hypotheken- & Wechsel-Bank (G), Bayerische Landesbank (G), Bayerische Vereinsbank (G), Caixa Geral de Depositos (Por), Canadian Imperial Bank of Commerce (Can), Chiba Bank (J), Citicorp (US), Comercia (US), Commerzbank (G), Commonwealth Bank Group (Aus), Compagnie Financiere de Paribas (F), Credit Agricole Groupe (F), Credit Lyonnais (F), Credit Suisse Groupe (Swi), Credito Italiano (It), Dai-Ichi Kangyo (J), Daiwa Bank (J), DBS Bank (Sing), Den Danske Bank (Den), Deutsche Bank (G), DG Bank (G), Dresdner Bank (G), Fuji Bank (J), Generale Bank (Bel), Groupe Banques Populaires (F), Groupe Caisse d'Epargne (F), Hachijuni Bank (J), Industrial Bank of Japan (J), Instituto Bancario San Paolo di Torino (It), Istituto Mobilare Italiano (It), Joyo Bank (J), JP Morgan & Co. (US), Kreditanstalt fur Wiederaufbau (G), Landeskreditbank Baden-Wurttemberg (G), Long-Term Credit Bank of Japan (J), Mellon Bank Corporation (US), Mitsubishi Trust & Banking
Corporation (J), Mitsui Trust & Banking (J), National Australia Bank (Aus), National Bank of Canada (Can), National City Corporation (US), National Westminster Bank (UK), Nippon Credit Bank (J), Norinchukin (J), Norwest Corporation (US), Oversea-Chinese Banking Corporation (Sing), PNC Bank Corporation (US), Rabobank Nederland (Net), Republic New York
Corporation (US), Royal Bank of Canada (Can), Royal Bank of Scotland (UK), Sanwa Bank (J), Shizuoka Bank (J), Shoko Chukin Bank (J), Skandinaviska Enskilda Banken (Swe), Société
Générale (F), Standard Chartered (UK), State Street Boston Corporation (US), Sumitomo Bank (J), Sumitomo Trust & Banking (J), Suntrust Banks (US), Svenska Handelsbanken (Swe), Swiss Bank Corp (Swi), Tokai Bank (J), Toronto-Dominion Bank (Can), Toyo Trust & Banking Company (J), Union Bank of Switzerland (Swi), United Overseas Bank (Sing), Wachovia Corporation (US), Westdeutsche Landesbank Girozentrale (G), Westpac Banking Corporation (Aus), Yasuda Trust & Banking (J), Zenshinren Bank (J), Zürcher Kantonalbank (Swi).