Behavioral/Systems/Cognitive
Visual Feedback Control of Hand Movements
Jeffrey A. Saunders and David C. Knill
Center for Visual Science, University of Rochester, Rochester, New York 14627
We investigated what visual information contributes to on-line control of hand movements. It has been suggested that motion
informa-tion predominates early in movements but that posiinforma-tion informainforma-tion predominates for endpoint control. We used a perturbainforma-tion method
to determine the relative contributions of motion and position information to feedback control. Subjects reached to touch targets in a
dynamic virtual environment in which subjects viewed a moving virtual fingertip in place of their own finger. On some trials, we
perturbed the virtual fingertip while it moved behind an occluder. Subjects responded to perturbations that selectively altered either
motion or position information, indicating that both contribute to feedback control. Responses to perturbations that changed both
motion and position information were consistent with superimposed motion-based and position-based control. Results were well fit by
a control model that optimally integrates noisy, delayed sensory feedback about both motion and position to estimate hand state.
Key words:
sensorimotor; movement; hand; vision; on-line control; Kalman filter
Introduction
We recently reported evidence that visual feedback from the hand
contributes to on-line control of reaching throughout the full
extent of the movement, even for relatively fast movements
(Saunders and Knill, 2003). In the current research, we used a
similar method to investigate exactly what visual information is
used for feedback control. Two components of visual feedback
that could potentially contribute are information about the
posi-tion of the hand and informaposi-tion about the moposi-tion of the hand.
The experiments reported here test the relative contributions of
these two feedback signals to control of pointing movements.
A number of control strategies could be based solely on
feed-back about hand position. A visual feedfeed-back controller might
steer to maintain a predetermined visual path, making corrective
adjustments whenever sensory feedback indicates that the
posi-tion of the hand has deviated from the desired trajectory.
Adap-tation studies provide evidence that the motor system does
at-tempt to maintain preferred kinematic trajectories, such as
straight-line paths (Shadmehr and Mussa-Ivaldi, 1994; Wolpert
et al., 1995a). Another type of model, the vector integration to
endpoint (VITE) model of Bullock and Grossberg (1988), maps
the difference vector between hand and target positions onto a
desired hand velocity.
Motion information alone could also be used to guide hand
movements. A kinematic controller that generates desired
veloc-ity changes (or acceleration changes) could use a homing strategy
of keeping the visual motion of the hand directed toward the
target, for example. Such a controller would rely solely on the
visual motion of the hand relative to the target and would not
need information about the position of the hand to generate
kinematic “commands.” It would therefore be robust to small
miscalibrations of visual and nonvisual coordinates and could be
generalized to tasks like controlling a mouse cursor that involve an
arbitrary mapping from motor to visual space. Solving the inverse
dynamics problem of mapping kinematic signals to muscle
activa-tion would still require informaactiva-tion about the pose of the hand in
body-centered coordinates; however, this information is potentially
available from nonvisual sources [for evidence that vision and
pro-prioception contribute differently to kinematic planning and solving
inverse dynamics, see Sober and Sabes (2003)].
Paillard (1981, 1996) has argued that both position and
mo-tion feedback contribute to controlling hand movements, but in
different movement phases: a fast homing-type strategy based on
visual motion is used during the initial part of movements, and a
slower position-based strategy is used for final end-phase
adjust-ments. The two-phase proposal is based on the intuition that motion
acuity remains high in the periphery, whereas position acuity
de-creases sharply with retinal eccentricity. An optimal controller,
how-ever, would use visual information about both position and motion
continuously throughout a movement, with the relative
contribu-tions of the two signals depending on their relative reliability.
To distinguish empirically the contributions of visual motion
and position feedback signals to on-line control, we measured
responses to dynamic perturbations of visual feedback from the
hand. To perturb visual feedback from the hand during
move-ments, we used a simple but finely calibrated virtual display
sys-tem in which subjects viewed a moving virtual fingertip rather
than the real fingertip. This allowed us to apply dynamic changes
to the mapping from physical to visual space. We applied a
num-ber of different remappings to isolate the relative contributions of
motion and position feedback for on-line control of subjects’
pointing movements. Results were compared with the behavior
of a feedback controller that optimally integrates delayed
infor-mation about the position and velocity of the hand to
continu-ously update internal estimates of hand state.
Materials and Methods
Design and conditions. Figure 1 shows a schematic of the virtual display system and an illustration of the trial sequence from the vantage point of
Received Sept. 23, 2003; revised Feb. 11, 2004; accepted Feb. 12, 2004.
This research was supported by National Institutes of Health Grant EY09383. We thank Kavita Kadiwar for assistance in collecting data and two anonymous reviewers for their helpful comments. A part of these results was presented at the 2002 annual meeting for The Society of Neuroscience.
Correspondence should be addressed to Jeffrey A. Saunders, University of Rochester, Center for Visual Science, Meliora Hall 283, Rochester, NY 14627. E-mail: [email protected].
DOI:10.1523/JNEUROSCI.4319-03.2004
the subject. Subjects performed a simple pointing task, with visual feed-back provided by a small sphere that moved in real time with their unseen fingertip. On one-third of the trials, the mapping from physical space to visual space was changed while the virtual fingertip moved behind an occluder. The remappings varied from trial to trial, and both perturba-tion type and direcperturba-tion were randomized to prevent adaptaperturba-tion. The occluder served to mask the perturbation onsets, and all of the subjects reported being unaware of the perturbations when questioned after the experiment, even when told what they would have looked like. Kinematic data consisted of the three-dimensional (3D) position of a subject’s fin-gertip sampled at 480 Hz during the movements.
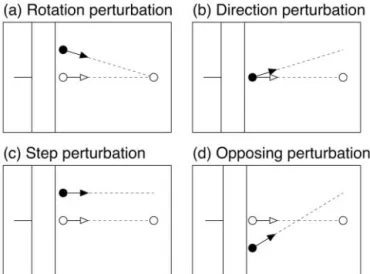
We chose four different types of perturbations to distinguish possible visual control signals. Feedback control based on the relative motion of the hand, as in a homing strategy, would be unaffected by perturbations that preserve the relationship between the movement of the visual hand
and the target. Figure 2ashows an example of such a perturbation. Visual
space was rotated around the target, so that the perturbed position of the finger was displaced relative to the unseen hand while leaving its motion relative to the target unchanged. We refer to this as a “rotation” perturbation.
A second type of perturbation, shown in Figure 2b, altered the motion
of the virtual fingertip when it emerged from behind the occluder while initially leaving its position unchanged. Because the change in movement direction was small, the discrepancy in position increased only slowly over time, so a controller that relied solely on position feedback would be expected to show only a delayed response to such perturbations relative to the rotation perturbation. We refer to this as a “direction” perturbation.
Figure 2,candd, illustrate two other classes of perturbations that
produce different initial displacements in position, either upward or downward, but the same change in relative motion as the direction per-turbations. We will refer to these as “step” perturbations and “opposing” perturbations. To the extent that feedback control is based on the relative motion of the hand, these perturbations would be expected to have sim-ilar effects. On the other hand, on the basis of position feedback, these perturbations would be expected to produce responses in opposite directions.
Apparatus and display. Visual displays were presented in stereo on a computer monitor viewed through a mirror (Fig. 1), using CrystalEyes
(Stereographics, San Rafael, CA) shutter glasses to present different ste-reo views to the left and right eyes. The left and right eye views were accurate perspective renderings of the simulated environment. Displays
had a resolution of 1024⫻768 pixels and a refresh rate of 120 Hz (60 Hz
for each eye’s view). The stimuli and feedback were all drawn in red to take advantage of the comparatively faster red phosphor of the monitor and prevent interocular cross-talk.
The horizontal mirror prevented a view of the subject’s hand. Visual feedback about hand position was provided instead by a 1-cm-diameter virtual sphere that moved in real time along with the subject’s actual finger. The targets of subjects’ movements were 1-cm-diameter circles
rendered to be aligned with an unseen tabletop (⬃55 cm from the eyes),
which provided consistent haptic feedback when a subject’s finger touched a target.
In addition to the target and the virtual fingertip, displays included a planar annular-shaped occluder object, rendered to appear 9 cm above the tabletop. At this height, the virtual finger passed behind the occluder on normal movements. In experiment 1, the radius and width of the occluder were set so that its cyclopean projection onto the tabletop had an inner radius of 19 cm and an outer radius of 23 cm relative to the target (projected width 4 cm), and it was positioned so that its occluded region was centered on the line connecting the finger starting location to the target. In experiment 2, occluders were positioned similarly and had the same inner radius but were extended to have an outer radius of 32 cm, so that the virtual fingertip was occluded even at the start of movements. In both experiments, the virtual finger emerged from behind the occluder at approximately the same distance from the target: 19 cm (25% of the distance to the target). The exact distance varied somewhat across trials, because it depended on finger height as well as progress toward the target. The four types of perturbations have been described qualitatively in the previous section. The specific mappings used in these cases were chosen to equate as closely as possible three parameters: the initial
posi-tion displacements (0 or⫾2 cm), the change in the initial direction of the
virtual finger relative to the target (0° or⫾6°), and the size of the
correc-tion needed to compensate for the perturbacorrec-tion (0 or⫾2 cm). For
rota-tion perturbarota-tions, the visual coordinates for rendering the virtual
fin-gertip were rotated by⫾6° around the target. At a distance of 19 cm from
Figure 1. a, Illustration of the experimental apparatus. Subjects were presented with stereo images using shutter glasses and a monitor viewed through a mirror. The mirror prevented a view of the hand and allowed artificial visual feedback to be presented in the subjects’ manual workspace. Subjects moved their fingers to visual targets that were aligned with a tabletop. An Optotrak 3020 system tracked infrared markers attached to a subject’s finger, and these data were used to render a virtual sphere representing the subject’s fingertip (virtual finger).b, Illustrationofatrialsequence.Viewsshowatop-downprojectionontothetabletop.Atthestart of a trial (top panel), a target (open circle) and virtual fingertip (solid circle) appear, along with an annular-shaped occluder. The subject’s task was to move the virtual fingertip to touch the target. During initial movement, the virtual fingertip coincided with the actual location of the subject’sunseenfinger.Onperturbedtrials,whenthefingeremergedfrombehindtheoccluder, its position and direction of motion were changed and no longer matched the actual finger (middle panel). Depending on the perturbation condition, subjects may have had to compen-sate for the perturbation to successfully reach the target with the perturbed virtual fingertip (bottom panel).
Figure 2. Illustration of the four perturbation types.a, Rotation perturbations: visual space was rotated around the target, such that position of the virtual fingertip was displaced relative to the unseen finger, but the direction of motion relative to the target was unchanged.b, Direction perturbations: visual space was rotated around a point just past the occluder, along the line connecting initial and target positions. The position of the virtual fingertip initially coincided with the actual finger, but its direction of motion was different.c, Step perturbations: visual space was displaced in the direction perpendicular to main axis of movement. This changed both the position of the virtual fingertip and its direction of motion relative to the target.d, Opposing perturbations: visual space was rotated around a point between the target and the emergent point. This also changed both the position and the relative motion of the virtual fingertip, but in opposite directions compared with step perturbations.
the target, which is approximately where the virtual fingertip would have emerged from behind the occluder, this rotation produces an initial
po-sition displacement of⫾2 cm. The actual amount of initial position
conflict varied slightly depending on the height of the hand when it emerged from behind the occluder, but for the viewing conditions used and the small vertical movements made by subjects, the discrepancy was
negligible. For direction perturbations, visual space was rotated by⫾6°,
but around the point 19 cm away from the target along the line connect-ing target and startconnect-ing positions. To compensate for the rotation, the
endpoint of the unseen hand would have had to be⫾2 cm from the target
in theydirection. If the path of the finger did not follow a straight line to
the target, this rotation would have produced a slight change in the initial position of the hand, but for the modest amounts of curvature that we
observed (⬃2 cm from straight path), the shifts would have been very
small, on the order of 0.02 cm. For step perturbations, visual space was
globally shifted by⫾2 cm in they-axis direction. When the hand initially
became visible at a distance of 19 cm, the direction of the shifted virtual
finger relative to the target was changed by⫾6°, the same as in the
direction perturbation condition. Finally, opposing perturbations were generated by rotating visual coordinates by 12° around a point 9.5 cm from the target (halfway between the target and near edge of the oc-cluder). The initial position of the virtual fingertip was displaced by
approximately⫾2 cm, and the shift in endpoint required to compensate
for the perturbation was 2 cm, in the direction of the initial displacement. The initial change in the direction of motion relative to the target for this condition was slightly smaller than in the other conditions, on average 5.9° instead of 6°. This was an unavoidable consequence of constraining
the required endpoint correction to be⫾2 cm, as in the other conditions.
An Optotrak 3020 system (NDI, Waterloo, Ontario, Canada) recorded the time-varying position of a subject’s finger at 480 Hz. The data were used to dynamically update the position of the virtual fingertip. Subjects wore a finger splint on their right index finger, which had a triad of active infrared markers. The position of a subject’s fingertip within the splint was computed from the position of the three markers attached to the
splint. The optical measurements had very small latencies (⬍2 msec), but
the speed of the graphical rendering loop imposed a significant
addi-tional latency on visual feedback,⬃42 msec for the first experiment and
25 msec in the second experiment (different graphics cards). When com-puting the rendered position of the virtual fingertip, we compensated for this delay by linearly extrapolating from the latest marker position, using the position from previous frames to estimate velocity. For the experi-ments, we used an extrapolation time of 33 msec, which we later discov-ered to be an underestimate of delay in the first experiment and an overestimate in the second. The inaccurate delay estimates contributed a bias in rendered finger position of up to 0.6 cm along the direction of movement at the point of average peak velocity. The bias in the
perpen-dicular direction was much smaller, peaking at⬃0.05 cm for the average
peak velocity in that direction. Linear extrapolation contributed an
ad-ditional bias in thexposition of the virtual finger caused by acceleration
of the hand, varying between approximately⫺0.3 cm at the point of peak
acceleration to 0.3 cm at peak deceleration. The biases in theydirection
caused by extrapolation were comparatively small, ranging between
ap-proximately⫾0.02 cm. Extrapolation also had the effect of amplifying
the intrinsic noise in Optotrak measurements; however, even after
am-plification, this noise remained small (rms error⫽0.016 cm).
Spatial calibration of the virtual environment required computation of the coordinate transformation from the reference frame of the Opto-trak to the reference frame of the computer monitor and the location of a subject’s eyes relative to the monitor. These parameters were measured at the start of each experimental session using an optical matching pro-cedure. The backing of the half-silvered mirror was removed temporarily so that subjects could see their hand and the monitor simultaneously, and subjects aligned an Optotrak marker to a sequence of visually cued locations. Cues were presented monocularly, and matches were per-formed in separate sequences for left and right eyes. Thirteen positions on the monitor were cued, and each position was matched twice at dif-ferent depth planes. The combined responses for both eyes were used to determine a globally optimal combination of 3D reference frame and eye position. After the calibration procedure, a rough test was performed in
which subjects moved a marker viewed through the half-silvered mirror and checked that the position of a rendered dot was perceptually coinci-dent with the marker. Calibration was deemed acceptable if deviations
appeared to be⬍1–2 mm. Otherwise, the calibration procedure was
repeated.
Procedure. The task for subjects was to move their finger back and forth to touch a series of targets presented in the virtual environment. At the start of a trial, a new target would appear on the opposite side of the workspace as the current hand position. The target onset was the cue to move. Subjects were instructed to move to touch the target in a fast and “natural” manner. On reaching the target, they were to keep their finger in place until the next target appeared. Data collection was triggered by initiation of movement and continued for 1.5 sec. Immediately after this recording period, a new target appeared and the occluder was reposi-tioned, indicating the start of the next trial. The time between successive trials varied depending on how quickly subjects initiated movement,
averaging⬃2 sec.
Subjects were instructed to try to move at about the same speed on each trial. Feedback was provided throughout the experiment to train subjects to reach the target within a range of times around a goal time of 500 msec. Subjects received positive feedback for movement durations within 75–125% of the goal time (a larger circle appeared around target) and negative feedback otherwise (“X” through target indicating too fast; no change indicating too slow). For purposes of feedback, reaching the
target was defined as bringing the virtual finger to a stop (speed⬍0.5
mm/sec) within 1 cm of the center of the target. Before the main exper-iment blocks, subjects were allowed 20 – 40 unperturbed practice trials to familiarize themselves with the timing constraint.
The targets varied in location within two ellipses on the table, which were 10 cm wide, 16 cm tall, and separated by 28 cm. The target position for a trial was chosen relative to the end location of the previous trial. The
target distance was always 28 cm (⬃26° of visual angle), whereas the
direction from the starting position to the target varied randomly
be-tween⫺15° and⫹15° relative to the horizontal midline of the table,
subject to the constraint that the endpoint lay within the target ellipse. Occasionally, subjects moved their hands toward the center of the work-space too early (contrary to instructions), such that it was impossible to satisfy the criteria. In these cases, a random position within the opposite ellipse was chosen as target location, and the trial was discarded from analysis.
Perturbations were applied on one-third of the trials. Perturbed and unperturbed baseline trials were randomly intermixed, with the con-straint that at least one baseline trial separated any two perturbed trials. This constraint was included to reduce the potential for interference across sequential perturbed trials. For the same reason, we also excluded from analysis all baseline trials that were preceded by perturbed trials. This reduced the amount of baseline trials available for analysis by half.
In experiment 1, the virtual fingertip remained visible at the end of a trial and the start of the subsequent trial. To prevent sudden jumps in figure position after a perturbed trial, the preceding remapping remained in effect until the hand passed behind the occluder, at which point the perturbation was turned off. This was not an issue for experiment 2, because the hand was not initially visible.
Before analysis, data were filtered to remove various types of irregular trials. These included trials with incomplete data caused by occluded markers, trials with mistimed recording caused by a false start, trials in which subjects began moving before the target appeared, and trials in
which motion was not complete within⫾40% of the goal time. Some
trials contained isolated frames in which the markers were occluded from view from the Optotrak. If there were no more than four nonsequential missing frames on a trial, the trial was not excluded. Instead, the data from isolated missing frames were filled in by linearly interpolating be-tween adjacent frames. Trials with adjacent missing frames, or with more than four isolated missing frames, were excluded from analysis.
Subjects participated in three experimental sessions on separate days. Each began with calibration of the virtual environment, followed by practice trials to familiarize a subject with the task, and then two blocks of experimental trials separated by a brief break. Subjects performed 528 trials in each experimental block. Before irregular trials were filtered (see
above), this yielded a total of 264 trials per perturbation type (half posi-tive and half negaposi-tive), 1056 postperturbation trials, and 1056 baseline unperturbed trials.
Data analysis. Movements showed large variability in overall trajectories but were also very smooth, so much of the variability could be attributable to differences in initial conditions, motor plans, goal paths, etc. To derive a sensitive measure of the effect of perturbations, we temporally decorrelated the data series using linear filters fit to the data (Saunders and Knill, 2003).
We assumed that for unperturbed trials the position of the fingertip at
timetwas a linear function of thenprevious positions:
p共t兲⫽w1共t兲 䡠 p共t⫺1兲⫹w2共t兲 䡠 p共t⫺2兲. . . wn共t兲 䡠 p共t⫺n兲. (1)
The weightsw1(t),w2(t), . . .wn(t) were allowed to vary as a function of
time but were assumed to be constant across trials. To align the data
series temporally, we definedt⫽0 to be the moment when the hand
emerged from behind the occluder, so thattrepresents time after
pertur-bation. Because there was variability in speed and time course of trials, the assumption of that weights are the same across trials corresponds to
assuming that the weights are relatively constant over small shifts int.
If the data series are smooth and temporally correlated, the linear model given by Equation 1 should closely fit the data and account for most of the variability across trials. Responses to perturbations can be distinguished as changes in trajectory that would not be predicted solely on the basis of the previous path. Thus, we augmented the model with an added term representing the effect of perturbations:
p共t兲⫽w1共t兲 䡠 p共t⫺1兲⫹w2共t兲 䡠 p共t⫺2兲. . . wn共t兲 䡠 p共t⫺n兲
⫹wpert共t兲 䡠 ⌬pert, (2)
where⌬pertis⫹1 for positive perturbations and⫺1 for negative
pertur-bations. The functionwpert(t) represents the evolving influence of the
perturbation on subjects’ movements and should be zero for times before subjects show any corrective response to perturbations. We refer to this function as the perturbation influence function.
For each subject, we applied linear regression to the baseline trials to
estimate the autoregressive weights in equation 1). We setn⫽6for the
analysis but found that the results were insensitive to the exact value for
n ⬎6. To compute influence functions for each perturbation type
[wpert(t)], we correlated the sign of the perturbations (⫹1,⫺1) on
per-turbation trials with the error between the hand position at timetand the
position predicted by the autoregressive model. For testing, we applied
the analysis separately to thexandycomponents of finger position (in
tabletop coordinates), but thexcomponents yielded no significant
ef-fects, so we only report the results for theycomponents here.
Response latencies to the perturbations,tresp, were derived by
comput-ing the first point in time at which the perturbation influence functions,
wpert(t), were significantly different from zero. The raw influence
func-tion was first smoothed with a one-sided (causal) exponential filter,
f(t)⫽exp(t) fort⬍0, with⫽25 msec, producing a time-weighted
cumulative measure of the perturbation influence. The filtered result,
f(t)*wpert(t), was compared at each timetto a statistical threshold derived
from resampling baseline trials, and the earliest superthreshold time was taken to be the response latency. The resampling procedure consisted of repeatedly applying the analysis to randomly chosen baseline trials (sam-pling with replacement) and using the results to estimate the null-model
noise distribution of filteredwpert(t).
Subjects. Five subjects participated in experiment 1, and eight subjects participated in experiment 2. All were naive to the purposes of the exper-iment and were paid to participate. Subjects provided informed consent in accordance with guidelines from the University of Rochester Research Subjects Review Board. Our apparatus required that subjects use their right hand, so only right-handed subjects were accepted.
Modeling. For comparison with human data, we implemented a feed-back control model that optimally integrates noisy position and velocity feedback signals over time and simulated the performance of the model for the conditions of our experiments. The model was an expanded ver-sion of the feedback control system proposed by Hoff and Arbib (1993), in which the sensory front-end is augmented with a Kalman filter for integrating noisy sensory feedback with ongoing estimates of hand state. We modeled the dynamics of the hand as a linear system driven by a jerk signal (derivative of acceleration) that satisfies the minimum jerk prin-ciple, as proposed by Hoff and Arbib (1993). The system was corrupted by two independent sources of added Gaussian noise, one with SD pro-portional to the jerk signal and the other with a constant SD. The general form for the system dynamics is given by:
Xth⫹1⫽AXth⫹1⫹ut⫹
冘
i
i,tCit⫹t, (3)
where the state vector represents the two-dimensional position, speed, and acceleration of the hand in a coordinate frame aligned with the table, as well as the two-dimensional position of the target on the table (we did not simulate the small movements in the perpendicular direction that
sub-jects show). Thex-axis was taken to be in the direction of the target from the
original hand position, and they-axis was defined as the perpendicular
di-rection within the plane of the table.⑀i,tis a standard normal random
vari-able,Cirepresents the proportional motor noise, andtis a constant noise
source with covariance matrix⌺. The state vector is given by:
Xth ⫽关xt,x⬘t,x⬙t,yt,y⬘t,y⬘t,Tx,Ty兴T, (4)
whereTxandTyrepresent the position of the target. The state transition
matrix,A, is given by:
A⫽
冤
1 ⭸ 0 0 0 0 0 0 0 1 ⭸ 0 0 0 0 0 0 0 1 0 0 0 0 0 0 0 0 1 ⭸ 0 0 0 0 0 0 0 1 ⭸ 0 0 0 0 0 0 0 1 0 0 0 0 0 0 0 0 1 0 0 0 0 0 0 0 0 1冥
, (5)where⭸ is the time step used to iterate the update equations in the
simulations. Given an estimate of the state of the system at timet, the
minimum jerk control law is given by (Hoff and Arbib, 1993):
u
1t⫽
冤
0
0
0
0
0
0
0
0
0
0
0
0
0
0
0
0
⫺
60
共
D
⫺
t
⭸
兲
3⫺
36
共
D
⫺
t
⭸
兲
2⫺
9
共
D
⫺
t
⭸
兲
0
0
0
60
共
D
⫺
t
⭸
兲
30
0
0
0
0
0
0
0
0
0
0
0
0
0
0
0
0
0
0
0
⫺
60
共
D
⫺
t⭸
兲
3⫺
36
共
D
⫺
t⭸
兲
2⫺
9
共
D
⫺
t⭸
兲
60
共
D
⫺
t⭸
兲
30
0
0
0
0
0
0
0
0
0
0
0
0
0
0
0
冥
X
ˆ
kt.
(6)
To realistically model the visual feedback available to the human visual– motor system, we had to account for two properties of the visual feed-back. First, the uncertainty of both position and motion information, as reflected in discrimination thresholds, varies as a function of the state of the hand. Positional acuity is inversely proportional to eccentricity; thus it is well modeled by a noise source with SD proportional to position of the hand in retinal coordinates (Levi et al., 1988; Burbeck and Yap, 1990; Whitaker and Latham, 1997). Similarly, motion acuity, in both speed and direction, varies with target speed. Motion discrimination thresholds are well fit by a model in which the velocity components in both the direction of motion and the perpendicular direction are corrupted by a mixture of proportional noise, the SD of which is proportional to the speed of the motion, and a constant noise component (Orban et al., 1985; De Bruyn and Orban, 1988). Second, estimates of position and velocity are effec-tively low-pass filtered by the visual system. Psychophysical sensitivity to periodic modulations in both speed and direction of motion is well fit by a model in which velocity estimates are filtered through a second-order filter with a time constant of 40 msec (Werkhoven et al., 1992). Although similar estimates are not available in the literature for position estimates, we assumed that the same filter applies to position estimates.
To incorporate the state-dependent nature of visual noise and the temporal filtering of visual feedback, we found it convenient to incorpo-rate the sensory parameters in an augmented state vector along with the hand and target state parameters. The full state vector was:
Xi⫽关XihT,XtsT兴T, (7)
where the sensory subvector is augmented by dummy variables used to implement the second-order filter:
Xts⫽关V˜t,v˜⬘t,w˜t,w˜⬘t,v⬘t,wt,w⬘t兴, (8)
with update equations:
v˜r⫹1⫽e⫺␦/v˜t⫹xt,v˜t⫹1⫽e⫺␦/v⬘t⫹x⬘t,vt⫹1⫽e⫺␦/v˜t
⫹e⫺␦/v
t,v⬘t⫹1⫽e⫺␦/v˜⬘t⫹e⫺␦/v⬘t. (9)
Similar equations apply to thewparameters that represent they-position
and they-component of velocity.⭸is the time step used in the simulation
to iterate the update equations, and⫽40 msec is the time constant of
the filter. The update equations (Eq. 9) are modeled by appropriate
en-tries in an augmented update matrixA.
To accommodate the state-dependent noise in the sensory signal, the update equation for the full system takes the form:
Xt⫹1⫽AXt⫹LXˆ1⫹
冘
t
i,tClLtXˆt⫹
冘
iiDtXt⫹i. (10)
The second term is the control law given in Equation 6 above, the third term represents the signal-dependent motor noise, and the fourth term represents the state-dependent noise used to model state-dependent un-certainty in the sensory estimates of position and velocity.
The sensory signal is modeled by the equation:
Zt⫽HXt⫹t, (11)
whereHis a matrix that simply peels off the temporally filtered, noisy
estimates of position and velocity (vt,vt⬘,wt,wt⬘), andtis a constant noise
source with covariance matrix,⌺.
The optimal, adaptive Kalman filter for this system is given by the time update equations:
Xˆt⫹1⫽共A⫹Lt兲Xˆt⫹AKt共Zt⫺HXˆt兲, (12)
where the Kalman gain matrix,Kt, is given by:
Kt⫽A
冘
tHT共H冘
tHT⫹冘
t兲⫺1. (13)⌺tis the error covariance matrix for the state estimate at timet. The error
covariance matrix is updated according to the time update equation:
冘
t⫹1⫽A冘
tAT⫺KtH冘
tAT⫹冘
i CiLtXˆtXˆtTLtTCiT⫹冘
i Di共冘
t ⫺Kt⬘H冘
t兲DiT⫹冘
i Di关Xˆt⫹Kt⬘共Zt⫺HXˆt兲IXˆt⫹Kt⬘共Zt ⫺HXˆt兲兴TD iT⫹冘
, (14)whereKⴕis the modified Kalman gain (used to predict the state of the
system at timetrather than to predict the state of the system at timet⫹
1, given by:
Kt⬘⫽
冘
tHT共H冘
tHT⫹冘
t兲⫺1. (15)The Kalman filter runs delayed by⌬msec, so the delayed state estimates
are propagated forward through the state update equations using the
remembered values of the motor commands,ut, to arrive at an estimate
of the current hand state.
To simulate the model, we had to set parameters for the visual noise on position and velocity. We chose values that fit with observed psychophys-ical data, as described below. We fit the motor noise parameters and the sensorimotor delay by hand to subjects’ data.
Modeling: position noise. We used results from two-point interval dis-crimination studies to set the parameters for visual noise on position estimates (Burbeck, 1987; Burbeck and Yap, 1990; Whitaker and Latham, 1997). The data from these studies are consistent with a Weber fraction of 0.05 on position estimates beyond several degrees away from the fovea for stimuli viewed for 250 msec. This value is invariant to a large number of properties of the target (Burbeck, 1987; Toet and Konederink, 1988). Because subjects’ finger movements were almost entirely along the axis
between the starting position and the target (thex-axis), we modeled the
SD of subjects’ visual estimates of hand position (for 250 msec viewing) in tabletop coordinates to be:
⫽0.05x⫹0.05
y⫽
冑
2共0.05x⫹0.05兲, (16)where the公2 factor in they-direction corrects for perspective
foreshort-ening (subjects viewed the tabletop from an angle of⬃45°). The constant
additive term models a minimum SD in position estimates of 0.5 mm in
the center of the fovea (3⬘arc) but has little impact on the behavior of the
model, because the hand is outside the fovea for most of the movement. We used a small angle approximation in treating position in tabletop coordinates as proportional to visual angle. To parameterize the noise model, we multiplied the SDs by a factor of 10.2 so that a sensory version of the Kalman filter run on static stimuli for 250 msec gave estimates with the SDs listed above.
The constant of proportionality in Equation 16 determines the
appro-priate diagonal elements of the Di matrices that model the
state-dependent noise on position. The constant noise term is the SD of the
corresponding elements of the constant noise vector,. The noise on
visual estimates of target position was modeled as being constant, be-cause the target is stationary and assumed to be fixated during
move-ment. We assumed an SD of 0.5 mm (equivalent to a visual angle of 3⬘of
arc).
Modeling: motion noise. Results from speed and direction discrimina-tion studies show a somewhat more complicated behavior than posidiscrimina-tion perception. Up to speeds of 64°/sec (close to the peak velocity measured in our experiments), Weber fractions for speed decrease to a minimum of 0.08 for viewing durations of 500 msec (Mateef et al., 2000). These results are consistent across a number of studies and types of stimuli (Orban et al., 1985; De Bruyn and Orban, 1988). Subjects’ threshold curves are well fit by a mixed constant and proportional noise model in which the SD of visual estimates of speed is given by:
where we have assumed that the speed of motion is equivalent to its
velocity along thex-axis (approximately true for most of the duration of
subjects’ movements). Using a small angle approximation to convert this to units of distance along the table top (assuming an average viewing distance of 52 cm) gives:
vx⫽1.8 cm/sec⫹0.08x. (18)
Direction discrimination thresholds behave in a qualitatively similar manner to speed discrimination thresholds, but when converted into units of speed in a direction perpendicular to the path of motion, thresh-olds are lower by more than a factor of 8. For the SD of velocity estimates perpendicular to the direction of motion, therefore, we have:
vx⫽0.025⬚/sec⫹0.01x. (19) Converting this to tabletop coordinates and adjusting for perspective foreshortening, we have for the SD:
vy⫽0.35 cm/sec⫹0.014x. (20)
Again, we approximated the principle direction of motion to be in thex
direction. We scaled the parameters by constant factor of 14.3 so that a sensory version of the Kalman filter run on static stimuli for 500 msec would give velocity estimates with SDs listed above. The constants of proportionality in Equations 19 and 20 determine the appropriate
diag-onal elements of theDimatrices that model the state-dependent noise on
position. The constant noise terms are the SDs of the corresponding
elements of the constant noise vector,.
Other model parameters. The motor noise used to fit the human data were set to:
u⫽1.5 cm/sec2⫹0.05u. (21)
The coefficient of proportionality (0.05) for the proportional noise
de-termined the diagonal elements of theC1andC2matrices corresponding
to the motor commands (the jerk signals inxandy), whereas the
con-stant noise term determined the SD of the same elements of the concon-stant
noise vector,. We simulated the model with a sensorimotor delay of 115
msec, for a duration of 750 msec, iterating the system with a time step of
⭸⫽2 msec. We simulated the occluder by setting the sensory noise
components ofto a very large number (approximating infinite noise)
for the time that the fingertip was behind the occluder. Perturbations
were induced att⫽270 msec. The duration of movement was set on the
basis of estimates of the average time that subjects’ fingers came to rest, and the time of perturbation was set on the basis of the average time after the start of movement that subjects’ fingers reappeared from behind the occluder. Simulations of the small occluder and the large occluder showed little difference in performance.
Results
Responses to perturbations
Figure 3 shows mean data for a representative subject. It is clear
that all of the perturbations induced responses, including
rota-tion perturbarota-tions, for which no correcrota-tion was required. This
can be seen most readily in the plots of mean
y
-velocity of
per-turbed trials, which diverge from that of unperper-turbed trials for all
perturbation types. In the conditions that altered relative motion,
subjects corrected their movements to almost fully compensate
for the change in required endpoint: the average error in the final
position of the virtual fingertip was 0.4 cm, corresponding to an
80% correction.
To compute a more sensitive measure of perturbation effects,
we temporally decorrelated the raw data, as described in
Materi-als and Methods. We fit an autoregressive model to predict the
position of a subject’s fingertip at each recorded frame of
move-ment as a weighted sum of the preceding positions and a weighted
contribution of the perturbation. The weight assigned to the
per-turbation at each time step provides a measure of the influence of
the perturbation on subjects’ movements. This is equivalent to
correlating the residual of the best fitting autoregressive model
with the perturbations.
Figure 4
a
plots the measured perturbation influence functions
as a function of time after the perturbation for the four
perturba-tion types, averaged across subjects. All subjects showed the same
qualitative pattern of results, with the only differences being in
overall reaction time and magnitude of the influence functions.
Rotation perturbations elicited transitory responses. For the
other conditions, initial responses were in a direction appropriate
for correcting for the overall effects of the perturbations. There
was a consistent ordering in the overall magnitude of responses
across conditions: step perturbations produced the largest effects,
direction and rotation perturbations produced intermediate
ef-fects, and opposing perturbations produced the smallest effects.
Response latencies for each subject and condition were
com-puted from the decorrelated time series. Rotation and step
per-turbations produced the fastest responses, with mean latencies of
143 msec (SD 8 msec) for rotations and 146 msec (SD 12 msec)
for step perturbations. Responses to direction perturbations had
slightly longer latencies, averaging 170 msec (SD 10 msec),
whereas opposing perturbations produced very delayed
re-sponses, with 251 msec (SD 10 msec) mean latency.
Control for motion signal
The occluder was intended to mask the motion created by the
transient jump in visual position caused by the perturbations
while maintaining the naturalness of the stimulus display;
how-ever, long-range motion processes (integrating over a region
⬃
8°
or more) could show a response to the transient jumps in three of
the perturbation conditions. We controlled for this possibility in
a second experiment, in which the task and perturbation types
were the same as before, but the occluder was enlarged so that it
covered the virtual fingertip throughout the initial movement.
Under these conditions, there is no possibility of a motion cue to
positional displacement. The time between the last view of the
virtual fingertip on a previous trial and its reappearance from
behind the extended occluder was
⬃
300 msec, during which the
large high-contrast occluder appeared, adding a large temporal
transient. If motion across the narrow occluder was a significant
factor in the perturbation responses observed in experiment 1,
one would expect responses in experiment 2 to be attenuated or
absent.
Figure 4
b
shows perturbation effects in the second
experi-ment, averaged across subjects, for the four perturbation
condi-tions. As in the previous experiment, responses were observed for
all conditions, including rotation perturbations. Overall, the
magnitude of corrections and latencies of response were similar
to the initial experiment. The only significant difference in results
was that the response latency to rotation perturbations was
slightly longer in experiment 2 (average 173 msec; SD 11 msec).
This longer latency was statistically equivalent to the response
latency to direction perturbations (average 176 msec; SD 7 msec).
The results of experiment 2 demonstrate that subjects respond to
perturbations of finger position even when motion cues to
posi-tion displacement are eliminated. The near-equivalence of the
effects across experiments strongly suggests that responses
ob-served for the narrow occluder did not depend on the long-range
motion cue.
Implications for control strategies
The results of the experiments strongly constrain the class of
models that could account for visual feedback control of reaching
movements. The data clearly contradict a model that uses only
the visual motion of the hand, such as the homing strategy
de-scribed in Introduction. In the rotation perturbation condition,
the direction and speed of motion of the hand relative to the
target are statistically the same in perturbed and unperturbed
trials, yet in perturbed trials, subjects initially corrected their
movements in a direction appropriate for the positional error
created by the perturbation. Moreover, subjects showed very
dif-ferent responses to the other three perturbation conditions,
de-spite the fact that all three conditions gave rise to equivalent
relative motion errors for a significant period of time after the
virtual finger reappeared from behind the occluder.
The results are also inconsistent with the hypothesis that the
brain only uses positional information about the hand for
feed-back. The position feedback model would predict a much slower
response to direction perturbations, in which position errors
ac-crue slowly, than to any of the other three conditions. In
experi-ment 2, however, subjects responded to these perturbations just
as quickly as to rotation perturbations, which induced immediate
positional errors. Control based solely on visual position would
Figure 3. Mean trajectories and kinematic data for a representative subject from experiment 1. The four sets of graphs (a–d) correspond to the four types of perturbations. Each graph plots three data series, corresponding to mean data from trials with positive perturbations (black lines), negative perturbations (gray lines), or no perturbations (thin lines). Before averaging across trials, the raw finger position data were normalized with respect to target direction and projected onto the tabletop (i.e., ignoring height from the table). The left graphs plot mean trajectories of the fingertip inx–yspaceonthetabletop.Thethreedashedcirclesonthegraphsshowtherangeofpositionsfortheactualunseenfingertipthatwouldsuccessfullyhavebroughtthevirtualfingertiptothetarget. Middle graphs plot (unsmoothed) finger speed as a function of time. Right graphs plot theycomponent of finger velocity as a function of time. The shaded regions depict when the virtual finger was hidden from view behind the occluder.
also predict similar initial responses to opposing and step
pertur-bations, whereas observed responses in these conditions differed
greatly in both strength and latency.
The response to opposing perturbations, for which the
rela-tive motion of the virtual finger initially suggests a correction in
the opposite direction of that signaled by the positional error, is
particularly illuminating. Subjects show a response in the correct
direction, but much delayed relative to their responses to the
other perturbations. They behave as if the positional and motion
errors initially serve to cancel out their effects on the controller. A
correction is only seen late because the positional error, by the
nature of the perturbation, shrinks over time (and eventually
changes direction), whereas the motion error remains constant.
These observations lead to the general conclusion that visual
feedback about both the position and motion of the hand
con-tribute to on-line control of reaching movements.
An ideal observer model for feedback control of
reaching movements
To understand how the brain combines motion and position
feedback information for feedback control, and to relate human
performance to the uncertainty that we might expect in those
signals, we simulated the performance of a feedback control
model that optimally integrates visual signals about the position
and velocity of the hand over time. We used data from
psycho-physics on positional and motion acuity, as well as on temporal
smoothing of visual signals, to parameterize the temporal
filter-ing and visual noise components of the model. Such models have
had recent success in accounting for perceptual estimation tasks
in which subjects appear to optimally combine different sources
of sensory information, and in one case feed-forward
informa-tion from motor commands (Ghahramani, 1995; Wolpert et al.,
1995b; Ernst and Banks, 2002; Van Beers et al., 2002).
Figure 5 shows a schematic diagram of the model. The sensory
component of the model is an adaptive Kalman filter that
main-tains a running estimate of the state of the hand using incoming
sensory information and outgoing motor signals. The filter
con-tinuously updates its estimate of hand state by combining its
current estimate with the information derived from new sensory
(visual) signals and an estimate of the motor command that was
most recently sent out to the system. To account for sensorimotor
delays, the filter runs in a delayed loop, and the delayed estimates
of hand state are input into a forward model that uses estimates of
the motor commands sent out during the delay period to
“pre-dict” the current state of the hand from the delayed estimate
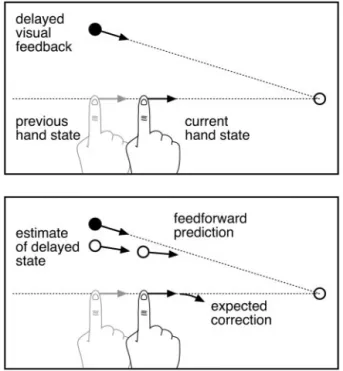
(Miall et al., 1993). Figure 6 illustrates how such a system could
qualitatively account for subjects’ responses to rotation
perturbations.
Because we are concerned primarily with the nature of the
visual feedback used to control reaching movements, we focused
our modeling efforts on the sensory component of the model and
used a simple minimum jerk control law to model the motor
output of the system as a function of estimated hand state (Hoff
and Arbib, 1993). The resulting model is equivalent to the Hoff
and Arbib (1993) model, augmented with a Kalman filter to
op-(a) Exper 1 - Thin occluder
(b) Exper 2 - Large occluder
time after perturbation (ms)
Perturbation influence
100
200
300
0
x10
-3
0
-1
0.5
-0.5
-1.5
time after perturbation (ms)
Perturbation influence
100
200
300
0
x10
-3
0
-1
0.5
-0.5
-1.5
Rotation
Direction
Step
Opposing
Figure 4. Perturbation effects.a, Results for experiment 1, in which the occluder was thin andtheinitialmovementwasvisible.Thefourlinesplottheperturbationinfluencefunctionsfor each of the four perturbation types. The raw weights derived from the regression analysis (see Materials and Methods) were smoothed by a causal exponential filter with time constant 25 msec and then averaged across subjects (n⫽5).b, Results for experiment 2, in which the occluder was large and covered the entire initial movement. The plots show smoothed pertur-bation influence functions, averaged across subjects (n⫽8), as in the previous plot.
Figure 5. Block diagram for the control model. The input to the system is the current best estimates of the state of the hand and the target position. The controller uses a minimum-jerk control law to convert these to a jerk signal (change in acceleration) to which motor noise is added before being applied to modify the motion of the hand. In the model presented here, the plant is trivial, because we assume a perfect kinematic controller. The plant simply integrates the jerk signal to change the acceleration of the hand. Delayed sensory estimates of the state of the hand are combined in an optimal way (through the Kalman gain matrix) with equivalently delayedinternalestimatesofthestateofhand,andupdatedthroughthestateupdateequation togenerateanewestimateofthestateofthehandatthenexttimestep.Theresultingsequence of state estimates are propagated forward through the state update equation, using the motor commands generated during the delay period, to generated ongoing estimates of the current state of the hand.
timally integrate incoming feedback signals. Note that the control
law uses internal estimates of hand position, velocity, and
accel-eration to generate motor commands, although the system that
we model only uses visual feedback about position and velocity.
We simulated a model that incorporates state-dependent
noise on the sensory feedback, with noise levels consistent with
psychophysical measures of motion and position acuity in
hu-mans. The model therefore accommodates speed-dependent
changes in motion discrimination thresholds and
eccentricity-dependent changes in spatial acuity. We also assumed that the
sensory estimates of both hand position and velocity were
tem-porally low-pass filtered in concordance with observed
psycho-physical behavior (Werkhoven et al., 1992). Details are given in
Materials and Methods. Parameters for the sensory filters—the
noise levels for visual estimates of the direction and speed of
finger movement, and the noise levels for visual position
esti-mates—were derived from published psychophysical data as
de-scribed in Materials and Methods. The only free parameters in
the model were the noise terms for the control signal and the
sensorimotor delay. These were set by hand to best fit subjects’
data.
Figure 7 shows example mean trajectories derived from
sim-ulating the model’s performance in the experiment described
here. The model’s corrections are all qualitatively similar to those
shown by human subjects. More illuminating are the results of
fitting the autoregressive model to estimate the perturbation
in-fluence functions for the model, shown in Figure 8
b
. The model
replicates the results of all four perturbations. In particular, it
replicates subjects’ responses both to rotation perturbations (it
shows a small, incorrect initial correction) and to opposing
per-turbations (it shows an apparent increase in the latency of the
response to the perturbation). The model deviates somewhat
from subjects’ behavior at the ends of the movement. This is
likely attributable to the fact that the model did not include
low-pass filtering of the motor output and consequently allowed the
production of physically unrealistic instantaneous changes in
ac-celeration during final corrections.
The performance of the model is very sensitive to the noise
parameters. The response of the model to the opposing
pertur-bations, in particular, deviates from subjects’ performance when
the relative levels of noise in the position and velocity signals are
changed by as little as 25%. Changing the noise levels by
ⱖ
100%
leads to more dramatic effects, such as significantly slowing the
response to direction perturbations when the velocity noise is
increased or greatly attenuating the response to the rotation
per-turbation when the position noise is increased. To illustrate the
importance of including both position and velocity feedback, we
simulated models that use only one or the other. The constrained
models maintain state estimates of position, velocity, and
accel-eration, as required for the minimum-jerk control law, but only
use visual feedback about either position or velocity. Thus, the
position feedback-only model effectively uses changes in the
po-sition signal over time to update its internal estimate of velocity.
The velocity feedback-only model effectively integrates the
veloc-ity feedback signal to update its internal estimate of position. As
shown in Figure 8,
c
and
d
, eliminating either position of motion
feedback dramatically changes the responses of the model to the
perturbations and makes it impossible to fit subjects’
perfor-mance. The qualitative pattern of behavior for these models is
invariant to the free parameters of the model (sensorimotor delay
and motor noise parameters).
We can apply linear systems analysis to both subjects’ and
model performance data to glean a deeper understanding of
sub-jects’ on-line control. Were the human control system linear, the
autoregressive model that we fit to the data would be the optimal
predictor of measured finger position. The perturbation weight
functions would also show the property of superposition: the
weight functions derived from a perturbation that was the sum of
two “base” perturbations would be equal to the sum of the weight
functions derived separately for the base perturbations. Over the
Figure 6. Illustration of how the model would respond to rotation perturbations.a, The situation at the moment when the controller first has access to visual feedback, after the hand has come back into view. Because of sensory delay, the visual feedback corresponds to a previ-ous state of the hand.b, To estimate current hand state, the new visual feedback is combined with the previous estimate of hand state (which at the moment of reappearance would corre-spond, on average, to the actual hand state) and propagated in time through a forward model of the system dynamics (using the motor commands sent out during the delay period). Because theperturbedvisualpathisrotatedrelativetotheactualpath,extrapolationwouldgenerallybe inaccurate, leading to a “correction” away from the target direction.
Figure 7. Sample mean trajectories of the model, for the same conditions as shown previ-ously in Figure 3.
duration in which they could effect
sub-jects’ behavior, the average perturbations
of any two of our perturbation classes,
ex-pressed as a function of time, were
approx-imately linear sums of the other two (e.g.,
the step perturbation was equal to the sum
of the rotation perturbation and the
direc-tion perturbadirec-tion). Figure 9 shows that
subjects’ perturbation weight functions do
follow the law of superposition. Similarly
for the model, although it is only
quasilin-ear (because of the state-dependent noise),
the perturbation weight functions derived
from the model’s performance also show
good superposition.
The superposition analysis shown in
Figure 9 may be seen as reflecting how the
relative errors in feedback about fingertip
position, on the one hand, and motion, on
the other, combine to generate corrective
movements of the hand. When
perturba-tions affect position and motion signals in
opposite directions, as in the opposing
perturbation condition, the feedback from
the two signals almost exactly cancel each
other for a period after the perturbation.
Only when the position error shrinks does
the system begin to respond to the motion
error.
Discussion
Although the role of visual feedback from
the hand for guiding movements has been
the focus of extensive work (Keele and
Posner, 1968; Carlton, 1981; Connolly and
Goodale, 1999; Saunders and Knill, 2003), previous studies have
addressed only basic issues of whether visual feedback
contrib-utes at various times during movements and the speed and
mag-nitude of on-line corrections. More specific questions, like what
visual control signals are used or how they are incorporated with
nonvisual information, remain virtually unexplored. A novel
as-pect of the experiments reported here is that they distinguish
different ways that visual feedback could be used. By using an
inter-active virtual environment, we were able to test various dynamic
remappings of visual space that differentiate between classes of
feed-back control strategies.
The results demonstrate that visual feedback control during
the fast phase of movements is not simply on the basis of the
direction of hand motion relative to the target. Subjects made
responses even when perturbations did not alter the relationship
between hand motion and target direction, and conditions that
introduced the same changes in target directional error produced
different responses. To account for these effects, the feedback
control mechanism must be sensitive to the conflicts between
perturbed and actual hand position and not just to the direction
of the hand relative to the target. The results also rule out a
strategy based solely on visual position, such as steering to
main-tain a planned kinematic path or setting the desired
instanta-neous velocity based on the difference in hand and target position
as in the VITE model (Bullock and Grossberg, 1988). In the case
of direction perturbations, subjects responded before there was
any significant conflict between actual and visually presented
hand position, and perturbations that created matched positional
conflicts produced different results depending on the visual
di-rection of the hand. We conclude that both position and motion
feedback signals are used for on-line control of hand movements.
As an analytical tool, we simulated the performance of a
feed-back controller that optimally integrates noisy visual estimates of
hand position and velocity with a running estimate of hand state
using a Kalman filter. We found that, with realistic assumptions
about sensory noise and feedback delay, we were able to
repro-duce the pattern of perturbation responses observed in the
hu-man data. Moreover, the relative contributions of position and
motion signals implied by the perturbation influence functions is
consistent with what is known about position and motion acuity
in human observers. Thus, subjects’ responses to the
perturba-tions were consistent with the noise levels to be expected in visual
feedback signals.
It has been suggested previously that control based on visual
position is slower than motion based-control and limited to final
adjustments at the end of movements, when the hand is in central
vision (Paillard, 1981, 1996; Blouin et al., 1993). Our results do
not support such a qualitative distinction between the
contribu-tions of motion and position feedback signals. Responses to
per-turbations affecting position and direction were equally fast and
in both cases would have had to begin when the hand was near
peak velocity. Rather, humans appear to integrate position and
velocity feedback in a manner consistent with the reliability of the
signals.
The sensorimotor reaction time apparent in the influence
functions shown in Figure 4 is on the order of 150 –170 msec. This
Figure 8. Perturbation influence functions for human and model data.a, Replotting of the human data from experiment 2.b, Simulated responses of a feedback controller that optimally integrates both position and motion information to estimate hand state, to the same perturbation conditions tested in the human data (see Results for details). For each perturbation condition, we “ran”themodelonmanysimulatedtrialsandappliedthesameregressionanalysistothemodelkinematicstoderiveperturbation weight functions for the model. Parameters for the simulations are given in Materials and Methods.c, Performance of the model if only feedback about hand position is used. The two notable deviations from human performance are that the model responds incorrectly to the initial positional error created by the opposing perturbation, and it responds much more slowly to the direction perturbations.d, Performance of the model if only velocity feedback is used. The model deviates dramatically from human performance. Note, however, that this model does not correspond to the homing strategy described in Results.
is somewhat slower than other estimates of reactions to large
perturbations in target position (Goodale et al., 1986; Prablanc
and Martin, 1992; Brenner and Smeets, 1997). Much of this
dif-ference is likely to be caused by the small size of the perturbations;
however, we should note that the model showed similar apparent
reaction times when the sensory delay built into the model was
only 115 msec. The difference between the assumed sensory delay
in the model and the appearance of significant responses to
per-turbations in the kinematics can be attributed to, on the one
hand, the accrual over time of the influence of sensory feedback
on internal state estimates in the Kalman filter, and on the other
hand, to the effective low-pass properties of the minimum jerk
controller, which makes smooth corrections rather than sharp
ones.
Miall et al. (1993) propounded the idea that the visuomotor
system uses a forward model to deal with long delays in sensory
feedback. Data from adaptation studies are consistent with the
hypothesis that the brain compensates for delayed estimates of
hand state by propagating motor commands through a forward
model of hand dynamics (Bhushan and Shadmehr, 1999).
Al-though our experiments do not directly test this hypothesis, it is
difficult to see how a system without some form of prediction
could account for the results. The perturbations occurred when
subjects’ fingertips reappeared from behind the occluder, a point
in the trajectory at which the hand was moving at near peak
velocity. Given the visuomotor delay fit in the model (115 msec),
subjects’ fingertips would have been
⬃
6 –9 cm closer to the target
and moving much slower than indicated by the initial perturbed
sensory feedback when the visual feedback would have begun to
influence the movement. Without some form of compensation
for the change in hand state that accrued during the sensory delay
period, the system would have been unable to accurately correct
for the perturbations.
The model simulated here used a simple minimum jerk
con-trol scheme, which did not take into account the dynamics of the
musculoskeletal system. This model could potentially be refined
by deriving an optimal dynamic control law for determining the
neural control signals to send out to a model of the
musculoskel-etal system (Todorov and Jordan, 2002). Although this would be
a significant improvement on our control model, we doubt that it
would significantly impact the results relating to the weighting of
feedback signals. Any reasonable control law will base its signals
on the estimated state of the hand relative to the target, as does the
minimum-jerk law. When the estimated hand position and
ve-locity indicate that the hand is moving along a trajectory below
the average trajectory, a controller will send a signal that includes
a compensatory component. Thus, although the magnitude of
instantaneous corrective responses will vary between controllers,
the directions will not. The important qualitative conclusions
that we have drawn should therefore generalize across a wide class
of control laws.
References
Bhushan N, Shadmehr R (1999) Computational nature of human adaptive control during learning of reaching movements. Biol Cybern 81:39 – 60. Blouin J, Teasdale N, Bard C, Fleury M (1993) Directional control of rapid
arm movements: the role of the kinetic visual feedback system. Can J Exp Psychol 47:678 – 696.
Brenner E, Smeets JBJ (1997) Fast responses of the human hand to changes in target position. J Motor Behav 29:297–310.
Bullock D, Grossberg S (1988) Neural dynamics of planned arm move-ments: emergent invariants and speed-accuracy properties during trajec-tory formation. Psychol Rev 95:49 –50.
Burbeck CA (1987) Position and spatial frequency in large-scale localization judgments. Vision Res 27:417– 428.
Burbeck CA, Yap YL (1990) Two mechanisms for localization? Evidence for separation-dependent and separation-independent processing of posi-tion informaposi-tion. Vision Res 30:739 –750.
Carlton LG (1981) Processing visual feedback information for movement control. J Exp Psychol 7:1019 –1030.
Connolly JD, Goodale MA (1999) The role of visual feedback of hand posi-tion in the control of manual prehension. Exp Brain Res 125:281–286. De Bruyn B, Orban GA (1988) Human velocity and direction
discrimina-tion measured with dot patterns, Vision Res 28:1323–1336.
Ernst MO, Banks MS (2002) Humans Integrate visual and haptic informa-tion in a statistically optimal fashion. Nature 415:429 – 433.
Ghahramani Z (1995) Computation and psychophysics of sensorimotor in-tegration. PhD thesis, Massachusetts Institute of Technology.
Goodale MA, Pelisson D, Prablanc C (1986) Large adjustments in visually guided reaching do not depend on vision of the hand or perception of target displacement. Nature 320:748 –750.
Hoff B, Arbib MA (1993) Models of trajectory formation and temporal in-teraction of reach and grasp. J Motor Behav 25:175–192.
Keele SW, Posner MI (1968) Processing of visual feedback in rapid move-ments. J Exp Psychol 77:155–158.
Levi DM, Klein SA, Yap YL (1988) Weber’s law for position: unconfounding the role of separation and eccentricity. Vision Res 28:597– 603. Mateef S, Dimitrov G, Genova B, Likova L, Stefanova M, Hohnsbein J (2000)
The discrimination of abrupt changes in speed and direction of visual motion. Vision Res 40:409 – 416.
Miall RC, Weir DJ, Wolpert DM, Stein JF (1993) Is the cerebellum a Smith predictor? J Motor Behav 25:203–216.
Orban GA, Van Calenbergh F, De Bruyn B, Maes H (1985) Velocity discrimination in central and peripheral vision. J Opt Soc Am A 11:1836 –1847.
Figure 9. Illustration of superposition on the perturbation effects. Both in the human data (a,b) and in the model data (c), responses to step perturbations were approximately the sum of responsestodirectionandrotationperturbations,andresponsestoopposingperturbationswereapproximatelythedifferenceofresponsestodirectionandrotationperturbations.Theresultsshown here are averaged across subjects. Individual subjects’ data showed similar relations.
Figure


Related documents
